

Spatiotemporal Assessment of COVID-19 Spread over Oman Using GIS Techniques
- PMID: 34723076
- PMCID: PMC7721548
- DOI: 10.1007/s41748-020-00194-2
Spatiotemporal Assessment of COVID-19 Spread over Oman Using GIS Techniques
Abstract
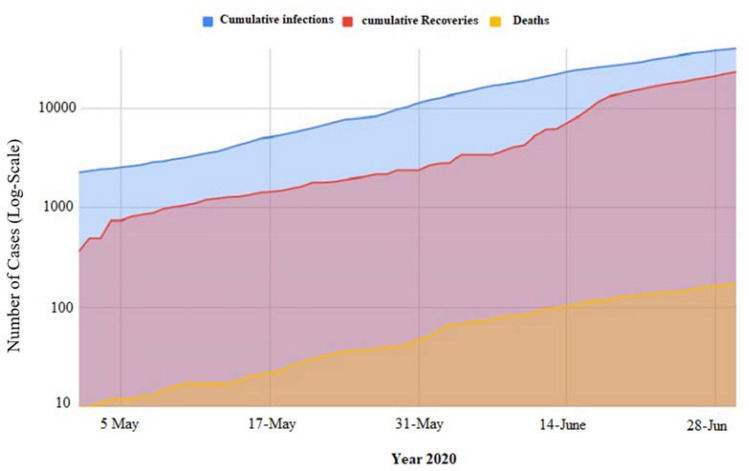
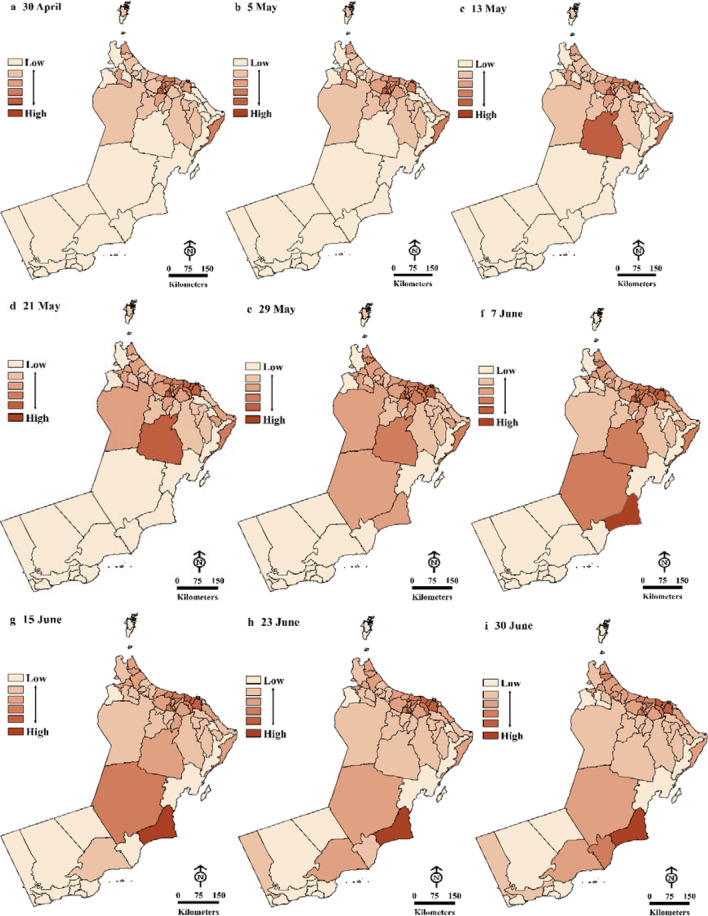
Coronavirus disease (COVID-19), caused by acute respiratory syndrome coronavirus 2 (SARS-CoV-2), is a worldwide challenge effecting millions of people in more than 210 countries, including the Sultanate of Oman (Oman). Spatiotemporal analysis was adopted to explore the spatial patterns of the spread of COVID-19 during the period from 29th April to 30th June 2020. Our assessment was made using five geospatial techniques within a Geographical Information System (GIS) context, including a weighted mean centre (WMC), standard deviational ellipses, Moran's I autocorrelation coefficient, Getis-Ord General-G high/low clustering, and Getis-Ord statistic. The Moran's I-/G- statistics proved that COVID-19 cases in datasets (numbers of cases) were clustered throughout the study period. The Moran's I and Z scores were above the 2.25 threshold (a confidence level above 95%), ranging from 2274 cases on 29th April to 40,070 cases on 30th June 2020. The results of showed varying rates of infections, with a large spatial variability between the different wilayats (district). The epidemic situation in some wilayats, such as Mutrah, As-Seeb, and Bowsher in the Muscat Governorate, was more severe, with Z score higher than 5, and the current transmission still presents an increasing trend. This study indicated that the directional pattern of COVID-19 cases has moved from northeast to northwest and southwest, with the total impacted region increasing over time. Also, the results indicate that the rate of COVID-19 infections is higher in the most populated areas. The findings of this paper provide a solid basis for future study by investigating the most resolute hotspots in more detail and may help decision-makers identify targeted zones for alleviation plans.
Supplementary information: The online version contains supplementary material available at 10.1007/s41748-020-00194-2.
Keywords:
© The Author(s) 2020.
Conflict of interest statement
Conflict of InterestNon declared.
Figures


References
-
- Alkamali N, Alhadhrami N, Alalouch C. Muscat City expansion and Accessibility to the historical core: Space syntax analysis. Energy Proc. 2017;115:480–486. doi: 10.1016/j.egypro.2017.05.044. - DOI
-
- Allam Z, and Jones DS. 2020. On the coronavirus (COVID-19) outbreak and the smart city network: universal data sharing standards coupled with artificial intelligence (AI) to benefit urba health monitoring and management. Healthcare: Multidisciplinary Digital Publishing Institute. p 46. 10.3390/healthcare8010046 - PMC - PubMed
LinkOut - more resources
Full Text Sources
Research Materials
Miscellaneous