Reactive Task Performance Under Varying Loads in Division I Collegiate Soccer Athletes
- PMID: 34723177
- PMCID: PMC8548568
- DOI: 10.3389/fspor.2021.707910
Reactive Task Performance Under Varying Loads in Division I Collegiate Soccer Athletes
Abstract
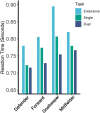
This study was conducted to identify whether team-wide or positional differences exist in simple or choice reactivity of collegiate soccer athletes when completed under various loads. Much research exists surrounding the assessment of reaction time in the general population, but given variations in training, little insight exists surrounding how unique and elite populations may differ based upon performance demands and task translatability to training. Reactive performance was assessed using the Dynavision D2 in 24 female soccer players (19.73 ± 1.05 years old) from a team within a power five conference of the National Collegiate Athletic Association. Evaluated loads included two conditions of simple reactivity (no additional load and with a concurrent lower body motor task) and three conditions of choice reactivity (no additional load, with a concurrent lower body motor task, and prolonged durations). Paired t-tests and ANOVAs were used to identify differences in task performance based upon load and positional group. No significant load-based or positional differences existed in measured simple reaction times. Performances in choice reaction tasks across the team were found to be slower when completed across extended durations (p < 0.0001) and faster when completed concurrent with an added balance task (p = 0.0108), as compared to performance under normal conditions. By assessment of positional differences, goalkeepers tended to be slower than other positions in reactivity during choice tasks, despite no differences existing in simple task performance. Given the unique population utilized herein, measured reactivity in different tasks suggests a strong relation to the training demands of soccer, as well as those of goalkeepers as compared to field positions. Findings suggest that sport and positional demands may be substantial contributors to population- and individual-based reactivity performance.
Keywords: athletes; choice reaction time; load-bearing; performance; simple reaction time; soccer; training demands.
Copyright © 2021 Rentz, Brandmeir, Rawls and Galster.
Conflict of interest statement
The authors declare that the research was conducted in the absence of any commercial or financial relationships that could be construed as a potential conflict of interest.
Figures


References
-
- Appelbaum L. G., Erickson G. (2018). Sports vision training: a review of the state-of-the-art in digital training techniques. Int. Rev. Sport Exerc. Psychol. 11, 160–189. 10.1080/1750984X.2016.1266376 - DOI
LinkOut - more resources
Full Text Sources

