. 2021 Oct 26;3(10):4337-4347.
doi: 10.1021/acsaelm.1c00516. Epub 2021 Oct 12.

PO x /Al2O3 Stacks for c-Si Surface Passivation: Material and Interface Properties

Affiliations

PO x /Al2O3 Stacks for c-Si Surface Passivation: Material and Interface Properties

Roel J Theeuwes et al. ACS Appl Electron Mater. .

Abstract

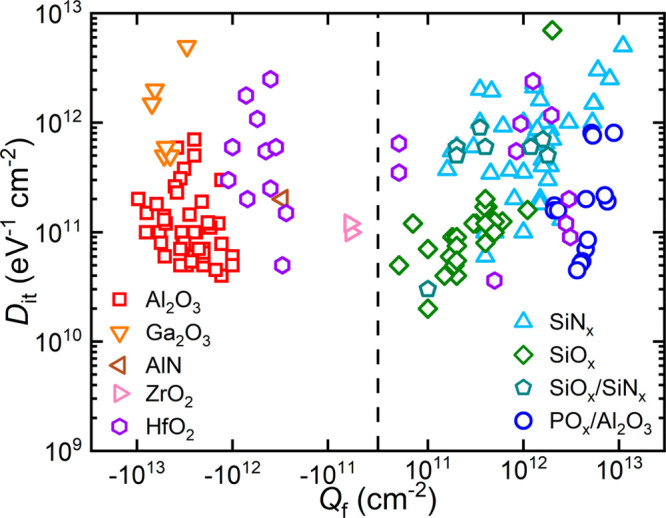
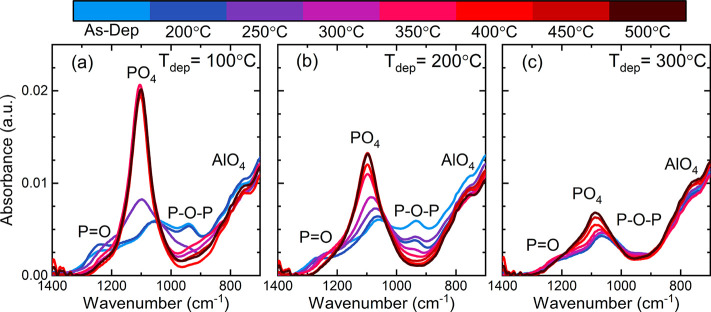
Phosphorus oxide (PO x ) capped by aluminum oxide (Al2O3) has recently been discovered to provide excellent surface passivation of crystalline silicon (c-Si). In this work, insights into the passivation mechanism of PO x /Al2O3 stacks are gained through a systematic study of the influence of deposition temperature (T dep = 100-300 °C) and annealing temperature (T ann = 200-500 °C) on the material and interface properties. It is found that employing lower deposition temperatures enables an improved passivation quality after annealing. Bulk composition, density, and optical properties vary only slightly with deposition temperature, but bonding configurations are found to be sensitive to temperature and correlated with the interface defect density (D it), which is reduced at lower deposition temperature. The fixed charge density (Q f) is in the range of + (3-9) × 1012 cm-2 and is not significantly altered by annealing, which indicates that the positively charged entities are generated during deposition. In contrast, D it decreases by 3 orders of magnitude (∼1013 to ∼1010 eV-1 cm-2) upon annealing. This excellent chemical passivation is found to be related to surface passivation provided by hydrogen, and mixing of aluminum into the PO x layer, leading to the formation of AlPO4 upon annealing.


Conflict of interest statement

The authors declare no competing financial interest.

Figures

Figure 1
Figure 1
An overview of c-Si surface passivation materials and stacks in terms of interface defect density (Dit) and fixed charge density (Qf). Dit with corresponding Qf are given for Al2O3,,,− POx/Al2O3, SiNx, SiOx, SiOx/SiNx,, Ga2O3,, AlN, ZrO2, and HfO2. The data are divided into materials with negative (left) and positive (right) fixed charge on silicon. Other passivating materials, which are not shown because the magnitudes of Dit or Qf have not been reported in the literature, include: Ta2O5 (negative Qf), TiO2 (negative Qf), Nb2O5 (negative Qf), and a-Si:H (very low Dit).
Figure 2
Figure 2
Maximum effective surface recombination velocity (Seff,max), as a function of annealing temperature for POx/Al2O3 stacks on 280 Ωm-thick double-side-polished 3.3–3.7 Ω cm n-type FZ Si wafers with deposition temperatures ranging from 100 to 300 °C. Annealing was performed at consecutively higher annealing temperatures starting at 300 °C in steps of 50 °C up to 500 °C on the same samples for 10 min in N2.
Figure 3
Figure 3
(a) Overall refractive index (λ = 589 nm), (b) overall mass density, (c) atomic hydrogen content, and (d) atomic concentrations of O, Al, and P in POx/Al2O3 stacks, as a function of deposition temperature, together with values for Al2O3 films from ref (52) (Refractive index, mass density, and hydrogen content only). Open symbols represent annealed films (400 °C in N2 for 10 min) and closed symbols represent as-deposited films. The refractive index was obtained by spectroscopic ellipsometry, while the mass density and the compositional data were extracted from RBS and ERD.
Figure 4
Figure 4
Maximum effective surface recombination velocity Seff,max as a function of deposited corona charge density for POx/Al2O3 stacks prepared at temperatures ranging from 100 to 300 °C. The peaks in Seff,max represent the point at which the deposited corona charge has fully compensated the fixed charge (Qf) in the layer. The fixed charge has the same magnitude as the deposited corona charge at the Seff,max peak position, but has the opposite polarity.
Figure 5
Figure 5
Interface properties of POx/Al2O3 stacks deposited at various deposition temperatures annealed at 400 °C and an as-deposited stack deposited at 100 °C. (a) Fixed charge density (Qf) as determined by CV measurements and corona-lifetime experiments. (b) Interface defect density (Dit) as determined by CV measurements and the peak value of the maximum surface recombination velocity Seff,max peak determined from the data in Figure 4. This value is a measure for the surface defect density.
Figure 6
Figure 6
Cross-sectional bright-field TEM image of a POx/Al2O3 stack deposited at 100 °C on c-Si. The sample was annealed at 400 °C. SiOx was deposited on top of the stack to protect the layers during the TEM lamella preparation by FIB.
Figure 7
Figure 7
Infrared spectra revealing oxygen-related bonding configurations of POx/Al2O3 stacks deposited at (a) 100 °C, (b) 200 °C, and (c) 300 °C on 280 Ωm-thick double-side polished 1–5 Ω cm n-type float zone (FZ) Si (100) wafers. The stacks were measured in the as-deposited state and after subsequent annealing (10 min in N2) starting at 200 °C with 50 °C increments up to 500 °C, as indicated by the color bar.
Figure 8
Figure 8
ToF-SIMS measurements of POx/Al2O3 stacks deposited at 100 °C, in the as-deposited state and annealed at 400 °C. The intensity of the negative ions originating from the sample is plotted as a function of depth. The depth is calculated by assuming a constant sputter rate throughout all layers and a total stack thickness of 15 nm. The vertical dashed lines indicate the different layers in the stack, which consist of around 10 nm Al2O3, 5 nm POx, 1 nm SiOx, and finally the Si substrate. A set of ions is shown in each panel: (a) hydrogen- and oxygen-related, (b) aluminum-related, (c) phosphorus-related, and (d) silicon-related ions. The intensities are normalized to the Si bulk signal (set to 1000).
Figure 9
Figure 9
Hydrogen effusion rate dN/dt as a function of temperature (heating rate 20 °C/min) for POx/Al2O3 stacks deposited at different temperatures. The measurements were done in vacuum, and the apparatus was baked out prior to the measurements to eliminate influences of background water on the measured hydrogen effusion spectra.

References

    1. Dingemans G.; Kessels W. M. M. Status and prospects of Al2O3-based surface passivation schemes for silicon solar cells. J. Vac. Sci. Technol., A 2012, 30 (4), 040802.10.1116/1.4728205. - DOI
    1. Bonilla R. S.; Hoex B.; Hamer P.; Wilshaw P. R. Dielectric surface passivation for silicon solar cells: A review. Phys. Status Solidi A 2017, 214 (7), 1700293.10.1002/pssa.201700293. - DOI
    1. Aberle A. G. Surface passivation of crystalline silicon solar cells: a review. Prog. Photovoltaics 2000, 8 (5), 473–487. 10.1002/1099-159X(200009/10)8:5<473::AID-PIP337>3.0.CO;2-D. - DOI
    1. Melskens J.; van de Loo B. W.; Macco B.; Black L. E.; Smit S.; Kessels W. M. M. Passivating contacts for crystalline silicon solar cells: From concepts and materials to prospects. IEEE Journal of Photovoltaics 2018, 8 (2), 373–388. 10.1109/JPHOTOV.2018.2797106. - DOI
    1. Black L. E.; Van De Loo B. W. H.; Macco B.; Melskens J.; Berghuis W. J. H.; Kessels W. M. M. Explorative studies of novel silicon surface passivation materials: Considerations and lessons learned. Sol. Energy Mater. Sol. Cells 2018, 188, 182–189. 10.1016/j.solmat.2018.07.003. - DOI