. 2021 Jul;1(7):585-597.
doi: 10.1038/s43587-021-00072-0. Epub 2021 Jul 8.

Glial AP1 is activated with aging and accelerated by traumatic brain injury

Affiliations

Glial AP1 is activated with aging and accelerated by traumatic brain injury

China N Byrns et al. Nat Aging. 2021 Jul.

Abstract

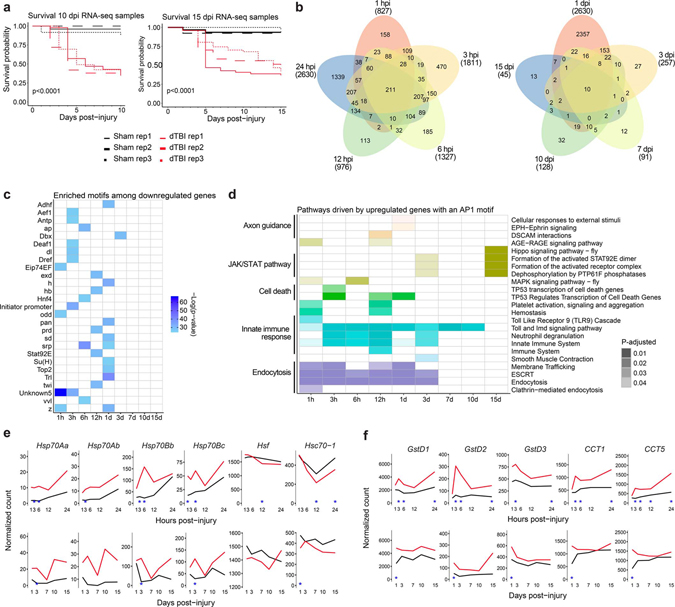
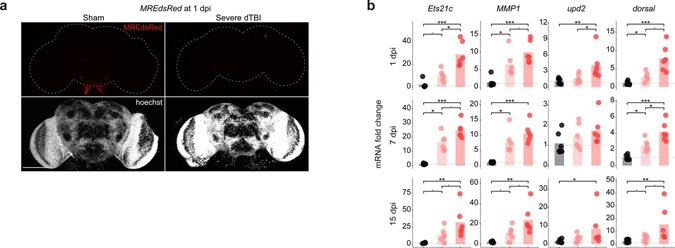
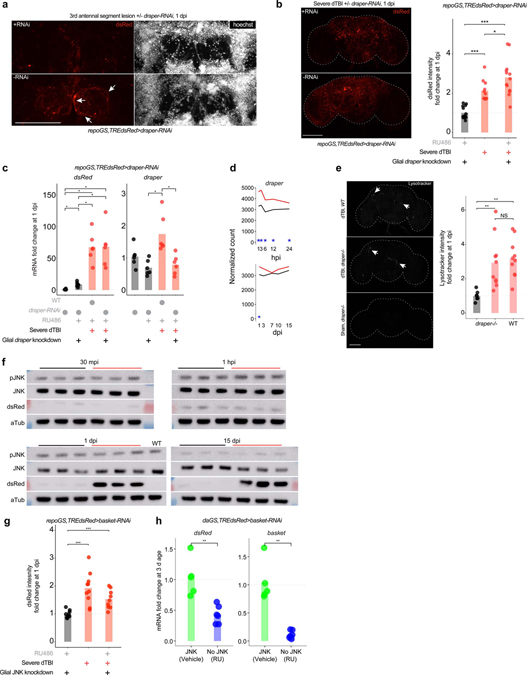
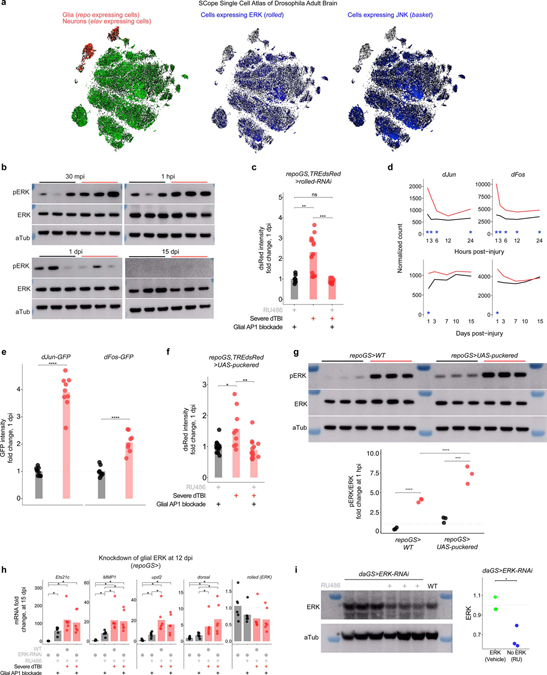
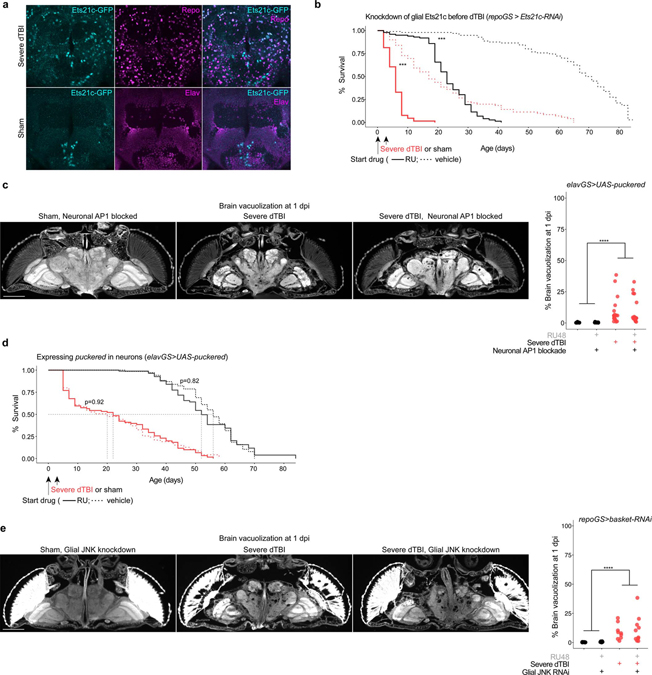
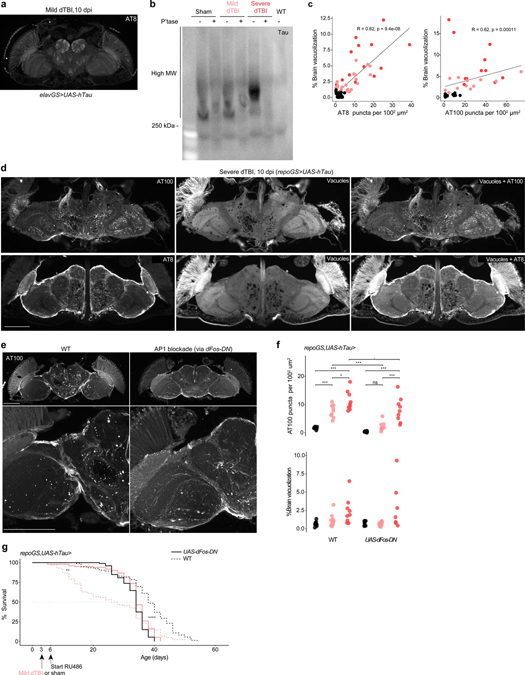
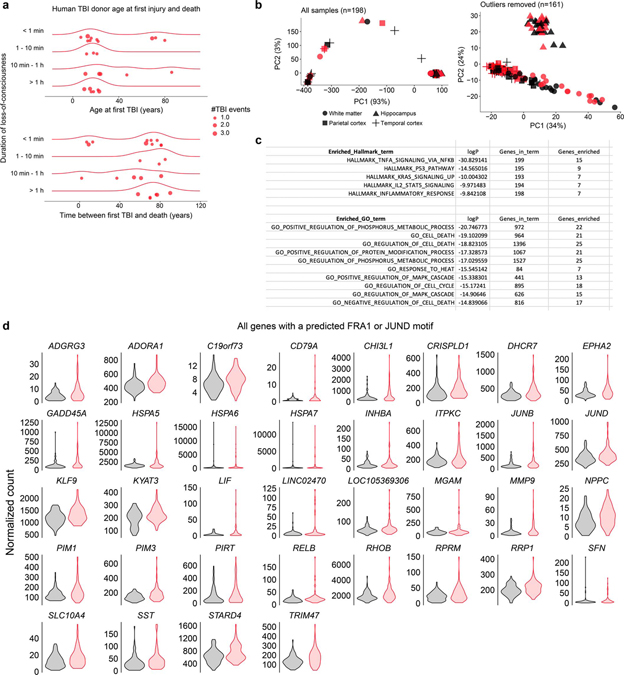
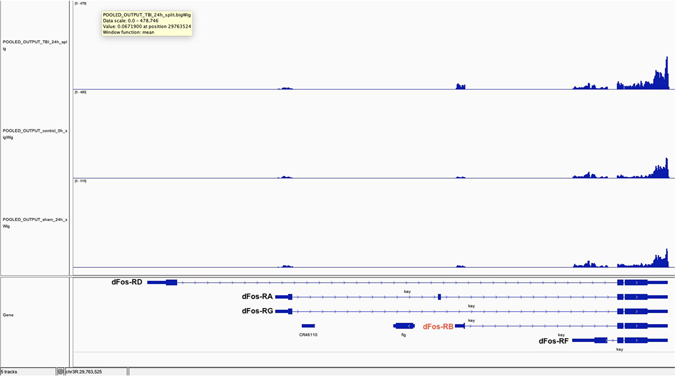
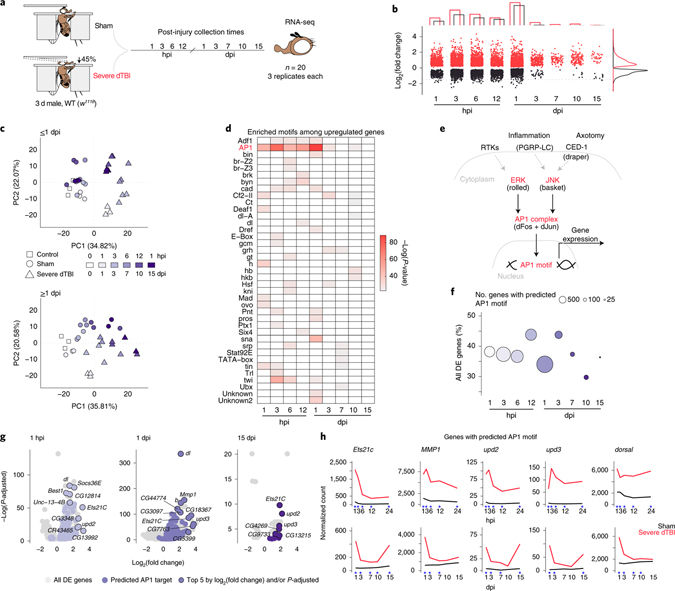
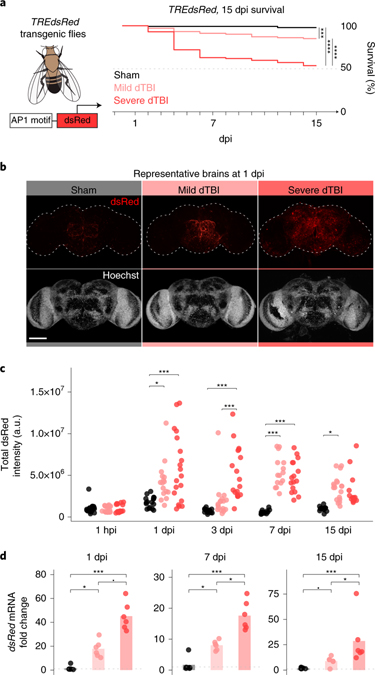
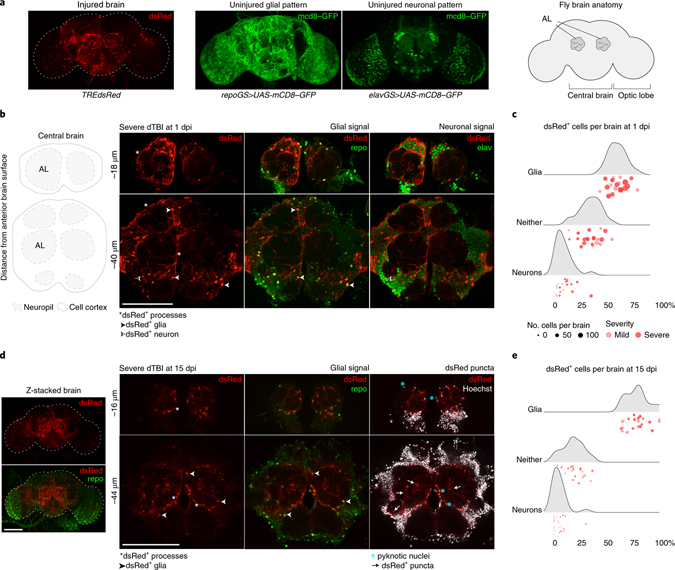
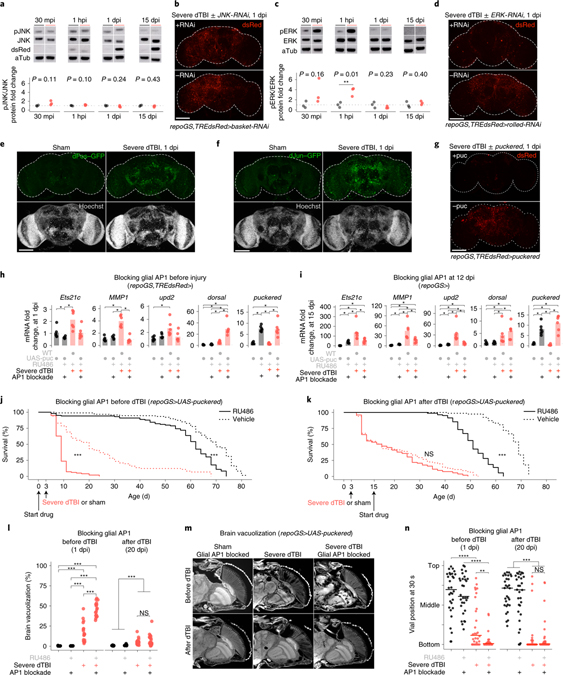
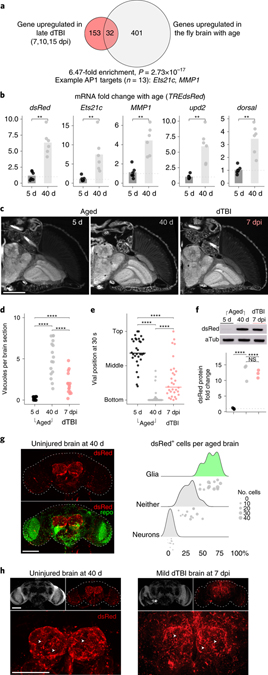
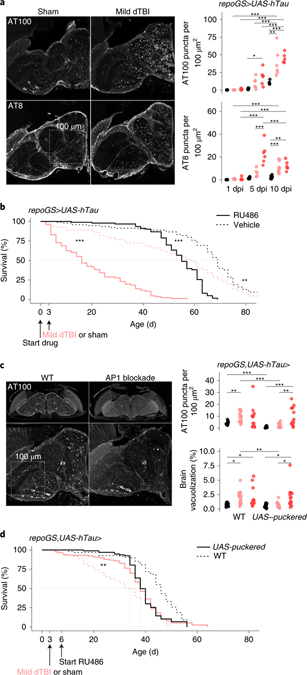
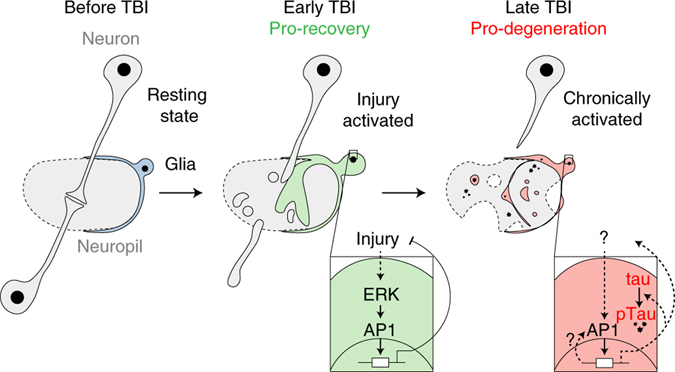
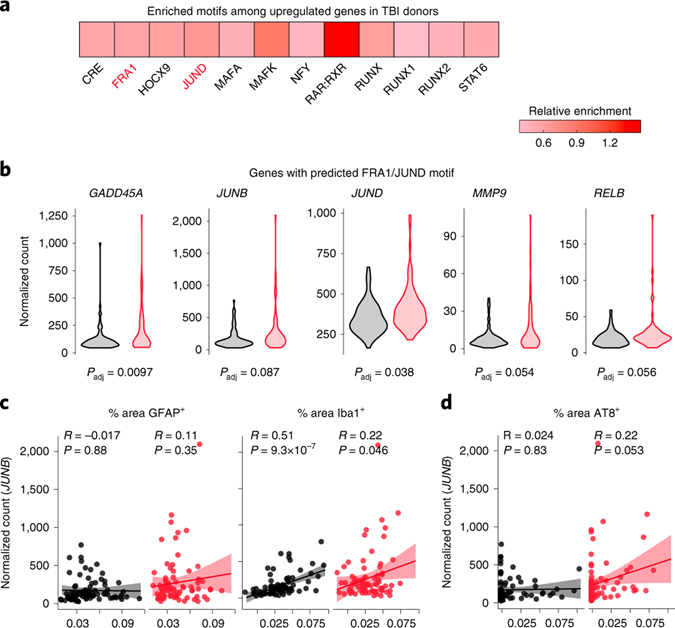
The emergence of degenerative disease after traumatic brain injury is often described as an acceleration of normal age-related processes. Whether similar molecular processes occur after injury and in age is unclear. Here we identify a functionally dynamic and lasting transcriptional response in glia, mediated by the conserved transcription factor AP1. In the early post-TBI period, glial AP1 is essential for recovery, ensuring brain integrity and animal survival. In sharp contrast, chronic AP1 activation promotes human tau pathology, tissue loss, and mortality. We show a similar process activates in healthy fly brains with age. In humans, AP1 activity is detected after moderate TBI and correlates with microglial activation and tau pathology. Our data provide key molecular insight into glia, highlighting that the same molecular process drives dynamic and contradictory glia behavior in TBI, and possibly age, first acting to protect but chronically promoting disease.


Conflict of interest statement

Declaration of Interests: The authors declare no competing interests.

Figures

Extended Data Fig 1 |
Extended Data Fig 1 |. A lasting AP1 transcriptional response to TBI.
a, Kaplan-Meier survival curve for 10 and 15 dpi RNAseq replicates. b, Venn diagram showing the number of common and distinct differentially expressed genes (FDR<0.05) between post-injury times. Value in parenthesis shows total (up and down) number of DE genes for a given timepoint. c, Results for HOMER de novo motif enrichment among downregulated genes (FDR<0.05). d, Tile plot showing Reactome pathways enriched among upregulated genes with a predicted AP1 motif (FDR<0.05). Presence of a colored tile indicates enrichment at a given post-injury time. Tile opacity encodes significance. Color corresponds to the parent process, as defined by the Reactome annotation database (annotated on left). e, Average sham (black) and severe dTBI (red) expression of genes related to the heat shock response at 1 dpi (top) and 1 dpi (bottom; blue star indicates FDR < 0.05 at a given time). f, Average sham (black) and severe dTBI (red) expression of canonical stress response genes at 1 dpi (top) and ≥1 dpi (bottom; blue star indicates FDR < 0.05 at a given time). See Supplementary Table 1 for genotypes.
Extended Data Fig. 2 |
Extended Data Fig. 2 |. Sustained and severity-dependent activation of AP1.
a, Representative z-stacked whole mount brains at 1 dpi in flies with dsRed expressed under a mutated TRE-promoter (MREdsRed; representative of n = 9 – 11 brains per condition from two independent experiments). b, Mean relative expression of select RNAseq predicted AP1 genes by RT-qPCR at 1, 7 and 15 dpi across injury conditions (each point = 1 biological replicate, 9 dissected brains; n = 6 biological replicates per condition; Kruskal–Wallis test with Dunn’s multiple comparison test and Holm adjustment for each gene). Black symbols, sham. Pink symbols, mild dTBI. Red symbols, severe dTBI. Statistical annotations are ****p<0.0001, ***p<0.001, **p<0.01, *p<0.05, .<p<0.10. All scale bars 100 μm. See Supplementary Table 1 for genotypes.
Extended Data Fig. 3 |
Extended Data Fig. 3 |. Glial AP1 activation is draper and JNK-independent.
a, Representative z-stack of the first 6 slices (2 μm each) of the antennal lobe in flies with (RU; top) and without (vehicle; bottom) draper-RNAi in glia. White arrows highlight hypertrophic glial processes. Image shown is 1 day after 3rd antennal segment ablation (abbreviated AL injury; images are representative of n = 7 – 9 brains per condition). b, Left, representative z-stacked whole mount brains at 1 day post-dTBI with (RU; top) and without (vehicle; bottom) draper-RNAi in glia. Right, quantification of dsRed immunofluorescence fold change, relative to left most condition (each point = 1 brain; n = 11 – 14 brains per condition pooled from two independent experiments; p = 2.17e-06, Kruskal–Wallis test with Wilcoxon rank sum test). c, Mean relative expression of dsRed and draper mRNA by RT-qPCR at 1 dpi, with or without glial draper-RNAi (each point = 1 biological replicate, 9 dissected brains; n = 6 biological replicates per condition; Kruskal–Wallis test with Dunn’s multiple comparison test and Holm adjustment). d, Average sham (black) and severe dTBI (red) expression of draper from RNAseq experiment at 1 dpi (top) and 1 dpi (bottom; blue star indicates FDR < 0.05 at a given time). e, Representative whole mount IF for lysotracker signal at 1 dpi after severe dTBI in WT (top; w1118) and draper−/− flies (middle: dTBI; bottom: sham). Right, quantification of lysotracker immunofluorescence fold change, relative to left most condition (each point = 1 brain; n = 7 – 11 brains per condition pooled from two independent experiments; p = 0.00072, Kruskal–Wallis test with Dunn’s multiple comparison test and Holm adjustment). f, Western immunoblots for all replicates of Fig. 4a. Samples are biological replicates. WT is w1118. g, Quantification of dsRed immunofluorescence fold change for representative whole mount brains shown in Fig. 4b, relative to left most condition (each point = 1 brain; n = 9–10 brains per condition pooled from two independent experiments; p = 0.000238, Kruskal–Wallis test with Wilcoxon rank sum test). h, Mean relative expression of basal dsRed and basket mRNA by RT-qPCR in 3 d old whole flies, with (blue) or without JNK (green) RNAi expressed under a ubiquitous driver, daughterlessGeneSwitch (each point = 1 biological replicate, 20 whole flies; Student’s t-test). a-g, Black symbols, sham Red symbols, severe dTBI. Statistical annotations are ****p<0.0001, ***p<0.001, **p<0.01, *p<0.05. All scale bars 100μm. See Supplementary Table 1 for genotypes.
Extended Data Fig. 4 |
Extended Data Fig. 4 |. AP1 activation requires ERK.
a, Images from Scope Single Cell Atlas of the Drosophila adult brain showing relative expression levels of repo, elav, rolled (ERK), and basket (JNK). ERK is detected in a greater proportion of repo+ cells than JNK. b, Western immunoblots for all replicates of Fig. 4c. Samples are biological replicates. Genotype is TREdsRed. c, Quantification of dsRed immunofluorescence fold change for representative whole mount brains shown in Fig. 4d, relative to leftmost condition (each point = 1 brain; n = 9–15 brains per condition pooled from two independent experiments; p = 6.08e-7, one-way ANOVA with Tukey’s test). d, RNAseq data showing average sham (black) and severe dTBI (red) expression of dFos and dJun at ≤1 dpi (top) and ≥1 dpi (bottom; blue star indicates FDR < 0.05 at a given time). e, Quantification of dJun-GFP (left) and dFos-GFP (right) immunofluorescence fold change for representative whole mount brains shown in Fig. 4e and 4f, relative to sham (each point = 1 brain; n = 7–10 brains per condition pooled from two independent experiments; Student’s t-test for each genotype). f, Quantification of dsRed immunofluorescence fold change for representative whole mount brains shown in Fig. 4g, relative to leftmost condition (each point = 1 brain; n = 9–15 brains per condition pooled from two independent experiments; p = 0.0040, one-way ANOVA with Tukey’s test). g, Glial expression of the MAPK phosphatase, puckered, does not reduce pERK levels at 1 hpi. Left, full western blots. Right, quantification of pERK/ERK ratio by western immunoblot (each point = 1 biological replicate, 8 dissected brains; n = 3 biological replicates per condition/genotype; p = 0.0159, two-way ANOVA). h, Mean relative expression of AP1 target genes by RT-qPCR at 15 dpi, with or without ERK knockdown in glia via RNAi beginning at 12 dpi (each point = 1 biological replicate, 9 dissected brains; n = 6 biological replicates per condition; Kruskal–Wallis test with Dunn’s multiple comparison test and Holm adjustment). i, Western immunoblot for ERK protein in whole flies with (blue) or without (green) ERK-RNAi expressed under an inducible ubiquitous promoter (daughterless-geneSwitch). Right, quantification (each point = 1 biological replicate, 8 whole flies; Student’s t-test). b-h, Black symbols, sham. Red symbols, severe dTBI. Statistical annotations are ****p<0.0001, ***p<0.001, **p<0.01, *p<0.05. See Supplementary Table 1 for genotypes.
Extended Data Fig. 5 |
Extended Data Fig. 5 |. Glial AP1 is required for TBI recovery.
a, Representative z-stacked whole mount brains focused on the central brain at 1 dpi in flies expressing a GFP-tagged variant of the AP1 target gene, Ets21c. Ets21c-GFP is detected in a handful of neurons at baseline but is dramatically upregulated in glia by 1 dpi (representative of n = 11–15 brains per condition, two independent experiments). b, Post-injury survival with (RU; dashed line) or without (vehicle; solid line) Ets21c-RNAi expressed in glia (n = 100 per condition, 5 vials of 20 flies; p < 0.0001, Kaplan-Meier analysis with log-rank comparison). c, Representative brain vacuolization at 1 dpi under sham and dTBI conditions, with (RU) or without (vehicle) JNK RNAi expression in glia. Quantification on right, expressed as % of total brain area that is vacuolized (each point = 1 brain; n = 9–10 brains per condition; two-way ANOVA revealed a non-significant interaction but a significant effect of dTBI, p = 6.1e-05). d, Representative brain vacuolization at 1 dpi under sham and dTBI conditions, with (RU) or without (vehicle) puckered expression in neurons. Quantification on right, expressed as % of total brain area that is vacuolized (each point = 1 brain; n = 18–19 brains per condition pooled from two independent experiments; two-way ANOVA revealed a non-significant interaction but a significant effect of dTBI, p = 3.55e-06).e, Post-injury survival with (RU; dashed line) or without (vehicle; solid line) puckered expression in neurons (n = 100 per condition, 5 vials of 20 flies; p < 0.0001, Kaplan-Meier analysis with log-rank comparison). Black symbols, sham. Red symbols, severe dTBI. Statistical annotations are ****p<0.0001, ***p<0.001, **p<0.01, *p<0.05. All scale bars 100μm. See Supplementary Table 1 for genotypes.
Extended Data Fig. 6 |
Extended Data Fig. 6 |. Sustained glial AP1 activity drives human tau pathology.
a, Representative section of paraffin-embedded head at 10 dpi stained for AT8 when human tau is expressed in neurons (representative of n = 7 animals). b, Membrane immunostained for human tau in phosphatase treated (+) and untreated (−) protein samples isolated from the heads of 5 dpi (repoGS>0N4R) or WT (w1118) flies (n = 30 per sample). c, Spearman correlation between percentage of total brain area vacuolized and number of AT8+ puncta (top) or AT100+ puncta (bottom) at 5 and 10 dpi (combined) in sham, mild or severe dTBI. Data shown is an alternative representation of Fig. 6a. d, Representative sections of paraffin embedded heads immunostained for AT100 (top row) or AT8 (bottom row), highlighting the concentration of phosphorylated tau puncta in neuropil and around vacuoles. Vacuoles are visualized by autofluorescence. e, Representative z-stacked hemisections of paraffin-embedded in WT (left; w1118) or AP1 blocked (right) mild dTBI at 10 dpi, immunostained for AT100. AP1 was blocked by expressing a dominant negative variant of dFos (dFos-DN). f, Quantification of AT00+ puncta (top) and % brain vacuolization (bottom) at 10 dpi with (UAS-dFos-DN) or without AP1 blockade (WT) in glia from 3 dpi (each point = 1 brain, n = 9–10 per condition/genotype pooled from two independent experiments; AT100: p=0.051, brain vacuolization: p=0.072, two-way ANOVA with Tukey’s test). g, Post-injury survival with (solid) or without (dashed) dFos-DN expression in glia in the setting of tau expression (n = 100 per condition, 5 vials of 20 flies; p < 0.0001, Kaplan-Meier analysis with log-rank comparison). Black symbols, sham. Pink symbols, mild dTBI. Red symbols, severe dTBI. Statistical annotations are ****p<0.0001, ***p<0.001, **p<0.01, *p<0.05. All scale bars 100μm. See Supplementary Table 1 for genotypes.
Extended Data Fig. 7 |
Extended Data Fig. 7 |. Evidence of AP1 activity decades after moderate human TBI.
a, TBI exposure history for donors; the same data is visualized two ways. Top shows age at first TBI, with most injuries occurring before age 30. Donors are further separated by duration of loss-of-consciousness. Total lifetime TBI events for each donor are shown by point size. Bottom shows the duration of time between first TBI and death. b, PCA of all samples (left) compared PCA of samples with outliers removed (right). Each point represents 1 tissue sample. Shape encodes brain region. Black symbols, non-TBI samples. Red symbols, TBI samples. c, Top 5 Molecular Signature Data Base (MSigDb) Hallmark gene sets and top 10 gene ontology (GO) terms enriched among upregulated genes (FDR<0.10) in TBI donors. d, Violin plots showing expression of all predicted FRA1/JUND genes in non-TBI (black; n samples = 81) and TBI (red; n samples = 80) exposed donors (FDR < 0.10).
Extended Data Fig. 8 |
Aligned bigWig files (IGV; aligned to Fly Base d. mel r6.17) for severe dTBI (top row) and sham injury at 24 hpi (bottom row), along with controls (0h; middle row), at the dFos locus (Fly gene name kay or kayak). With dTBI, reads map to dFos-RB, which encodes isoform B.
Fig. 1 |
Fig. 1 |. A lasting AP1 transcriptional response to TBI.
a, Design of time course RNA-seq experiment. Sham and severe dTBI heads were collected at 1 pre-injury (0 hours per injury; hpi) and 9 post-injury timepoints, in 3 biological replicates (n = 20 heads per replicate) for each injury condition and time (n = 57 samples total). b, Plot showing the number of significantly differentially expressed genes (upregulated in red, downregulated in black) at each post-injury time. Bar graph annotation (top) summarizes the total number of genes up and down. Density plot annotation (right) summarizes the distribution by log2 fold change (each point = 1 gene; FDR < 0.05). c, Principal component analysis of ≤1 dpi (days post-injury; top) and ≥1 dpi samples (bottom). Each point represents 1 biological replicate. Shape encodes condition. Color encodes post-injury time. d, Tile plot showing results of HOMER de novo motif enrichment analysis among upregulated genes (FDR<0.05). Presence of a colored tile indicates motif enrichment at a given post-injury time. Tile color encodes significance. e, Regulation of the conserved transcriptional complex AP1. Drosophila-specific gene names in parenthesis. f, Summary of the proportion of all differentially expressed genes with a predicted AP1 motif. Color key as in c. g, Volcano plots highlighting genes with predicted AP1 motifs (purple points), with the top 5 genes by L2FC and/or p-adjusted labelled. h, Average sham (black) and severe dTBI (red) expression of highly affected AP1 target genes at ≤1 dpi (top) and ≥1 dpi (bottom; blue star indicates FDR < 0.05 at a given time). See Supplementary Table 1 for genotypes in all figures.
Fig. 2 |
Fig. 2 |. AP1 activation is sustained and is severity-dependent.
a, AP1 activation was assessed in TREdsRed transgenic flies, with dsRed driven by 4X AP1 motifs. Right, 15 dpi survival of TREdsRed flies injured with sham (black), mild (35% head compression), or severe (45% head compression) dTBI (n = 100 per condition; sham vs mild dTBI: p = 0.00011, sham vs severe dTBI: p < 2e-16, mild vs severe dTBI: p = 1.6e-7, Kaplan-Meier analysis with log-rank comparison). b, Representative z-stacked whole mount brains at 1 dpi across injury conditions. Scale bar, 100μm. c, Quantification of dsRed immunofluorescence in whole mount brains throughout the post-injury period (each point = 1 brain; n = 14–19 brains per condition/time pooled examined over two independent experiments; p = 3.33e-09, two-way ANOVA with Tukey’s test). d, Mean relative expression of dsRed mRNA by RT-qPCR at 1, 7, and 15 dpi between injury conditions (each point = 1 biological replicate of 9 brains; n = 6 biological replicates per condition; Kruskal–Wallis test with Dunn’s multiple comparison test and Holm adjustment). See Extended Data Fig. 2b for additional AP1 target genes. Statistical annotations are ****p<0.0001, ***p<0.001, **p<0.01, *p<0.05, -p<0.10. All statistical tests were two-sided where applicable. For full statistical reporting, including exact p-values, see Source Data Fig. 2. Scale bar 100μm. Color code for injury in a and b.
Fig. 3 |
Fig. 3 |. AP1 activates and persists in glia.
a, Representative z-stacked whole-mount brain showing dsRed pattern in an injured brain (severe dTBI, 1 dpi). Also shown are the pattern of glial and neural membranes in uninjured brains, highlighted using a membrane-targeted GFP variant (mcd8-GFP) expressed under an inducible glial (repoGS aka repoGeneSwitch) or neural-specific (elavGS aka elavGeneSwitch) promoter. Simplified anatomy of the fly brain on the right, as seen in whole mount brain images. b, Representative high-magnification images of the central brain at 1 dpi. Thick, hypertrophic dsRed+ membrane processes are detected throughout the brain. Many dsRed+ cells co-localize with a nuclear glia-specific antibody (repo). c, Ridgeline plot demonstrating the proportion of dsRed+ cells that are glia (repo+), neurons (elav+) or neither (repo−/elav−) in mild (pink) and severe (red) dTBI brains (each point = 1 brain). X-axis indicates the percentage of all dsRed+ cells. Y-axis indicates sample density along the x-axis. d, Representative high-magnification images of the central brain at 15 dpi. dsRed+ processes are thinner and appear fragmented (white arrowheads). dsRed+ repo+ nuclei appear shrunken (blue *). dsRed+ puncta are abundant throughout the neuropil (white arrows). On the left is the whole z-stacked brain, demonstrating the overall pattern of dsRed in late dTBI. e, Ridgeline plot as in c for 15 dpi dTBI brains. All scale bars 100μm.
Fig. 4 |
Fig. 4 |. Glial AP1 is activated by ERK and promotes early TBI recovery.
a, Representative protein changes (top) and quantification of pJNK/JNK by western immunoblot (each point = 1 biological replicate (8 brains); n = 3 biological replicates/condition; Student’s t-test for each timepoint). See Extended Data Fig. 3d for immunoblots. b, Endogenous dsRed protein in whole mount brains at 1 dpi, with (top) or without (bottom) glial JNK-RNAi. See Extended Data Fig. 3e for quantification. c, Representative immunoblot (top) and quantification of pERK/ERK (each point = 1 biological replicate (8 brains); n = 3 biological replicates/condition; Student’s t-test for each timepoint). See Extended Data Fig. 4b for immunoblots. d, dsRed protein in whole mount brains at 1 dpi, with (top) or without (bottom) glial ERK-RNAi (representative of n = 7–9 brains per condition). e, Whole mount of dFos-GFP flies. Representative of n = 9–16 brains per condition. f, Whole mount of dJun-GFP flies. Representative of n = 8–13 brains per condition. g, Representative brains at 1 dpi, with (top) or without (bottom) glial puckered upregulation. See Extended Data Fig. 4c for quantification. h, Mean relative expression of AP1 target genes by RT-qPCR at 1 dpi, with or without glial AP1 blocked (WT is w1118; each point = 1 biological replicate, 9 brains; n = 6 biological replicates per condition; Kruskal–Wallis test with Dunn’s test). i, Mean relative expression of AP1 target genes by RT-qPCR at 15 dpi, with or without glial AP1 blocked from 12 dpi (WT is w1118; each point = 1 biological replicate, 9 brains; n = 6 biological replicates/condition; Kruskal–Wallis test with Dunn’s test). j, Post-injury survival with (RU; solid line) or without (vehicle; dashed line) glial AP1 blocked before dTBI (n = 100 per condition, 5 vials of 20 flies; Kaplan-Meier analysis with log-rank comparison). k, Post-injury survival with (RU; solid line) or without (vehicle; dashed line) glial AP1 blocked from 12 dpi (n = 100 per condition, 5 vials of 20 flies; Kaplan-Meier analysis with log-rank comparison). l, Total brain area vacuolized when glial AP1 is blocked before dTBI (left; measured at 1 dpi; interaction p = 4.67e-10, two-way ANOVA with Tukey’s test) or from 12 dpi (right; measured at 20 dpi; interaction p = 0.45, two-way ANOVA with Tukey’s test). Each point = 1 brain; n = 15–18 brains per condition from two independent experiments. m, Representative paraffin sections for brain vacuolization corresponding to 4l. n, Locomotor activity with glial AP1 blocked before (left; 1 dpi; interaction p = 0.028, two-way ANOVA with Tukey’s test) or after dTBI (right; 20 dpi; interaction p = 0.49). Vial height 8 cm; each point = 1 animal; n = 30 animals/condition, from 3 independent experiments. a,c,h-l, and n: black sham, red severe dTBI. Statistical annotations ****p<0.0001, ***p<0.001, **p<0.01, *p<0.05. All statistical tests were two-sided where applicable. Full statistical reporting in Source Data Fig. 4. All scale bars 100μm.
Fig. 5 |
Fig. 5 |. Age and injury evoke a glial AP1 response.
a, Enrichment of genes upregulated in late dTBI (severe) and with age (0 vs 40 d male) in the fly brain (one-sided Fisher’s exact test). 40% of overlapping genes (13/32) are predicted AP1 targets. b, Mean relative expression of select AP1 target genes mRNA by RT-qPCR in 5 vs 40 d old brains (each point = 1 biological replicate, 9 brains; n = 6 biological replicates per condition; Wilcoxon test and Holm adjustment for each gene). c, Representative paraffin sections showing brain vacuolization in young (5 d), aged (40 d) and injured (7 dpi, mild dTBI) TREdsRed flies. d, Quantification for (c) showing the average number of vacuoles per brain section in young (black), aged (grey) and injured (pink) TREdsRed flies (p = 1.95e-8, Kruskal-Wallis test with Wilcoxon test and Holm adjustment). Each point = 1 animal measured across 5 non-consecutive 2 μm sections. e, Locomotor activity of young, aged, and injured TREdsRed flies (p = 2e-16; one-way ANOVA with Tukey’s test; n = 30 animals per condition, examined over 3 independent experiments). f, Representative protein changes (top) and quantification of dsRed by western immunoblot in TREdsRed flies (each point = 1 biological replicate, 8 brains; p = 2.59e-4; one-way ANOVA with Tukey’s test). d-f, Black symbols, 5 d uninjured; grey symbols, 40 d uninjured; pink symbols, 7 dpi mild dTBI. g, Left, representative z-stacked wholemount uninjured 40 d brain. Right, ridgeline plot, as shown in Figs 3c and 3e, for 40 d brains (each point = 1 brain). h, Representative z-stacked whole mount brains in age (left) and dTBI (right). Not shown is dsRed signal in 5 d uninjured brains, which is identical to shams at 1 dpi (see Fig. 2b). White arrowheads highlight dsRed+ puncta. Statistical annotations are ****p<0.0001, ***p<0.001, **p<0.01, *p<0.05. All statistical tests were two-sided where applicable. For full statistical reporting, including exact p-values, see Source Data Fig. 5. All scale bars 100μm.
Fig. 6 |
Fig. 6 |. Chronic AP1 activity promotes human tau pathology.
a, Left, representative hemisection of paraffin-embedded heads at 10 dpi, immunostained for tau phosphorylation sites AT100 and AT8. Box illustrates area of 1002 μm2. Right, quantification of the number of AT100+ and AT8+ puncta, represented as puncta per 100 μm2 at 1, 5 and 10 dpi (each point = 1 brain, n = 6 per condition/time pooled from two independent experiments; AT8: p = 6.40e-05, AT100: p=0.000336, two-way ANOVA with Tukey’s test). Black = sham, pink = mild dTBI and red = severe dTBI. b, Post-injury survival with (RU; solid) or without (vehicle; dashed) human tau expression in glia (n = 100 per condition, 5 vials of 20 flies; p < 0.0001, Kaplan-Meier analysis with log-rank comparison). c, Left, representative z-stacked hemisections of paraffin-embedded in WT (left; w1118) or AP1 blocked (right) mild dTBI at 10 dpi, immunostained for AT100. Right, quantification of AT100+ as in 6a (top) and % brain vacuolization (bottom) at 10 dpi without puckered (WT; w1118) or with puckered expression in glia from 3 dpi (each point = 1 brain, n = 12–16 per condition/genotype pooled from two independent experiments; AT100: p=0.0093, brain vacuolization: p=0.068, two-way ANOVA with Tukey’s test). Black = sham, pink = mild dTBI and red = severe dTBI. d, Post-injury survival with (solid) or without (dashed) added puckered expression in glia in the setting of tau expression (n = 100 per condition, 5 vials of 20 flies; p < 0.0001, Kaplan-Meier analysis with log-rank comparison). Statistical annotations are ****p<0.0001, ***p<0.001, **p<0.01, *p<0.05. All statistical tests were two-sided where applicable. For full statistical reporting with exact p-values, see Source Data Fig. 6. All scale bars 100μm. Color code for injury in a and c.
Fig. 7 |
Fig. 7 |. Glial AP1 promotes early TBI recovery but chronically drives tauopathy.
Left, simplified fly brain schematic showing an intracortical synapse surrounded by a resting state glial cell. Middle, in the early post-injury period (<3 dpi), ERK activates glial AP1, which orchestrates a gene program vital to injury recovery. Right, sustained AP1 activity fosters a prodegenerative glial state that promotes human tau pathology. Solid lines are known interactions; dashed lines are proposed interactions.
Fig. 8 |
Fig. 8 |. AP1 activity decades after moderate TBI in humans.
a, The 12 enriched motifs detected by HOMER among upregulated genes in TBI donors (FDR<0.05), colored by enrichment relative to non-TBI donors. b, Violin plots showing expression of select predicted FRA1/JUND genes in non-TBI (black; n = 81 samples) and TBI (red; n = 80 samples) donors (FDR<0.10). See Extended Data Fig. 8d for all target genes. c, Pearson correlation between JUNB expression and % area GFAP+ versus Iba1+ by IHC in non-TBI (black; n = 81 samples) and TBI (red; n = 80 samples) donors (each point = 1 sample; 95% confidence interval shown; without adjustment for multiple comparison). d, Pearson correlation between JUNB expression and % area AT8+ by IHC in non-TBI (black; n = 81 samples) and TBI (red; n = 80 samples) donors (each point = 1 sample; 95% confidence interval shown).

References

    1. Corkin S, Rosen TJ, Sullivan EV & Clegg RA Penetrating head injury in young adulthood exacerbates cognitive decline in later years. J Neurosci 9, 3876–3883 (1989). - PMC - PubMed
    1. Gardner RC et al. Dementia risk after traumatic brain injury vs nonbrain trauma: the role of age and severity. JAMA Neurol 71, 1490–1497, doi: 10.1001/jamaneurol.2014.2668 (2014). - DOI - PMC - PubMed
    1. Smith DH, Johnson VE & Stewart W Chronic neuropathologies of single and repetitive TBI: substrates of dementia? Nat Rev Neurol 9, 211–221, doi: 10.1038/nrneurol.2013.29 (2013). - DOI - PMC - PubMed
    1. McKee AC et al. Chronic traumatic encephalopathy in athletes: progressive tauopathy after repetitive head injury. J Neuropathol Exp Neurol 68, 709–735, doi: 10.1097/NEN.0b013e3181a9d503 (2009). - DOI - PMC - PubMed
    1. Mackay DF et al. Neurodegenerative Disease Mortality among Former Professional Soccer Players. New Engl J Med 381, 1801–1808, doi: 10.1056/NEJMoa1908483 (2019). - DOI - PMC - PubMed

Publication types

Substances

LinkOut - more resources