. 2021 Dec 10;2(12):100389.
doi: 10.1016/j.patter.2021.100389. Epub 2021 Oct 25.

Contrastive learning improves critical event prediction in COVID-19 patients

Affiliations

Contrastive learning improves critical event prediction in COVID-19 patients

Tingyi Wanyan et al. Patterns (N Y). .

Abstract

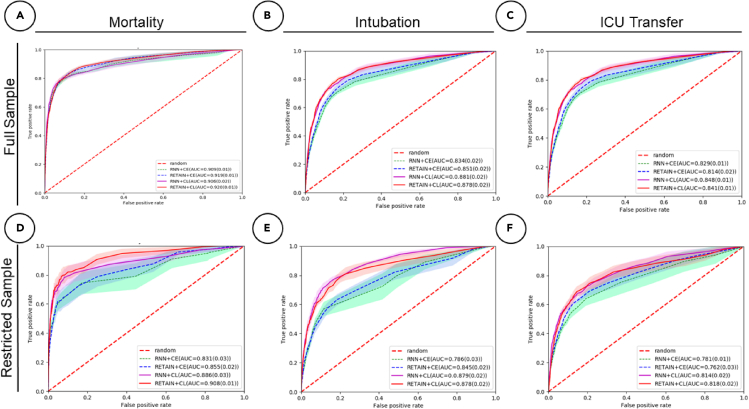
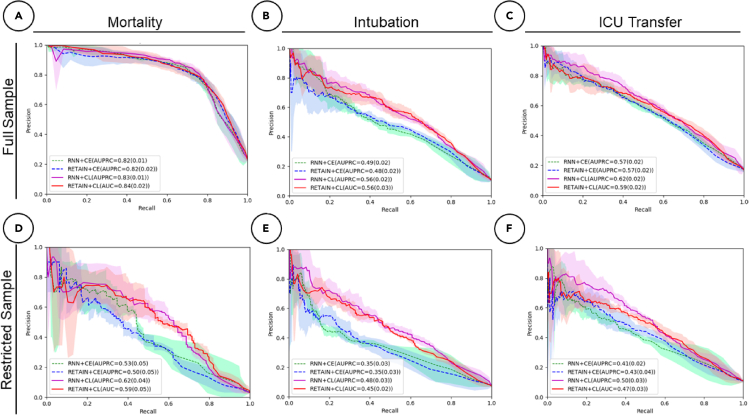
Deep learning (DL) models typically require large-scale, balanced training data to be robust, generalizable, and effective in the context of healthcare. This has been a major issue for developing DL models for the coronavirus disease 2019 (COVID-19) pandemic, where data are highly class imbalanced. Conventional approaches in DL use cross-entropy loss (CEL), which often suffers from poor margin classification. We show that contrastive loss (CL) improves the performance of CEL, especially in imbalanced electronic health records (EHR) data for COVID-19 analyses. We use a diverse EHR dataset to predict three outcomes: mortality, intubation, and intensive care unit (ICU) transfer in hospitalized COVID-19 patients over multiple time windows. To compare the performance of CEL and CL, models are tested on the full dataset and a restricted dataset. CL models consistently outperform CEL models, with differences ranging from 0.04 to 0.15 for area under the precision and recall curve (AUPRC) and 0.05 to 0.1 for area under the receiver-operating characteristic curve (AUROC).

Keywords: COVID-19; contrastive loss; deep learning; electronic health records; machine learning; recurrent neural network.


Conflict of interest statement

The authors declare no competing interests.

Figures

Figure 2
Figure 2
Receiver operating characteristic curves for all predictive tasks in a 24-h time frame Performance is assessed for both contrastive loss (CL) and cross-entropy loss (CEL) for both RNN and RETAIN modeling strategies. (A) Mortality with full dataset (23% positive labels). (B) Intubation with full dataset (11% positive labels). (C) ICU transfer with full dataset (17% positive labels). (D) Mortality with restricted dataset (7% positive labels). (E) Intubation with restricted dataset (5% positive labels). (F) ICU transfer with restricted dataset (7% positive labels).
Figure 3
Figure 3
PR curves for all event predictions in a 24-h time frame Performance is assessed for both CL and CEL for both RNN and RETAIN modeling strategies. (A) Mortality with full dataset (23% positive labels). (B) Intubation with full dataset (11% positive labels). (C) ICU transfer with full dataset (17% positive labels). (D) Mortality with restricted dataset (7% positive labels). (E) Intubation with restricted dataset (5% positive labels). (F) ICU transfer with restricted dataset (7% positive labels).
Figure 4
Figure 4
t-SNE latent embedding comparisons for all event predictions within a 24-h time frame using RETAIN Blue dots represent positive labels and red dots represent negative labels. The plot is organized by outcome per row, namely first, mortality; second, intubation; and third, ICU transfer. The first and third columns represent CL plots and the second and fourth represent CEL. (A) Mortality prediction with CL for the full dataset (23% positive labels). (B) Mortality prediction with CL for the full dataset. (C) Mortality prediction with CL for the restricted dataset (7% positive labels). (D) Mortality prediction with CEL for the restricted dataset. (E) Intubation prediction with CL for the full dataset (10% positive labels). (F) Intubation prediction with CEL for the full dataset. (G) Intubation prediction with CL for the restricted dataset (5% positive labels). (H) Intubation prediction with CEL for the restricted dataset. (I) ICU transfer prediction with CL for the full dataset (17% positive labels). (J) ICU transfer prediction with CEL for the full dataset. (K) ICU transfer prediction with CL for the restricted dataset (7% positive labels). (L) ICU transfer prediction with CEL for the restricted dataset.
Figure 5
Figure 5
Feature importance is predicted over four 6-h windows (A) full sample withcontrastive loss (CL); (B) full sample with cross-entropy loss (CEL); (C) restrcited sample with CL; and (D) restrcited sample with CEL. The heat maps display similar importance scores in terms of key features and their magnitudes.
Figure 1
Figure 1
Data and modeling schemas (A) Architecture with CL. EHR data are modeled to create patient and event embedding representations, which are fed into our CL equation. (B) Representation space. CL simultaneously pushes positive patients and event embeddings (i.e., concordant with respect to the outcome of the patient of interest, respectively) away from negative ones. (C) Time binning. Schematic to visualize how we model time sequence. We have two outcome windows (i.e., 24and 48 h prior to event) and bin data by 6-h chunks. (D) Selection of event timing for null outcomes. For patients that do not experience the outcome of interest, we generate a data-driven event time to align against as in (C). We compute the mean and standard deviation for the length of time that elapsed from admission for all patients with the affiliated outcomes independently. For patients without an event, we randomly pick a time to use as a reference end point using a Gaussian distribution with the mean and standard deviation obtained from the positive training data.

Update of

References

    1. Dong E., Du H., Gardner L. An interactive web-based dashboard to track COVID-19 in real time. Lancet Infect Dis. 2020;20:533–534. - PMC - PubMed
    1. Thompson C.N., Baumgartner J., Pichardo C., Toro B., Li L., Arciuolo R., Chan P.Y., Chen J., Culp G., Davidson A., et al. COVID-19 outbreak – New York City, February 29–June 1, 2020. MMWR Morb Mortal Wkly Rep. 2020;69:1725–1729. - PMC - PubMed
    1. McMahon D.E., Peters G.A., Ivers L.C., Freeman E.E. Global resource shortages during COVID-19: bad news for low-income countries. PLoS Negl. Trop. Dis. 2020;14:e0008412. - PMC - PubMed
    1. Glicksberg B.S., Johnson K.W., Dudley J.T. The next generation of precision medicine: observational studies, electronic health records, biobanks and continuous monitoring. Hum. Mol. Genet. 2018;27:R56–R62. - PubMed
    1. Clifford C.T., Pour T.R., Freeman R., Reich D.L., Glicksberg B.S., Levin M.A., Klang E. Association between COVID-19 diagnosis and presenting chief complaint from New York City triage data. Am. J. Emerg. Med. 2020;46:520–524. - PMC - PubMed

LinkOut - more resources