. 2021 Oct 25;1(6):None.
doi: 10.1016/j.crmeth.2021.100083.

Timing RNA polymerase pausing with TV-PRO-seq

Affiliations

Timing RNA polymerase pausing with TV-PRO-seq

Jie Zhang et al. Cell Rep Methods. .

Abstract

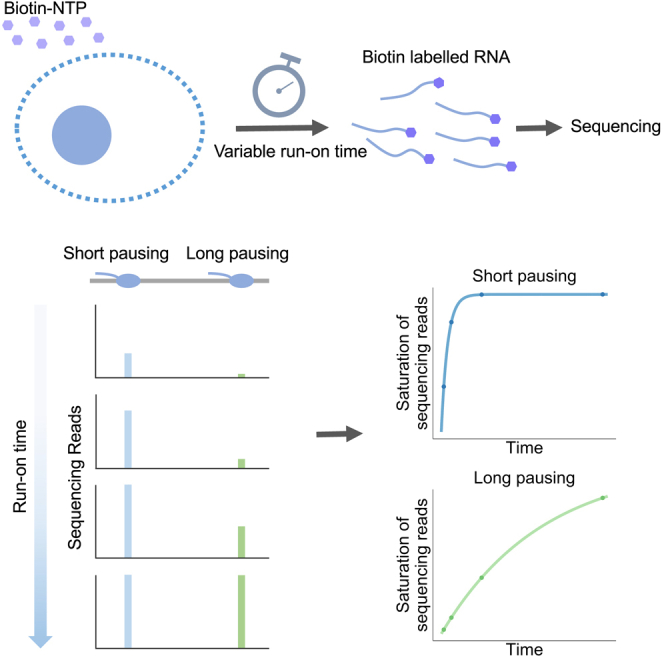
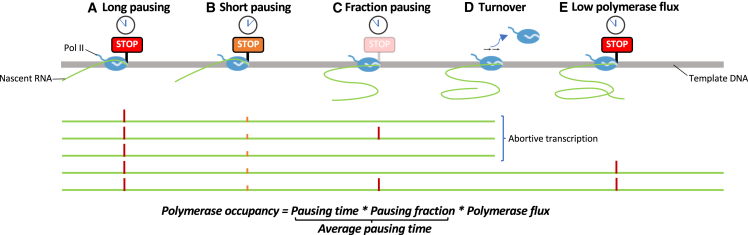
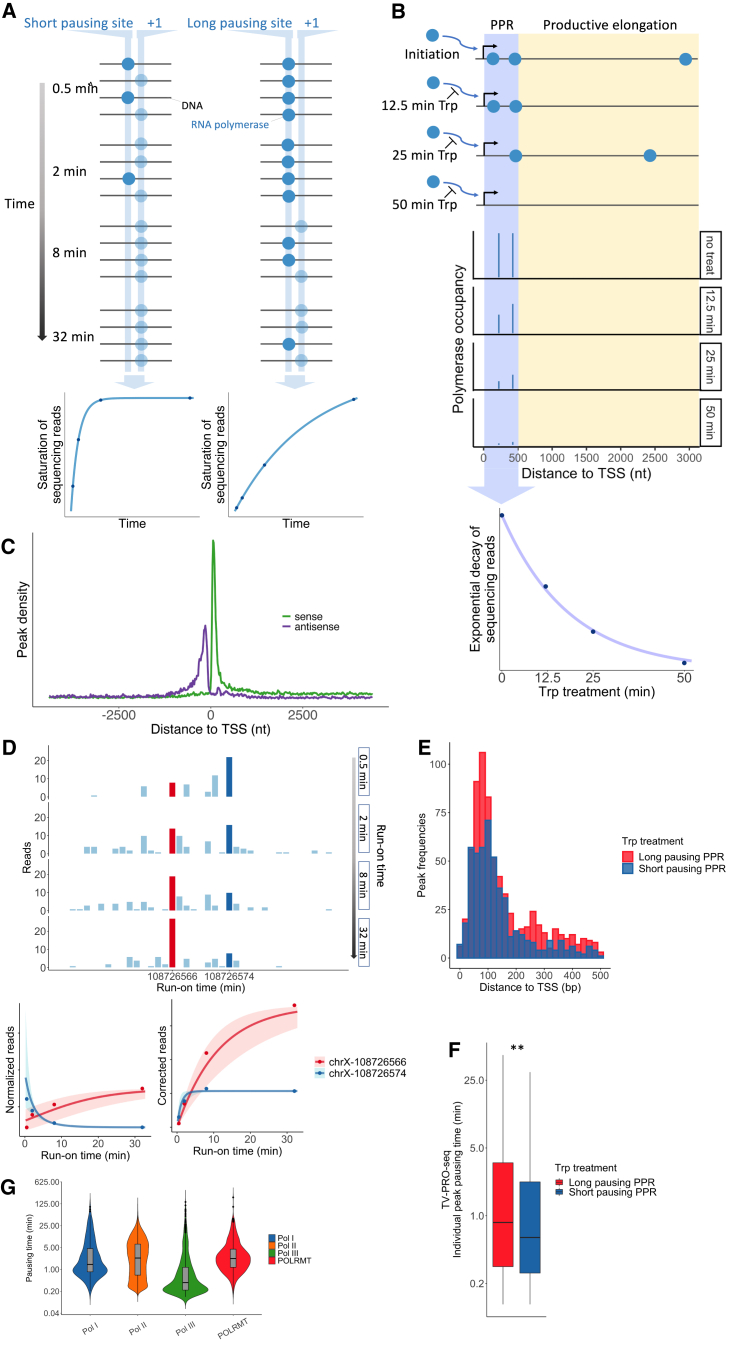
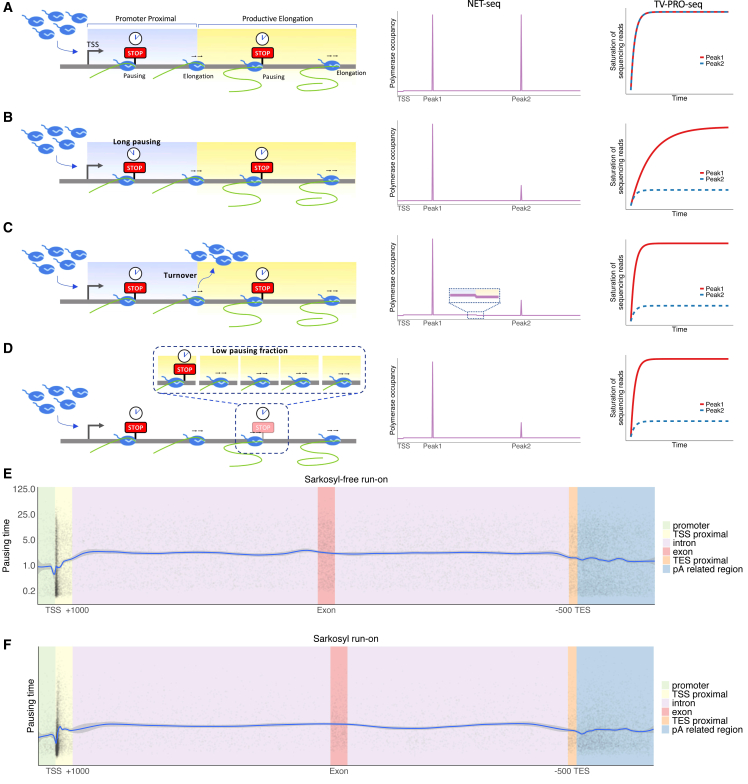
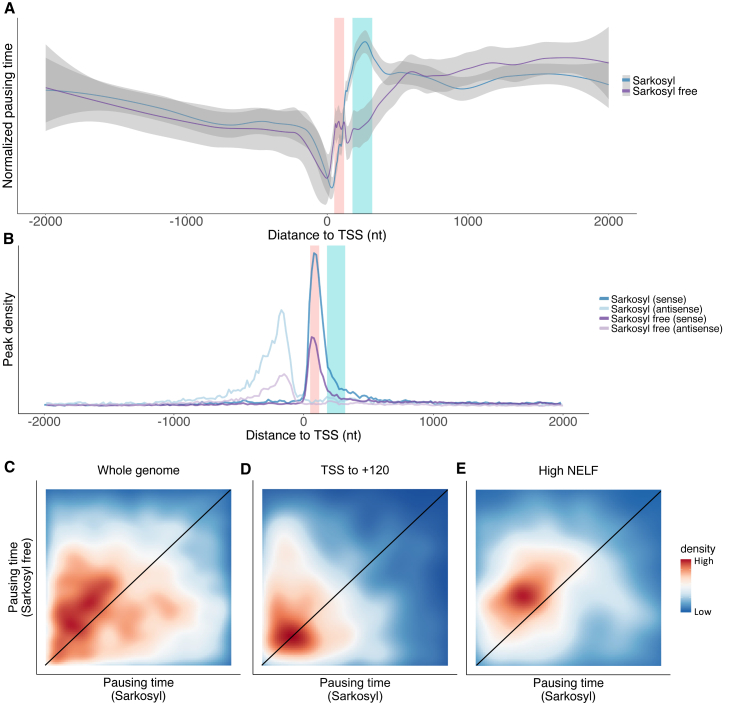
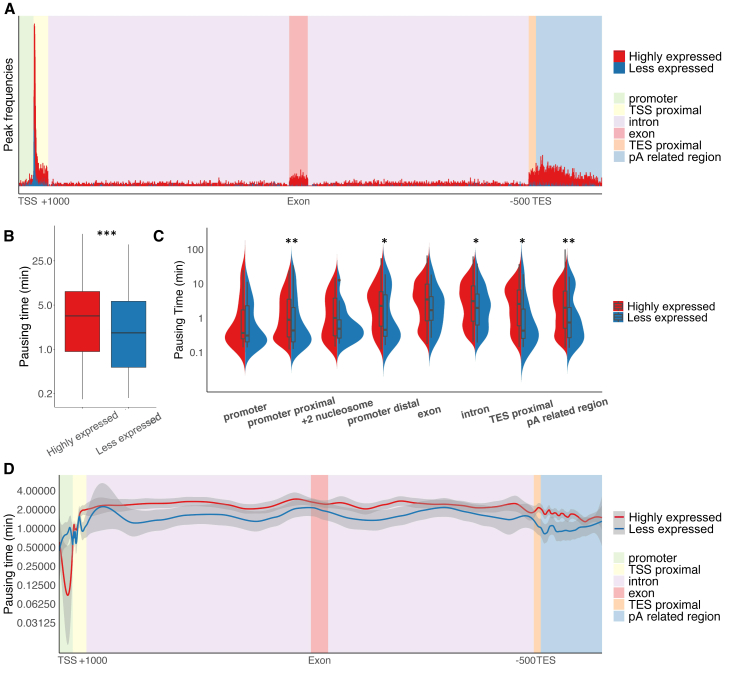
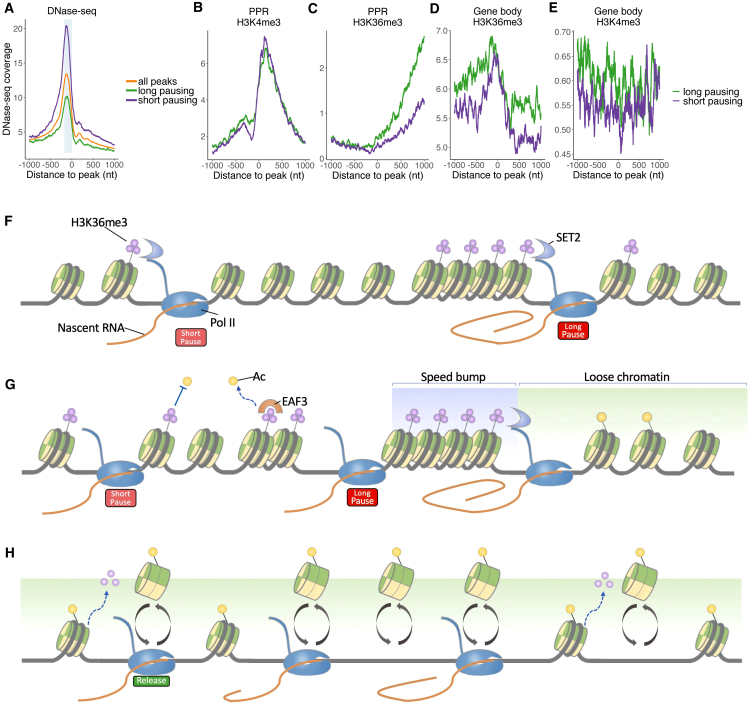
Transcription of many genes in metazoans is subject to polymerase pausing, which is the transient stop of transcriptionally engaged polymerases. This is known to mainly occur in promoter-proximal regions but it is not well understood. In particular, a genome-wide measurement of pausing times at high resolution has been lacking. We present here the time-variant precision nuclear run-on and sequencing (TV-PRO-seq) assay, an extension of the standard PRO-seq that allows us to estimate genome-wide pausing times at single-base resolution. Its application to human cells demonstrates that, proximal to promoters, polymerases pause more frequently but for shorter times than in other genomic regions. Comparison with single-cell gene expression data reveals that the polymerase pausing times are longer in highly expressed genes, while transcriptionally noisier genes have higher pausing frequencies and slightly longer pausing times. Analyses of histone modifications suggest that the marker H3K36me3 is related to the polymerase pausing.

Keywords: H3K36me3; NELF; PRO-seq; RNA polymerase; gene expression; next-generation sequencing; polymerase pausing; promoter-proximal pausing; transcription dynamics; transcriptional noise.


Conflict of interest statement

The authors declare no competing interests.

Figures

None
Graphical abstract
Figure 1
Figure 1
Schematic illustration of pausing-related phenomena (A) The green lines refer to transcribed RNA of the example gene on top. Red bars correspond to sites where long pausing occurred during transcription. (B) Polymerases pause shorter at this position (orange bars), resulting in a lower polymerase occupancy. (C) Only part of the polymerases pause at this position, thus, even though (C) has similar pausing times for each paused polymerase to (A), the average pausing time is lower due to the low pausing fraction, and finally results in a lower polymerase occupancy. (D) Polymerases can drop off the DNA template at this point and result in fewer polymerases reaching downstream positions (lower polymerase flux). (E) The polymerase flux downstream of the turnover site (D) will be lower and so will the polymerase occupancy. A generally low gene expression level will have the same effect and lower both.
Figure 2
Figure 2
Principle of TV-PRO-seq (A) The black horizontal lines symbolize a generic DNA region with a short (left graphics) and a long (right graphics) pausing site. The blue dots symbolize RNA polymerases that either are stationary or have just moved by one position (and incorporated a biotinylated NTP) as indicated by the lighter blue shades. A sequencing read results at a position if a polymerase steps forward by one base. Eventually, all polymerases will have moved, i.e., all positions will be saturated. The saturation takes longer at the position (+1) adjacent to the long pausing site, since the polymerases are released at a lower rate than from the short pausing site. Saturation curves (lower plots) can be inferred by reads from a run-on time course at each position, genome-wide. (B) Trp blocks transcription initiation, thus decreasing the polymerase occupancies at the PPRs. The decay rate at different pausing sites is also influenced by their distance to TSS. Two pausing sites with the same pausing times are represented in the diagram; the decay rate of polymerase occupancy of the most downstream peak is underestimated by the presence of persisting polymerases upstream. The total reads of the PPR from Trp-treatment-based sequencing can be used to estimate the average pausing time in the PPR by fitting an exponential decay curve. (C) Distributions of sense and antisense read around TSSs from pooled TV-PRO-seq samples confirm high library quality. (D) Read numbers from two neighboring peaks (red and blue bars) in chromosome X obtained at the different run-on times (top). Normalizing these by the total-genome reads permits parameter estimation and produces the curves at bottom left. Correcting by the total-genome read trend reveals the saturation curves at bottom right (details in STAR Methods). Shaded regions are interquartile posterior ranges. (E) More peaks are found in the long-pausing PPR. The 2,000 genes with the highest polymerase occupancy in the PPR (first 500 bp downstream of TSS) were used for analysis. Five-hundred genes each retaining the highest and lowest polymerase occupancies after 10 min of Trp treatment were grouped as long-pausing PPR and short-pausing PPR, respectively. Seven-hundred and two peaks were identified in the long pausing PPR and 493 peaks were found in the short-pausing PPR (exact binomial test, p < 10−8). (F) Peaks in the long-pausing PPR have longer pausing times as measured by TV-PRO-seq (Mann-Whitney U test, p < 0.01). Peaks were grouped same as in (E). (G) Distributions of estimated pausing times for peaks in loci transcribed by Pol I, II, III, and POLRMT. For all pairwise comparisons except Pol II versus POLRMT and Pol II versus Pol I (non-significant), p < 0.01, Bonferroni-corrected Mann-Whitney U test.
Figure 3
Figure 3
Several factors influence polymerase occupancy (A) The left panel shows a schematic example case by in silico simulations; two regions were designated as promoter proximal (blue shading) and productive elongation (yellow shading), each with a single pausing site (peak 1 and peak 2) with identical properties. Polymerase occupancies measured by NET-seq (middle) and the saturation curves resulting from TV-PRO-seq (right) of the two peaks will be the same. (B) As (A), but the pausing time of peak 1 was set five times longer (clock symbols) than peak 2's. Both polymerase occupancy and pausing time (1/βi; see STAR Methods) of peak 1 would be measured to be five times higher than peak 2's. (C) As (A) and (B), but 80% of polymerase is assumed to abort transcription at the boundary of the PPRs, thus reducing by 80% polymerase occupancy in the productive elongation region. Therefore, the measured polymerase occupancy of peak 1 would still be 5-fold higher than at peak 2, for both NET-seq and TV-PRO-seq. However, in contrast to NET-seq, TV-PRO-seq is still able to correctly measure the pausing times at the two peaks to be equal despite their differing sizes. In contrast to (B) and (D), high abortive transcription would also decrease the polymerase occupancy in the productive elongation region (magnified section). (D) As (A), but only one-fifth of the polymerase is assumed to pause at peak 2 (i.e., the pausing fraction is a fifth), thus its polymerase occupancy would decrease to one-fifth of peak 1's. The pausing time of peak 2, however, would be about the same as peak 1's. (E) Pausing times at mRNA-transcribing metagene. Each gray dot represents a pausing peak, with corresponding pausing time given by its y axis value. The x axis values correspond to the absolute position within ± 1,000 nt of the TSS (green and yellow tinged regions, respectively). The intron/exon regions (purple/red, respectively) start after +1,000 nt of the TSS and end before −500 of the TES (introns were split into an upstream and a downstream group at the gene's middle point) and 500 nt upstream and 4,500 nt downstream of the TES (polyA-related sites) were indicated (orange and blue, respectively). The blue line corresponds to the moving average (locally estimated scatterplot smoothing [LOESS] fit). The gray shading indicates the 0.95 confidence interval and is negligible on this scale, hence invisible over most of the graph. The widths of exons and introns have been scaled to their relative average lengths. (F) Similar to (E), but including sarkosyl during the run-on reactions.
Figure 4
Figure 4
Influence of sarkosyl on pausing (A) Pausing time of peaks around TSS. For removing the systematic bias of pausing time estimation, the average pausing time is normalized to the same value for samples with sarkosyl (blue line) or with a sarkosyl-free (purple line) run-on. Pausing in the +50 to +120 region (pink shading) is sensitive to sarkosyl, while pausing in the +180 to +320 region (cyan shading) shows resistance to sarkosyl. (B) Sarkosyl increases the PPR peak density for both sense and divergent transcription. (C) 2D density plots show the pausing time rank of the equivalent peaks in sarkosyl sample and sarkosyl-free sample. The black line reflects peaks with intermediate influence on pausing time by sarkosyl. Peaks above the black line correspond to pausing sites releasing paused polymerase after sarkosyl treatment. (D) Similar to (C), only for the peaks within the first 120 bp of genes. (E) Similar to (C), but only peaks with top 10% of NELF level.
Figure 5
Figure 5
Pausing profiles and expression level (A) Absolute peak density at mRNA-transcribing metagene as in Figure 3E, for genes classified into different expression levels (highly expressed, less expressed; red, blue, respectively). (B) Pausing times of pausing sites in highly expressed genes are longer than less expressed ones. p < 10−23, Mann-Whitney U test. (C) Pausing times of different regions of highly expressed and less expressed genes. Definitions of the region are the same as in Figure 3E; TSS proximal has been split into promoter proximal (TSS to +120), +2 nucleosome (+180 to +320) and promoter distal (+500 to +1,000) according to the different effects of sarkosyl on these regions. For promoter-proximal and pA-related region, p < 0.01; promoter distal, intron, and TES proximal, p < 0.05; Mann-Whitney U test. (D) Pausing times of pausing peaks among genic regions for low- and high-expression genes at the metagene as in (A) shown as LOESS fits as in Figure 3E.
Figure 6
Figure 6
Pausing profiles and transcriptional noise (A) Absolute peak density at mRNA-transcribing metagene as in Figure 3E, for genes classified into different levels of transcriptional noise (high, low; red, blue, respectively). (B) Pausing times of pausing peaks among genic regions for low- and high-noise genes at the metagene as in (A) shown as LOESS fits as in Figure 3E. (C) Pausing times of pausing sites in high-noise genes are longer than those of low-noise genes. p < 0.01, Mann-Whitney U test. (D) Pausing times of different regions of high- and low-noise genes. Definitions of the regions are the same as in Figure 5C. For introns, p < 0.01, Mann-Whitney U test. (E) NELF coverage at TSSs of genes with high or low noise. (F) Absolute peak densities of both sense and antisense transcription of high- or low-noise genes.
Figure 7
Figure 7
Chromatin state and pausing times (A) Peaks were classified as long and short according to their pausing times. The average signal of DNase-seq data is displayed in the vicinity of the two classes of peaks (and all peaks). The region from −180 to the peak is shaded in light blue. (B) Peaks were classified as in (A); signal profiles of H3K4me3 ChIP-seq data of peaks within first 500 bp of gene are shown. (C) Similar to (B), for H3K36me3. (D) Similar to (B), for the peaks within the gene body (except the first 2,000 bp and last 1,500 bp of gene). (E) Similar to (D), for H3K4me3. (F) CTD of paused Pol II recruits SET2 to trimethylated H3K36. H3K36me3 level increases if the pausing lasts longer. (G) Model of the dynamic equilibrium between H3K36me3 and histone acetylation under homeostasis. Two H3K36me3-related pausing sites have been set. Packaged H3K36me3 can form into a “speed bump”, which establishes long pausing, while shorter pausing might correspond to isolated marks. The Pol II CTD can recruit SET2 to methylate H3K36. The H3K36me3 then can facilitate deacetylation of histones (by active EAF3) and/or inhibit histone acetylation. (H) Histone acetylation releases paused polymerase after removal of H3K36me3, resulting in a transcriptional burst.

References

    1. Adelman K., Lis J.T. Promoter-proximal pausing of RNA polymerase II: emerging roles in metazoans. Nat. Rev. Genet. 2012;13:720–731. - PMC - PubMed
    1. Al-Rfou R., Guillaume A., Almahairi A., Angermueller C., Bahdanau D., Ballas N., Bastien F., Bayer J., Belikov A., Belopolsky A., et al. arXiv; 2016. Theano: A Python Framework for Fast Computation of Mathematical Expressions. 1605.02688.
    1. Angers-Loustau A., Petrillo M., Bengtsson-Palme J., Berendonk T., Blais B., Chan K.G., Coque T.M., Hammer P., Hess S., Kagkli D.M., et al. The challenges of designing a benchmark strategy for bioinformatics pipelines in the identification of antimicrobial resistance determinants using next generation sequencing technologies. F1000Res. 2018;7 ISCB Comm J-459. - PMC - PubMed
    1. Bintu L., Ishibashi T., Dangkulwanich M., Wu Y.-Y., Lubkowska L., Kashlev M., Bustamante C. Nucleosomal elements that control the topography of the barrier to transcription. Cell. 2012;151:738–749. - PMC - PubMed
    1. Bolger A.M., Lohse M., Usadel B. Trimmomatic: a flexible trimmer for Illumina sequence data. Bioinformatics. 2014;30:2114–2120. - PMC - PubMed

Publication types

Substances