. 2022 Jan 1;205(1):60-74.
doi: 10.1164/rccm.202103-0569OC.

Lung Microenvironments and Disease Progression in Fibrotic Hypersensitivity Pneumonitis

Affiliations

Lung Microenvironments and Disease Progression in Fibrotic Hypersensitivity Pneumonitis

Laurens J De Sadeleer et al. Am J Respir Crit Care Med. .

Abstract

Rationale: Fibrotic hypersensitivity pneumonitis (fHP) is an interstitial lung disease caused by sensitization to an inhaled allergen. Objectives: To identify the molecular determinants associated with progression of fibrosis. Methods: Nine fHP explant lungs and six unused donor lungs (as controls) were systematically sampled (4 samples/lung). According to microcomputed tomography measures, fHP cores were clustered into mild, moderate, and severe fibrosis groups. Gene expression profiles were assessed using weighted gene co-expression network analysis, xCell, gene ontology, and structure enrichment analysis. Gene expression of the prevailing molecular traits was also compared with idiopathic pulmonary fibrosis (IPF). The explant lung findings were evaluated in separate clinical fHP cohorts using tissue, BAL samples, and computed tomography scans. Measurements and Main Results: We found six molecular traits that associated with differential lung involvement. In fHP, extracellular matrix and antigen presentation/sensitization transcriptomic signatures characterized lung zones with only mild structural and histological changes, whereas signatures involved in honeycombing and B cells dominated the transcriptome in the most severely affected lung zones. With increasing disease severity, endothelial function was progressively lost, and progressive disruption in normal cellular homeostatic processes emerged. All six were also found in IPF, with largely similar associations with disease microenvironments. The molecular traits correlated with in vivo disease behavior in a separate clinical fHP cohort. Conclusions: We identified six molecular traits that characterize the morphological progression of fHP and associate with in vivo clinical behavior. Comparing IPF with fHP, the transcriptome landscape was determined considerably by local disease extent rather than by diagnosis alone.

Keywords: extrinsic allergic alveolitis; pulmonary fibrosis; transcriptome.


Figures

Figure 1.
Figure 1.
Study design and morphological analysis. (A) Explant lung processing flow. Nine HP explant lungs and six control lungs were used for the study. From each lung, four cores were retrieved, resulting in a total of 60 cores included in the study. After explantation, lungs were processed into cores, scanned using microcomputed tomography, and analyzed using histology. Based on microcomputed tomography–determined disease extent, these cores were classified as mild (HP1), moderate (HP2), and severe (HP3). (B) Overview of explant lung analyses. RNA sequencing data were analyzed using weighted gene coexpression network analysis, xCell, gene ontology enrichment, and Hugo Gene Nomenclature Committee gene group enrichment. To validate transcriptome findings on protein and morphological levels, additional immunohistochemistry, immunocytochemistry of damaged telomeres, telomere length qPCR, and scanning electron microscopy were performed. (C) Analyses were performed on validation cohorts. To assess whether the identified molecular traits were involved in early disease and whether these molecular traits impact fibrotic hypersensitivity pneumonitis disease behavior, additional validation analyses were performed. CT = computed tomography; fHP  = fibrotic hypersensitivity pneumonitis; GSE = gene expression omnibus series; HGNC = Hugo Gene Nomenclature Committee; IHC = immunohistochemistry; LTRC = lung tissue research consortium; SEM = scanning electron microscopy; telo qPCR = telomere quantitative polymerase chain reaction; TIF = immunocytochemistry of damaged telomeres; WGCNA = weighted gene co-expression network analysis.
Figure 2.
Figure 2.
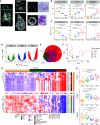
Transcriptome signature reveals three distinct expression patterns. (A) Variability in local disease severity. Far left: explant lung computed tomography (CT) in the sagittal plane. Left: axial plane explant CT slices of upper and lower explant lung lobe, showing variability in fibrosis. Right and far right: microCT slice and corresponding H&E slice of core, taken in the respective lung zones. (B) MicroCT-derived disease severity parameters in hypersensitivity pneumonitis (HP) and control cores. (C) Histological disease severity parameters in HP and control cores. (D) Volcano plots of HP1, HP2, and HP3 fold change data. Colored points represent genes with significantly different gene expression versus control based on false discovery rate–corrected P value and expression (see METHODS section). (E) Euler diagram showing numbers of differentially expressed genes. (F) Principal component analysis: dimensions 1 and 2 are plotted. (G) Heatmap of weighted gene coexpression network analysis module eigengenes, showing three distinct expression patterns. (H) Example of genes following one of these three distinct expression patterns: HYDIN, the hub gene of Mod2 showing a progressive increase pattern, the CTHRC1 hub gene of Mod1 showing a degressive increase pattern, and PCDHA6 showing a progressive decrease pattern. Significance levels: ***P < 0.0001, ** P < 0.01, and *P  < 0.05. CTRL = control; ECM = extracellular matrix; FC = fold change; H&E = hematoxylin and eosin; PC = principal component.
Figure 3.
Figure 3.
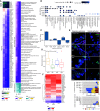
Extracellular matrix gene expression dominates the transcriptome of mildly affected lung zones. (A) Fold change of gene expression of module 1, its hub genes, as well as gene ontologies and Hugo Gene Nomenclature Committee (HGNC) gene groups involved in extracellular matrix gene expression, showing a degressively increased expression pattern. (B) Functional enrichment of module 1. Circles represent the proportion of module 1 genes that are included in the gene ontology. (C) Representative Masson trichrome–stained slices for all four subgroups, showing increased collagen deposition (blue, arrows). Scale bars, 1 mm (top panels), 250 μm (bottom panels). (D) CTHRC1 staining in an HP2 core showing staining in the fibrotic stroma adjacent to normal lung tissue (arrows). Scale bars, 250 μm (left panel), 50 μm (center and right panels). (E) Fold change of gene expression of module 1 genes in the independent GSE47460 gene expression dataset (n = 90: 30 HP cases and 60 age- and sex-matched controls). (F) Collagen Ia and N-cadherin concentrations in BAL fluid from fibrotic hypersensitivity pneumonitis (fHP) cases included in the Leuven fHP cohort (n = 61). Patients with severe pulmonary function impairment showed increased concentrations of Collagen Ia and N-cadherin compared with cases with mild impairment. (G) Collagen Ia and N-cadherin concentrations in BAL fluid are associated with FVC decline in the Leuven fHP cohort. (H) Scoring of the percentage of parenchyma taken in by reticulation (i.e., the macroscopic correlate of extracellular matrix deposition) on baseline computed tomography of fHP cases. The extent was associated with baseline pulmonary function in the Leuven fHP cohort. (I) Kaplan–Meier curve showing survival stratified by reticulation scoring in fHP cases from the Leuven cohort (n = 86). ECM = extracellular matrix; ER = endoplasmic reticulum; FC = fold change; TGFβ = transforming growth factor β; WGCNA = weighted gene co-expression network analysis.
Figure 4.
Figure 4.
Whereas antigen presentation and sensitization are highly abundant in mildly affected lung zones, B-cell involvement prevailed in severely affected lung zones. (A) Fold change of xCell enrichment scores of B cells, showing a progressively increased expression pattern, whereas fold change of xCell enrichment scores of T-cell subsets as well as gene ontologies and Hugo Gene Nomenclature Committee (HGNC) gene groups involved in antigen presentation and sensitization show a degressively increased expression pattern. (B) Abundance of CD4+, CD8+, and CD20+ cells in explant lung samples. (C) Fold change of xCell enrichment scores for B- and T-cell subsets in the GSE47460 dataset (n = 90). (D) Abundance of CD3+ and CD20+ cells in fibrotic hypersensitivity pneumonitis diagnostic biopsies (n = 10). Left: mildly fibrotic lung zone. Right: severely fibrotic lung zones. For each lung zone: top left: overview of H&E; top right: detailed H&E view; bottom left: CD3 staining; bottom right: CD20 staining. CD3 dominates in mild fibrosis (bottom left), whereas CD20 tertiary lymphoid aggregates are highly abundant in severe fibrotic zones compared with CD3 cells (bottom right). Scale bars, 600 μm (top left), 250 μm (top center left), 1 mm (top center right), 150 μm (top right); 100 μm (bottom left and bottom center left), and 150 μm (bottom center right and right). (E) IFNγ and B-cell activating factor concentrations in BAL fluid of patients with fHP at diagnosis (n = 61) associated with pulmonary function impairment. Significance levels: **P < 0.01 and *P < 0.05. aDC = activated dendritic cells; Ag = antigen; Bx = biopsy; cDC = conventional DC; CTRL = control; FC = fold change; fHP = fibrotic hypersensitivity pneumonitis; H&E = hematoxylin and eosin; iDC = immature DC; pDC = plasmacytoid DC; SymInt = symbiotic interaction; NK = natural killer T cells; Tcm = central memory T cells; Tem = effector memory T cells; Tgd = γ–delta T cells; Th = T-helper cells; Tregs = regulatory T cells.
Figure 5.
Figure 5.
Honeycomb formation dominates the transcriptome of severely affected lung zones. (A) Fold change of gene expression of module 2 (Mod2) and Mod3, their hub genes, as well as gene ontologies and Hugo Gene Nomenclature Committee (HGNC) gene groups involved in honeycombing, showing a progressively increased expression pattern. (B) Functional enrichment of Mod2 and Mod3. Circles represent the proportion of genes that are included in the gene ontology. (C) Immunofluorescent staining showing high abundance of ciliated cells in honeycomb regions: ciliated cells (red), club cells (orange), and basal cells (green). (D) Expression of MUC5B shows a progressive increase. (E) Fold change gene expression of Mod2 and Mod3 genes in the independent GSE47460 gene expression dataset (n = 90). (F) The presence of honeycombing on baseline computed tomography in the Leuven fibrotic hypersensitivity pneumonitis cohort associated with baseline pulmonary function (n = 86). (G) Kaplan–Meier curve showing survival data stratified by presence of honeycombing. Significance levels: ***P < 0.0001 and *P < 0.05. CTRL = control; FC = fold change; HP = hypersensitivity pneumonitis; WGCNA = weighted gene co-expression network analysis.
Figure 6.
Figure 6.
Endothelial dysfunction emerges with progressive fibrosis. (A) Fold change of gene expression of modules 4–6 (Mod4–6) and their hub genes, fold change of xCell enrichment score for endothelial cells, as well as fold change of gene expression of gene ontologies and Hugo Gene Nomenclature Committee (HGNC) gene groups involved in cell adhesion and endothelial function, showing a progressively decreased expression pattern. (B) Functional enrichment of Mod4–6. Circles represent the proportion of Mod4–6 genes that are included in the gene ontology. (C) Protocadherin immunohistochemistry staining shows intense staining in vascular endothelium (arrows) and smooth muscle cells but not in epithelium. Scale bars: top left, 1 mm; top right, 50 μm; bottom left, 250 μm; bottom right, 50 μm. (D) Scanning electron microscopy images. Top panel: overview of the sample. Center and bottom panels: microvasculature corrosion casting. Left: decreased angiogenesis in a more affected lung zone. Right: increased angiogenesis in less affected lung zones. The holes in the bottom panels are the microvascular corrosion casting correlate of intussusceptive transluminal pillars, an early sign of intussusceptive angiogenesis. Scale bars: top panel, 500 μm; middle panels, 100 μm; bottom panels, 50 μm. (E) Fold change of expression of genes included in Mod4–6 in the independent GSE47460 gene expression dataset (n = 90). (F) Fold change of xCell enrichment scores of endothelial cell subsets in the independent GSE47460 gene expression dataset (n = 90). FC = fold change; HP = hypersensitivity pneumonitis; WGCNA = weighted gene co-expression network analysis.
Figure 7.
Figure 7.
Intracellular homeostatic functions are compromised with progressive fibrosis. (A) Fold change of expression of genes included in modules 7–12 (Mod7–12) and their hub genes as well as gene ontologies and Hugo Gene Nomenclature Committee (HGNC) gene groups involved in intracellular homeostasis, showing a progressively decreased expression pattern. (B) Functional enrichment of Mod7–12. Circles represent the proportion of Mod7–12 genes that are included in the enriched gene ontology. (C) Fold change of expression of genes included in Mod7–12 in the independent GSE47460 gene expression dataset (n = 90). (D) Quantitative PCR-based relative telomere length in all four subgroups. (E) Fluorescent staining for TRF2, γ-H2AX, and DNA of cells in and outside of the respiratory epithelium. Arrowheads indicate co-localization events between telomeres and γ-H2AX signals. Forty-two to 58 nuclei from epithelial cells were counted in one tissue section of each donor. For nonepithelial cells, 48–61 nuclei were analyzed for each donor. Cells were classified as belonging to the epithelium based on their morphology. Telomere damage is increased in hypersensitivity pneumonitis cores. (F) Fold change of ageing-associated gene expression, showing a complex expression pattern with some genes degressively increased and others progressively increased. CTRL = control; FC = fold change; HP = hypersensitivity pneumonitis; TIF = immunocytochemistry of damaged telomeres; WGCNA = weighted gene co-expression network analysis. Scale bars = 10 μm.
Figure 8.
Figure 8.
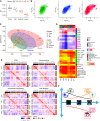
Comparison with idiopathic pulmonary fibrosis (IPF) and visual overview of the hypersensitivity pneumonitis transcriptome. (A) Surface density in the three IPF severity groups compared with controls and fibrotic hypersensitivity pneumonitis (fHP). (B) Scatterplot of log2 fold change gene expression in IPF and hypersensitivity pneumonitis–corresponding disease severity groups. (C) Principal component analysis of all sequenced samples, showing both disease-specific signals as well as disease severity–specific signals. (D) Heatmaps of fold change and enrichment scores in hypersensitivity pneumonitis and IPF versus controls for the most important modules and xCell subtypes. (E) Correlation plot based on genes involved in the respective molecular trait. The plots shows correlations between IPF and fHP samples, stratified by disease severity. (F) Visual representation of gene expression of the six most important molecular traits in the fHP disease process. AP&S = antigen presentation and sensitization; aDC = activated dendritic cells; cDC = conventional DC; CTRL = control; ECM = extracellular matrix; FC = fold change; Mod1 = module 1; pDC = plasmacytoid DC; SfD = surface density; Tem = effector memory T cells; Tgd =  γ–delta T cells; Tregs = regulatory T cells.

Comment in

References

    1. Solaymani-Dodaran M, West J, Smith C, Hubbard R. Extrinsic allergic alveolitis: incidence and mortality in the general population. QJM . 2007;100:233–237. - PubMed
    1. Nance S, Cross R, Yi AK, Fitzpatrick EA. IFN-γ production by innate immune cells is sufficient for development of hypersensitivity pneumonitis. Eur J Immunol . 2005;35:1928–1938. - PubMed
    1. Nukui Y, Yamana T, Masuo M, Tateishi T, Kishino M, Tateishi U, et al. Serum CXCL9 and CCL17 as biomarkers of declining pulmonary function in chronic bird-related hypersensitivity pneumonitis. PLoS One . 2019;14:e0220462. - PMC - PubMed
    1. Barrera L, Mendoza F, Zuñiga J, Estrada A, Zamora AC, Melendro EI, et al. Functional diversity of T-cell subpopulations in subacute and chronic hypersensitivity pneumonitis. Am J Respir Crit Care Med . 2008;177:44–55. - PubMed
    1. Vasakova M, Selman M, Morell F, Sterclova M, Molina-Molina M, Raghu G. Hypersensitivity pneumonitis: current concepts of pathogenesis and potential targets for treatment. Am J Respir Crit Care Med . 2019;200:rccm.201903-0541PP. - PubMed

Publication types

Substances