

Trends in Outpatient Care for Medicare Beneficiaries and Implications for Primary Care, 2000 to 2019
- PMID: 34724406
- PMCID: PMC8688292
- DOI: 10.7326/M21-1523
Trends in Outpatient Care for Medicare Beneficiaries and Implications for Primary Care, 2000 to 2019
Erratum in
-
Correction: Trends in Outpatient Care for Medicare Beneficiaries and Implications for Primary Care, 2000 to 2019.Ann Intern Med. 2022 Oct;175(10):1492. doi: 10.7326/L22-0334. Epub 2022 Aug 30. Ann Intern Med. 2022. PMID: 36037473 No abstract available.
-
Correction: Trends in Outpatient Care for Medicare Beneficiaries and Implications for Primary Care, 2000 to 2019.Ann Intern Med. 2024 Jun;177(6):839. doi: 10.7326/ANNALS-24-00340. Epub 2024 May 21. Ann Intern Med. 2024. PMID: 38768460 No abstract available.
Abstract
Background: Despite the central role of primary care in improving health system performance, there are little recent data on how use of primary care and specialists has evolved over time and its implications for the range of care coordination needed in primary care.
Objective: To describe trends in outpatient care delivery and the implications for primary care provider (PCP) care coordination.
Design: Descriptive, repeated, cross-sectional study using Medicare claims from 2000 to 2019, with direct standardization used to control for changes in beneficiary characteristics over time.
Setting: Traditional fee-for-service Medicare.
Patients: 20% sample of Medicare beneficiaries.
Measurements: Annual counts of outpatient visits and procedures, the number of distinct physicians seen, and the number of other physicians seen by a PCP's assigned Medicare patients.
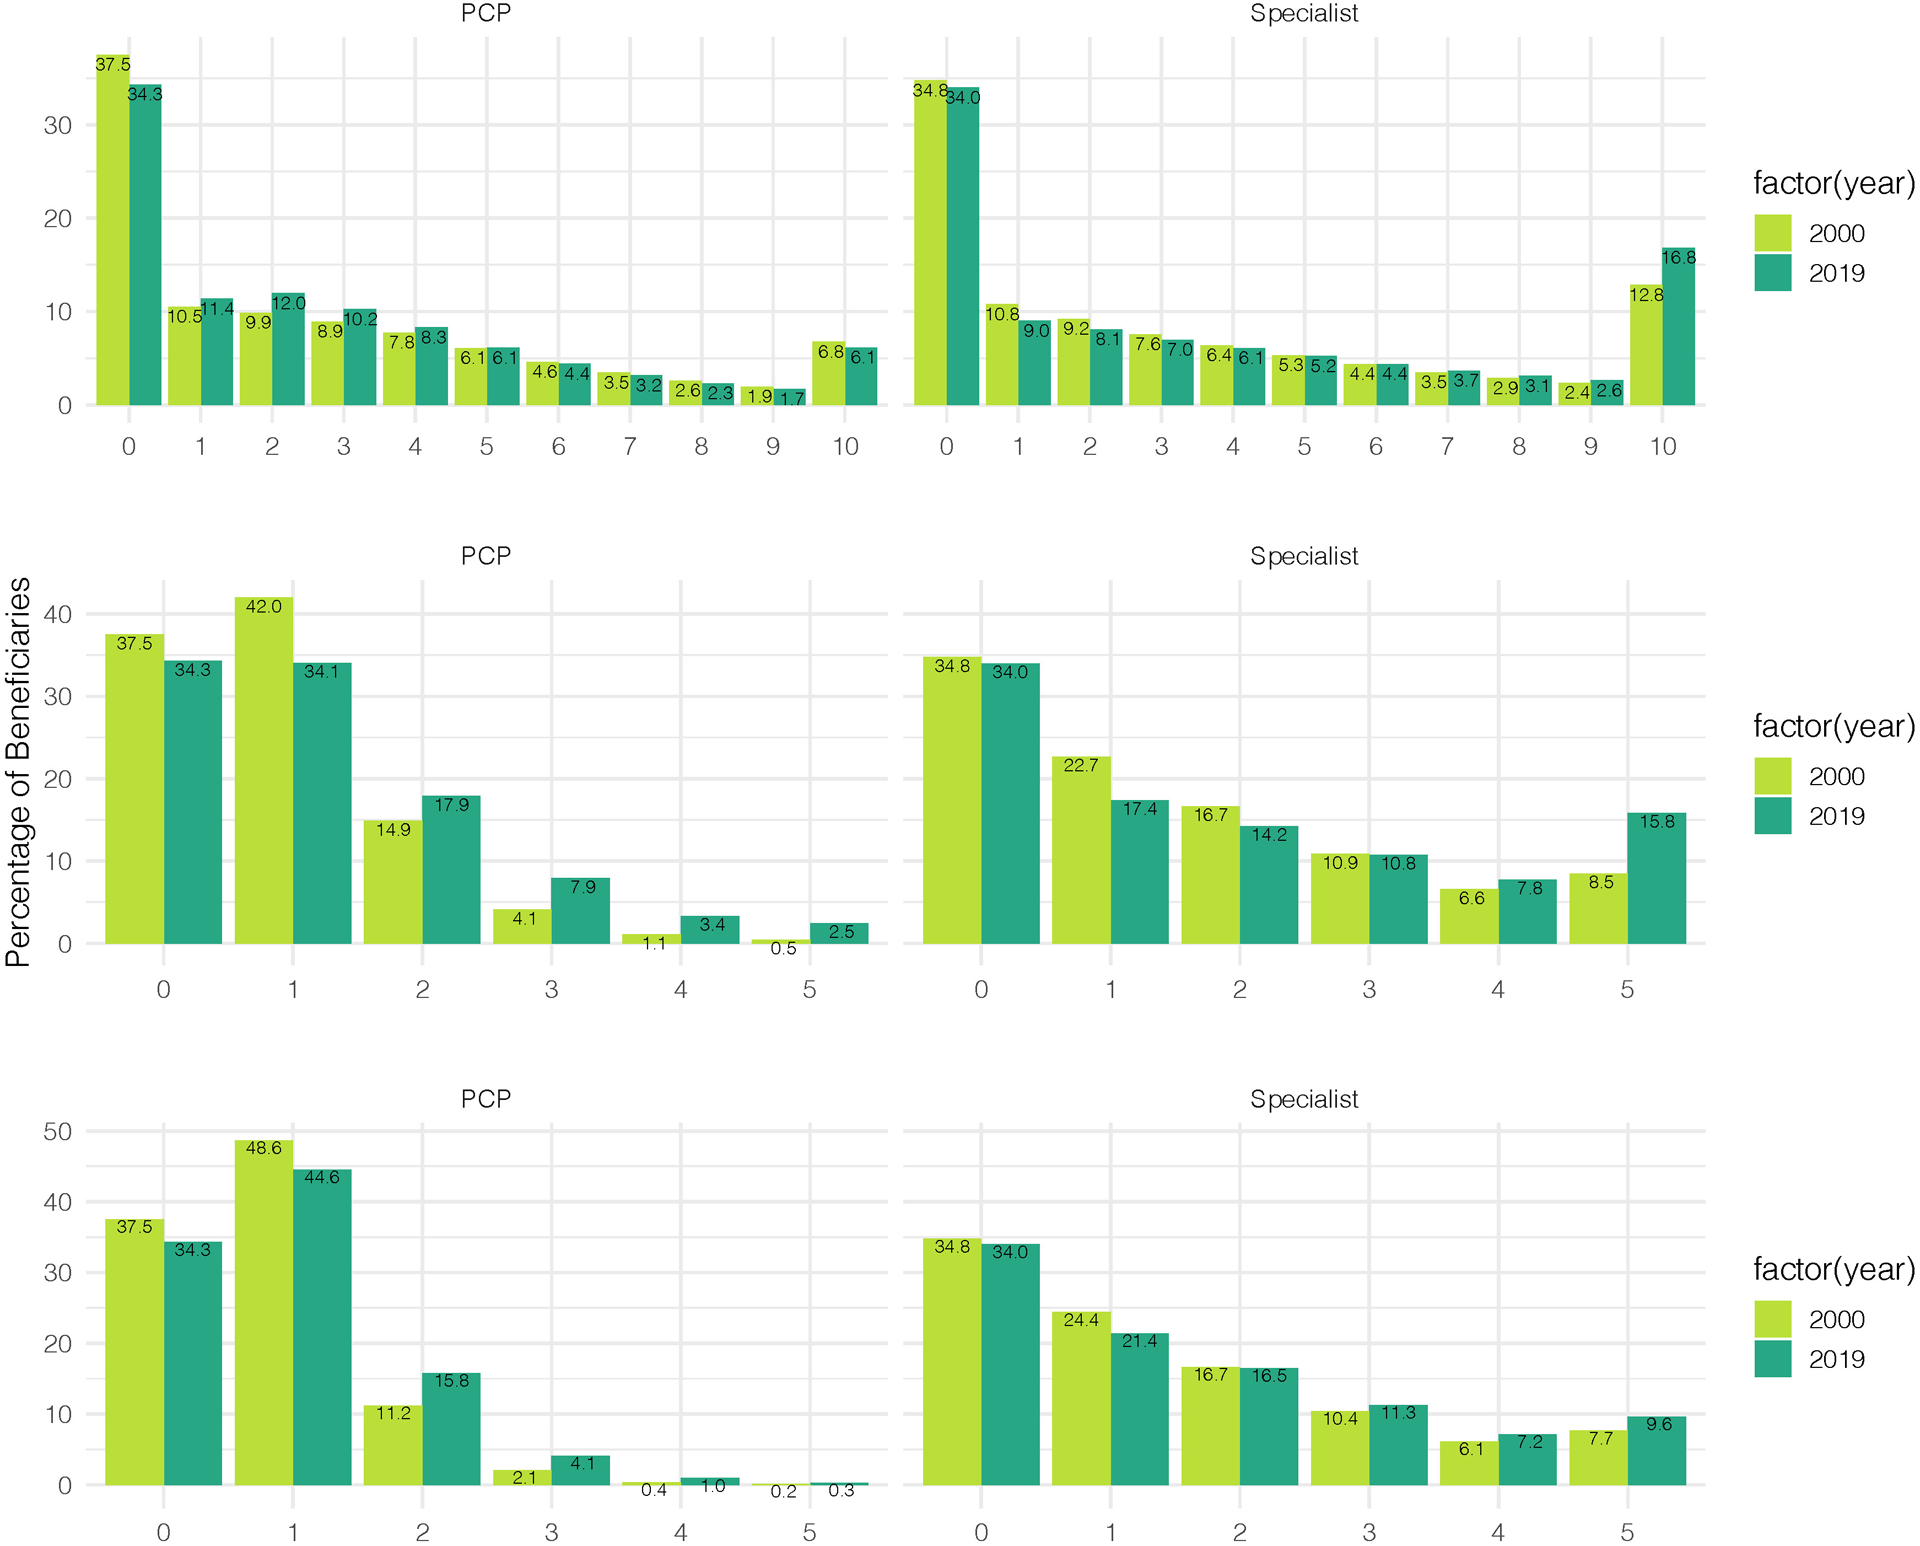
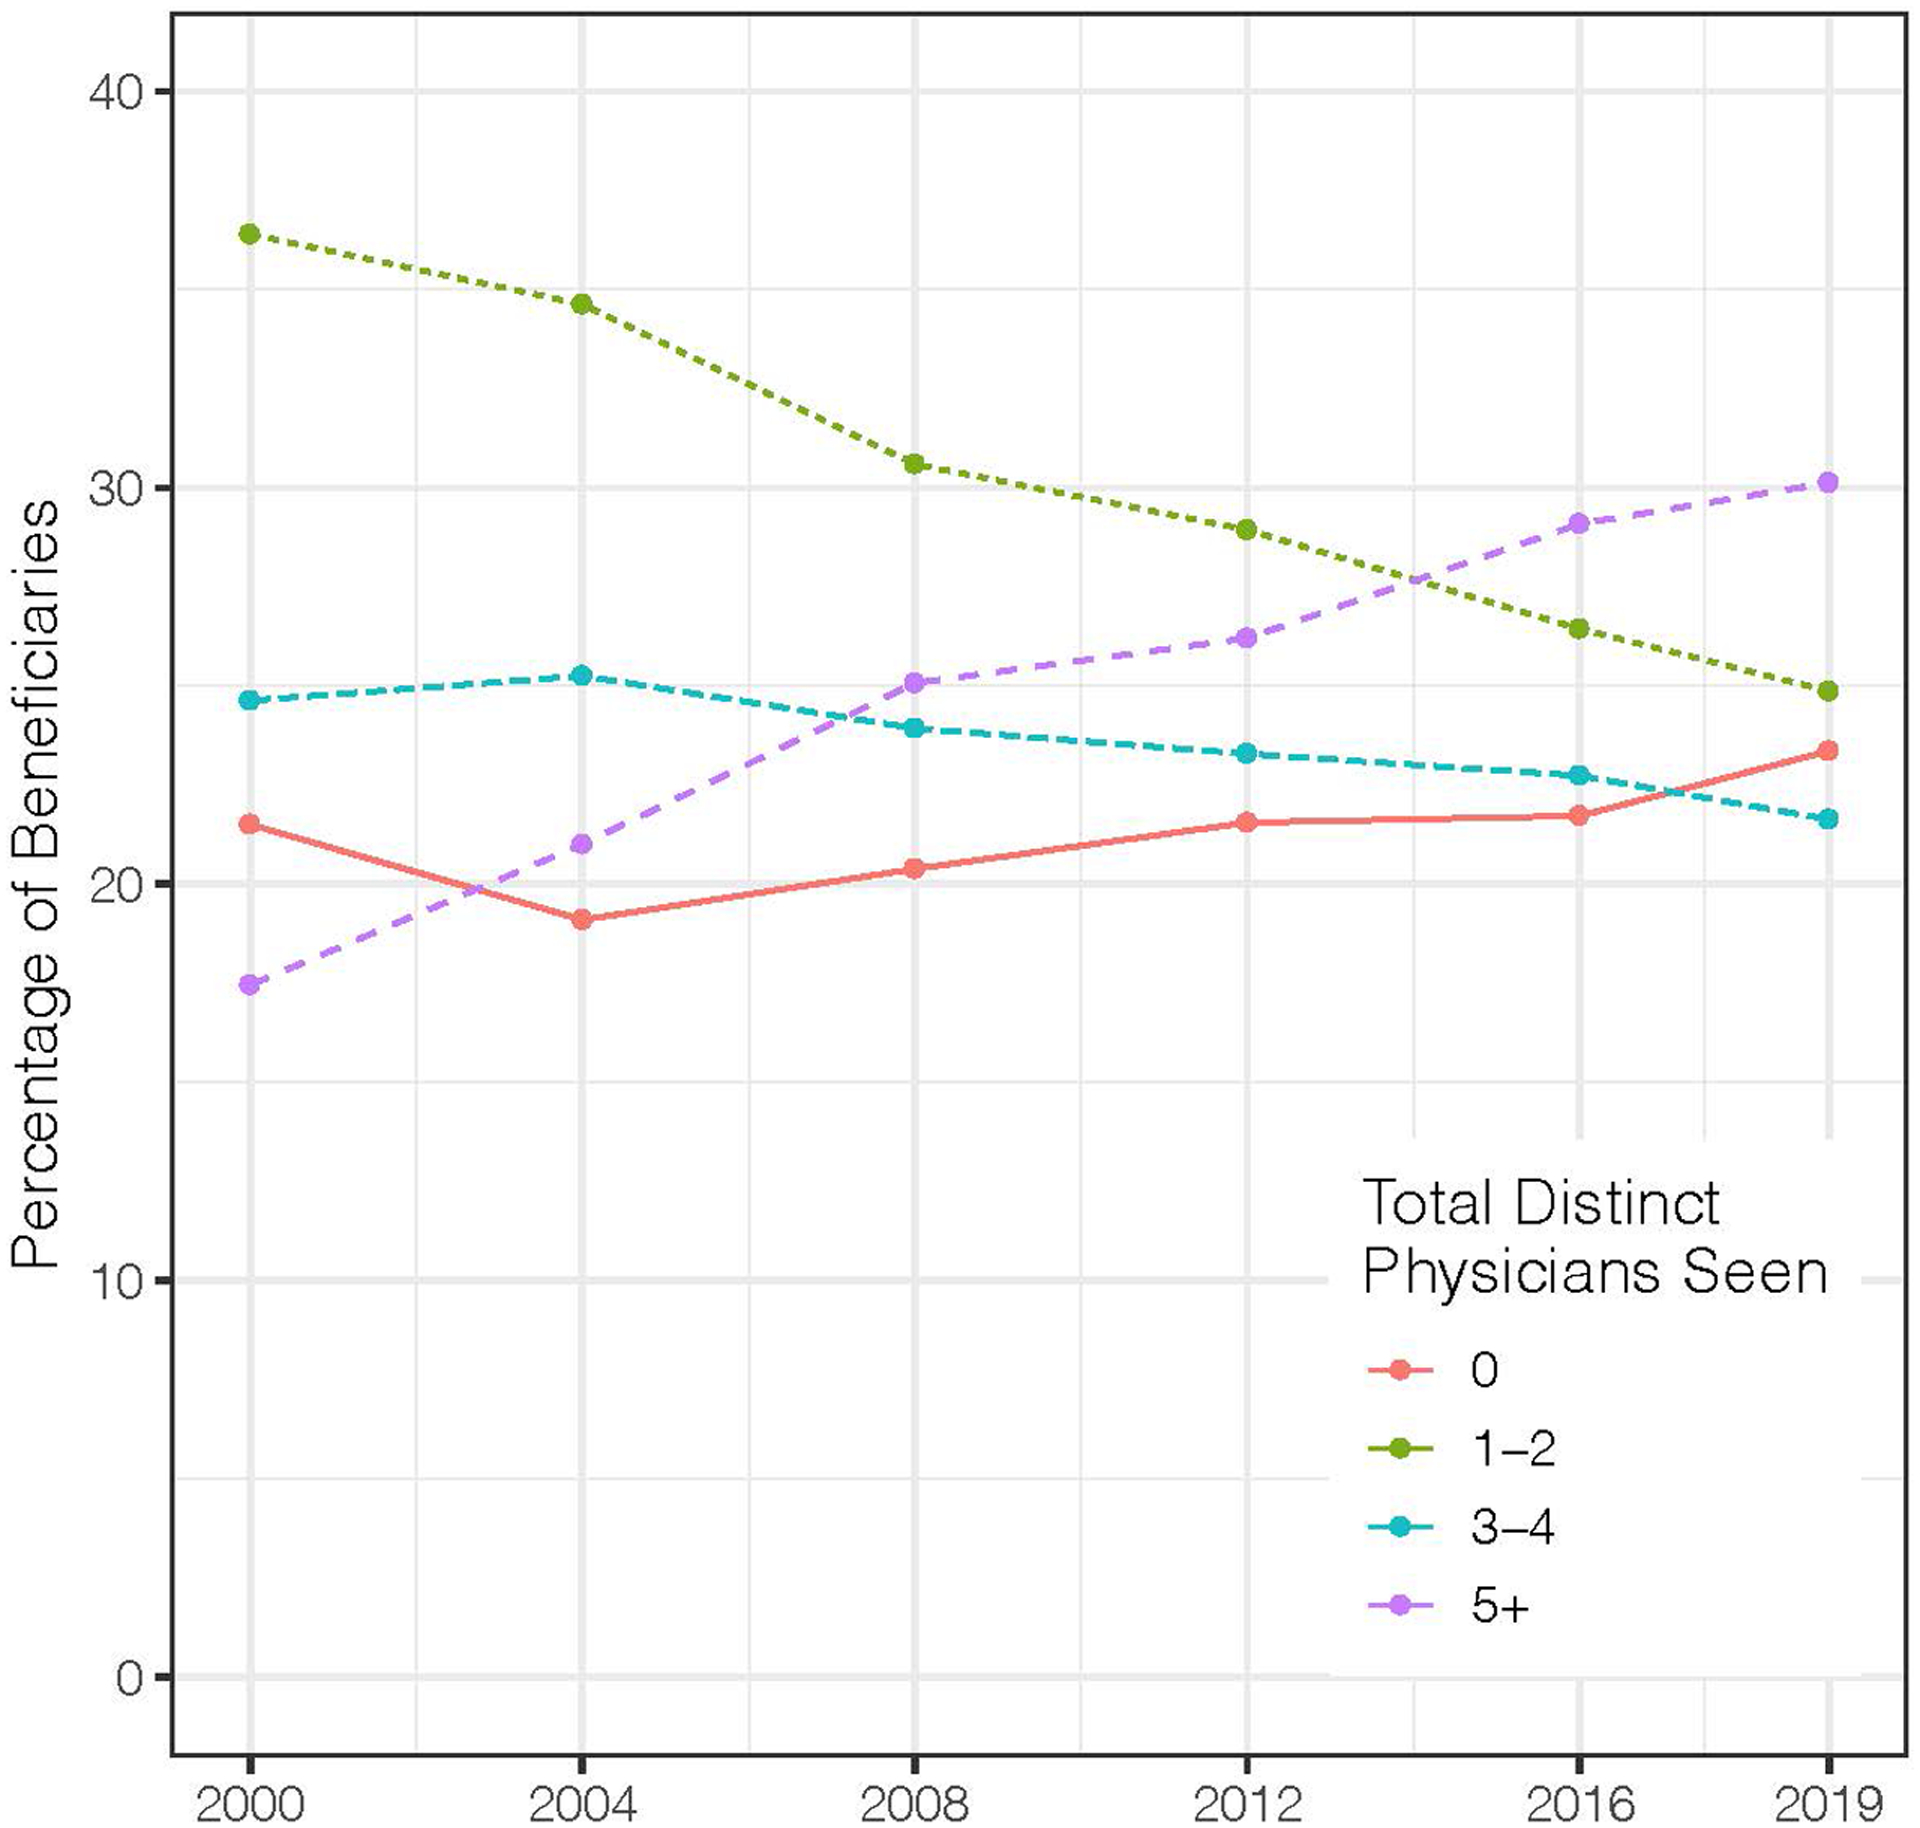
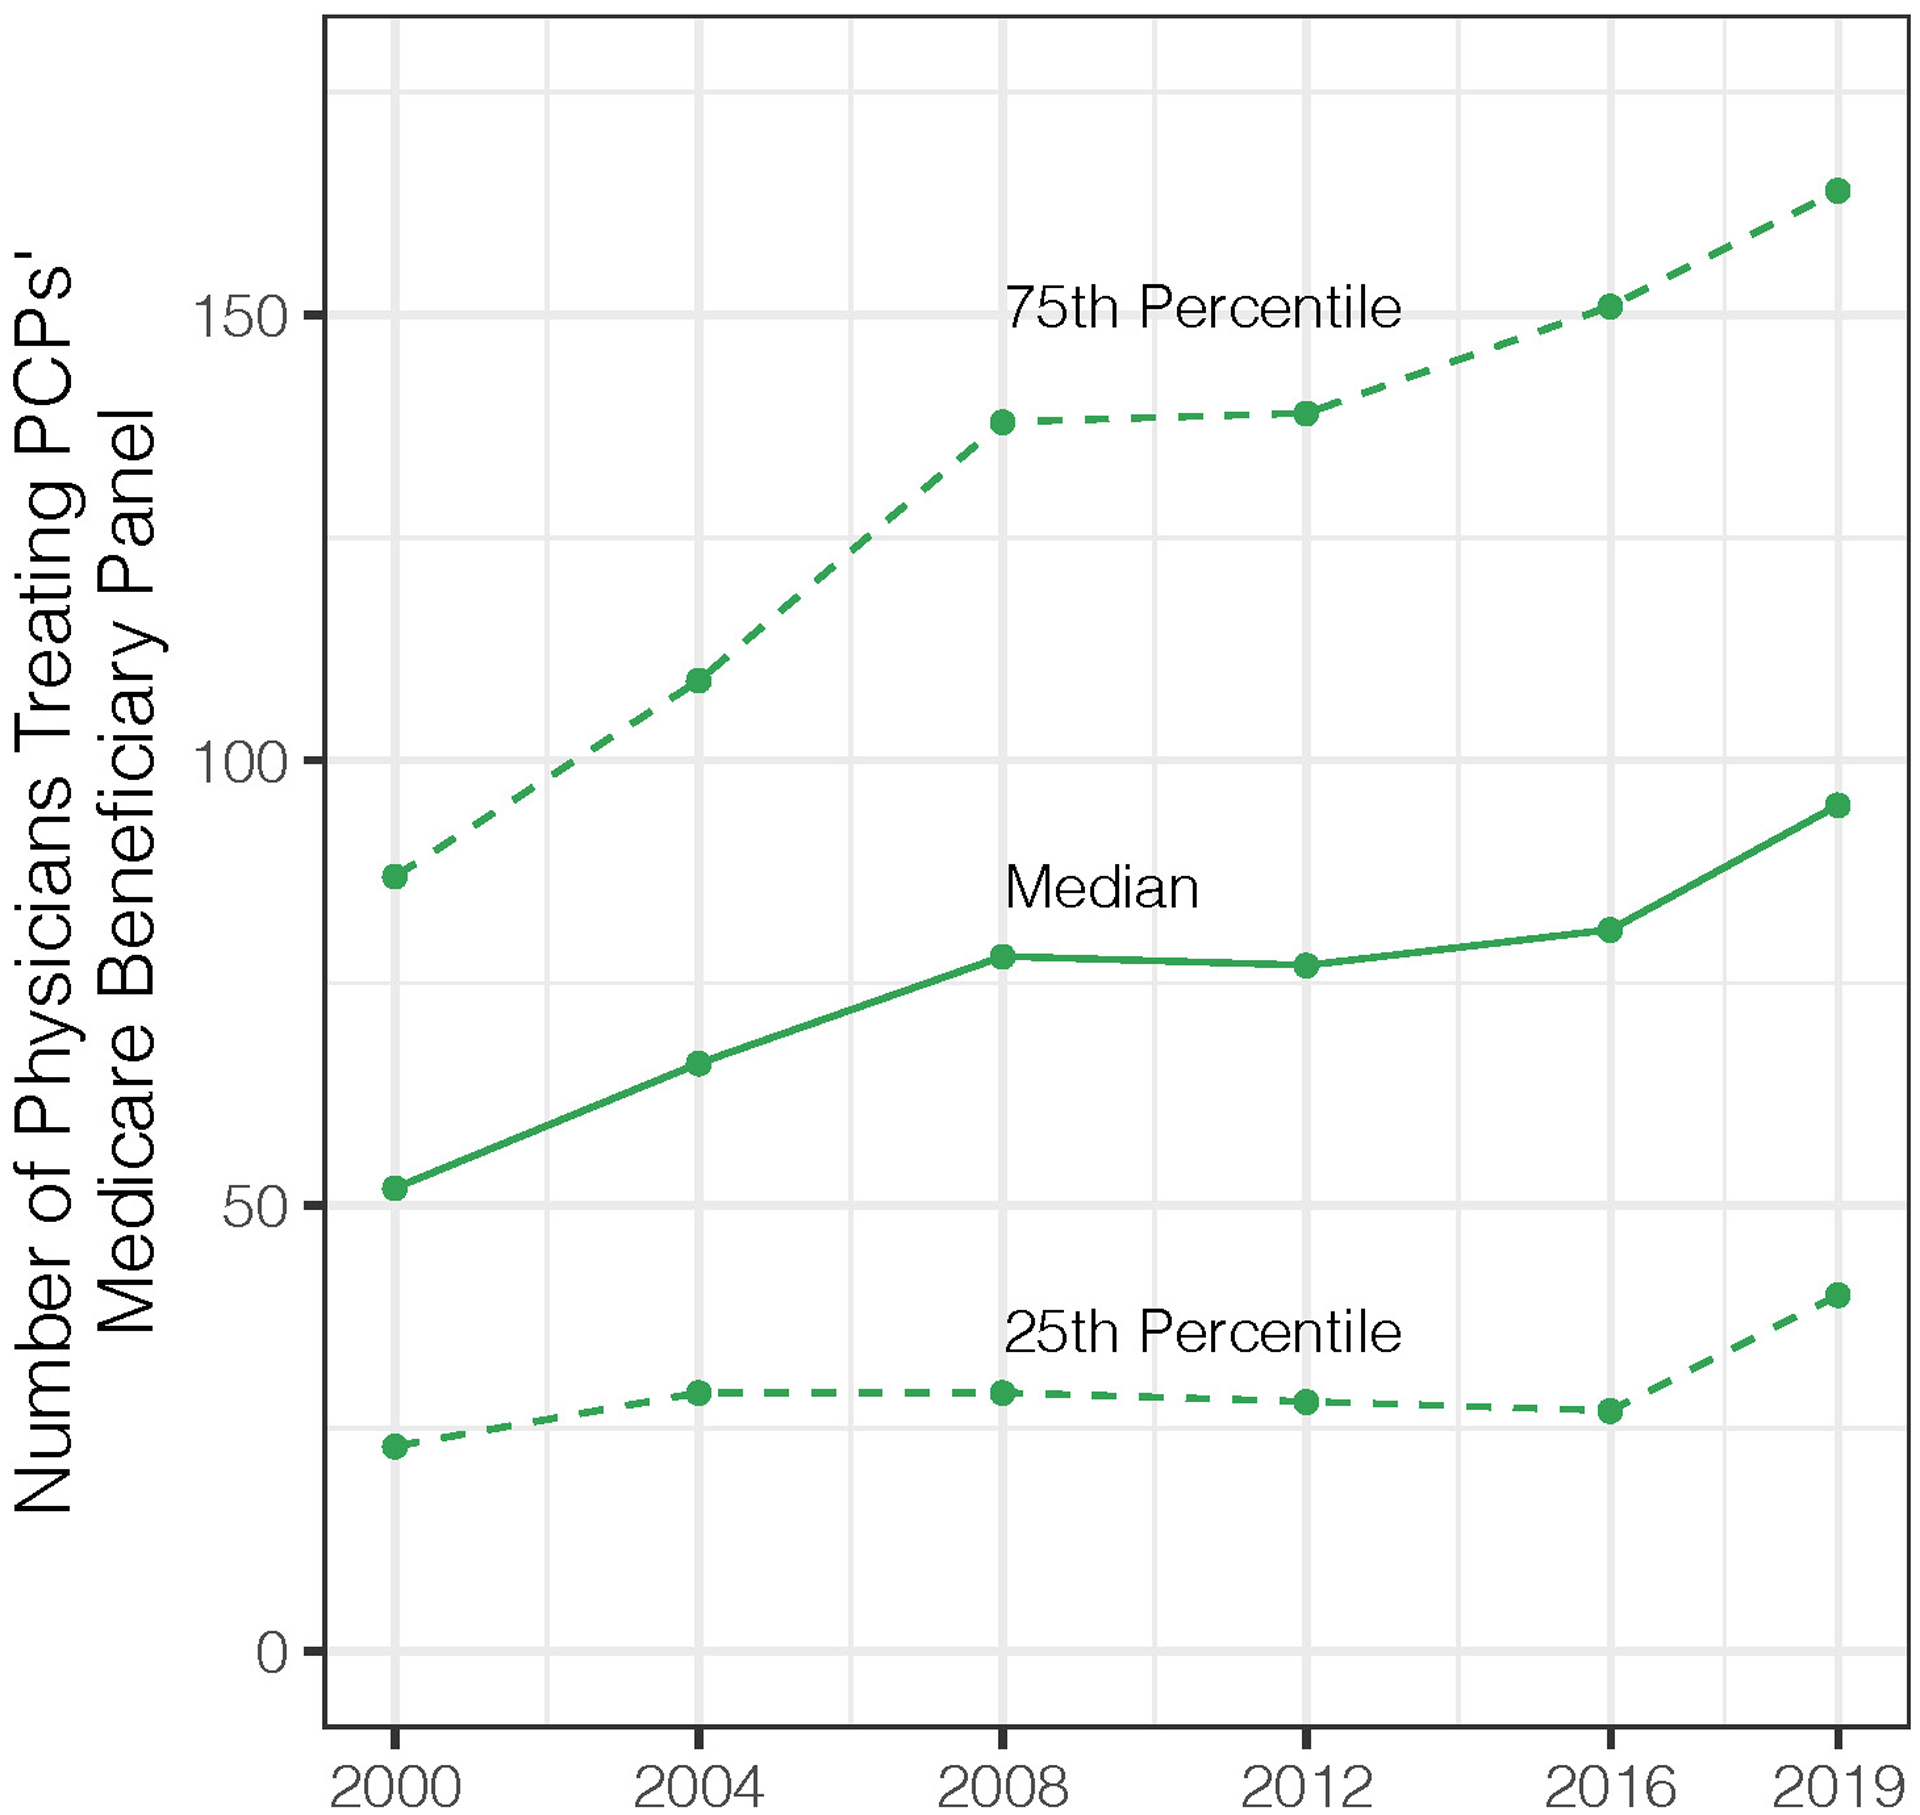
Results: The proportion of Medicare beneficiaries with any PCP visit annually only slightly increased from 61.2% in 2000 to 65.7% in 2019. The mean annual number of primary care office visits per beneficiary also changed little from 2000 to 2019 (2.99 to 3.00), although the mean number of PCPs seen increased from 0.89 to 1.21 (36.0% increase). In contrast, the mean annual number of visits to specialists increased 20% from 4.05 to 4.87, whereas the mean number of unique specialists seen increased 34.2% from 1.63 to 2.18. The proportion of beneficiaries seeing 5 or more physicians annually increased from 17.5% to 30.1%. In 2000, a PCP's Medicare patient panel saw a median of 52 other physicians (interquartile range, 23 to 87), increasing to 95 (interquartile range, 40 to 164) in 2019.
Limitation: Data were limited to Medicare beneficiaries and, because of the use of a 20% sample, may underestimate the number of other physicians seen across a PCP's entire panel.
Conclusion: Outpatient care for Medicare beneficiaries has shifted toward more specialist care received from more physicians without increased primary care contact. This represents a substantial expansion of the coordination burden faced by PCPs.
Primary funding source: National Institute on Aging.
Figures
References
-
- American College of Physicians. The impending collapse of primary care medicine and its implications for the state of the nation’s health care: a public policy report of the American College of Physicians [Internet]. 2006. [cited 2019 Aug 20]. Available from: https://www.acponline.org/acp_policy/policies/impending_collapse_of_prim...
-
- Sandy LG, Bodenheimer T, Pawlson LG, Starfield B. The Political Economy Of U.S. Primary Care. Health Aff (Millwood). 2009. July 1;28(4):1136–45. - PubMed
-
- Bodenheimer T, Grumbach K, Berenson RA. A Lifeline for Primary Care. N Engl J Med. 2009. June 25;360(26):2693–6. - PubMed
-
- Bodenheimer T Coordinating care--a perilous journey through the health care system. N Engl J Med. 2008. March 6;358(10):1064–71. - PubMed
Publication types
MeSH terms
Grants and funding
LinkOut - more resources
Full Text Sources
Medical