. 2021 Dec 21;12(6):e0154221.
doi: 10.1128/mBio.01542-21. Epub 2021 Nov 2.

Bacterial Filamentation Drives Colony Chirality

Affiliations

Bacterial Filamentation Drives Colony Chirality

Andrés Aranda-Díaz et al. mBio. .

Abstract

Chirality is ubiquitous in nature, with consequences at the cellular and tissue scales. As Escherichia coli colonies expand radially, an orthogonal component of growth creates a pinwheel-like pattern that can be revealed by fluorescent markers. To elucidate the mechanistic basis of this colony chirality, we investigated its link to left-handed, single-cell twisting during E. coli elongation. While chemical and genetic manipulation of cell width altered single-cell twisting handedness, colonies ceased to be chiral rather than switching handedness, and anaerobic growth altered colony chirality without affecting single-cell twisting. Chiral angle increased with increasing temperature even when growth rate decreased. Unifying these findings, we discovered that colony chirality was associated with the propensity for cell filamentation. Inhibition of cell division accentuated chirality under aerobic growth and generated chirality under anaerobic growth. Thus, regulation of cell division is intrinsically coupled to colony chirality, providing a mechanism for tuning macroscale spatial patterning. IMPORTANCE Chiral objects, such as amino acids, are distinguishable from their mirror image. For living systems, the fundamental mechanisms relating cellular handedness to chirality at the multicellular scale remain largely mysterious. Here, we use chemical, genetic, and environmental perturbations of Escherichia coli to investigate whether pinwheel patterns in bacterial colonies are directly linked to single-cell growth behaviors. We discover that chirality can be abolished without affecting single-cell twisting; instead, the degree of chirality was linked to the proportion of highly elongated cells at the colony edge. Inhibiting cell division boosted the degree of chirality during aerobic growth and even introduced chirality to otherwise achiral colonies during anaerobic growth. These findings reveal a fascinating connection between cell division and macroscopic colony patterning.

Keywords: A22; MreB; anaerobic growth; cell wall; cephalexin; chirality; colony growth; peptidoglycan; temperature; twisting.


Figures

FIG 1
FIG 1
A22 reverses twisting handedness and alters cellular dimensions in E. coli DH5α. (A) Schematic of left-handed twisting during elongation of a rod-shaped cell. (B) In the Twist-n-TIRF method, the cell surface is labeled and the side of the cell closest to the coverslip is bleached using a TIRF microscope. During subsequent TIRF imaging at lower intensity, unbleached parts of the cell appear associated with cell twisting (see Materials and Methods). Phase-contrast images are displayed on the right. A22-treated E. coli DH5α cells are typically shorter and wider than untreated cells and twist with opposite handedness during the tracking step; note the appearance of fluorescence on the lower left and upper right in the A22-treated cell, as opposed to the upper left and lower right in the untreated cell. (C) In the absence of A22, virtually all E. coli DH5α cells exhibit left-handed twisting, while cells treated with 1.5 μg/ml A22 exhibit right-handed twisting. The number of cells (n) is indicated above each bar. (D) E. coli DH5α cell width during log-phase growth in liquid increases as a function of A22 concentration. For concentrations of <1 μg/ml, cell length decreases with increasing A22 concentration. Circles represent mean dimensions, and ellipses represent the covariance matrix of length and width. At least 50 cells were quantified for each condition.
FIG 2
FIG 2
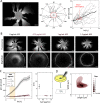
A22 treatment reduces colony chiral angle. (A, left) Genetic demixing during E. coli DH5α colony growth results in monoclonal sectors. Scale bar, 1 mm. (Middle) Although the shape of the boundaries between light (YFP) and dark sectors appeared stochastic, quantitative image analysis revealed an overall clockwise rotation of sector boundaries when the plate was viewed from the top (air interface). (Right) The slope (red) of the mean (thick black curve) is defined as the chiral angle. (B) Images of typical colonies after 7 days of growth on plates with various concentrations of A22 illustrate that colony growth is hindered by A22. The bright outline in the brightfield images denotes the colony border. Sector boundaries were straighter at higher A22 concentrations. Scale bars, 1 mm. (C, left) Mean rotation of sector boundaries at various A22 concentrations. (Right) The chiral angle decreases at higher A22 concentrations. Mean chiral angles were calculated for radii highlighted by the yellow region. Each data point is the average of results for ≥5 colonies. Error bars represent 1 standard deviation. (D) During colony growth in the presence of 1.5 μg/ml A22, cellular dimensions gradually revert back to those of cells grown in colonies in the absence of A22, suggesting morphological adaptation to A22.
FIG 3
FIG 3
A genetic perturbation that causes cells to become wider eliminates colony chirality. (A, B) Heterologous expression of the mrdA gene from Vibrio cholerae (Vc-mrdA) in the E. coli DH5α-E ΔmrdA background increases cell width during log phase in liquid growth relative to that of wild-type (WT) DH5α-H or DH5α-E cells. (B) Circles represent mean values, and ellipses represent the covariance of width and length. At least 50 cells were quantified for each strain. Scale bar, 5 μm. (C, D) Colony chirality is reduced by heterologous expression of Vc-mrdA. (C) Image of typical colonies after 7 days of growth. Scale bars, 1 mm. (D, left) Mean rotation of sector boundaries for each strain. (Right) The chiral angle is essentially zero for the Vc-mrdA strain. Mean chiral angles were calculated for radii highlighted in the yellow region. Each data point is the average of results for ≥5 colonies. Error bars represent 1 standard deviation.
FIG 4
FIG 4
Colony chirality is decreased during growth when sandwiched between agar surfaces or under anaerobic conditions. (A, top) Schematic of control experiments with an air-agar interface (“Open,” left) and sandwiched between two agar surfaces (“Between,” right) (see Materials and Methods). (Bottom) Representative colonies for each condition. Sector boundaries were straighter in the sandwiched colony. Scale bars, 1 mm. (B, left) Mean rotation of sector boundaries under each condition in panel A. (Right) The chiral angle is essentially zero for sandwiched colonies. Mean chiral angles were calculated for radii highlighted in the yellow region. Each data point is the average of results for ≥5 colonies. Error bars represent 1 standard deviation. (C, top) Schematic of growth under aerobic conditions and in an anaerobic chamber. (Bottom) Representative colonies for each condition. Sector boundaries were straighter during anaerobic growth. Scale bars, 1 mm. (D, left) Mean rotation of sector boundaries under each condition in panel C. (Right) The chiral angle is essentially zero during anaerobic growth. Mean chiral angles were calculated for radii highlighted in the yellow region. Each data point is the average of results for ≥5 colonies. Error bars represent 1 standard deviation. (E) DH5α cells still exhibit twisting at the single-cell level during anaerobic growth at 37°C, as revealed by Twist-n-TIRF. For both aerobic and anaerobic growth, all cells whose handedness could be reliably classified were left-handed (n = 43, aerobic; n = 31, anaerobic). Scale bars, 2 μm.
FIG 5
FIG 5
Chiral angle increases with increasing temperature. (A) E. coli DH5α growth depends on temperature. (Left) The maximum growth rate in liquid peaks at 42°C. (Right) Colony radius is higher at 37°C than at 30 or 42°C. a.u., arbitrary units. (B) Images of representative colonies show increasing chirality at higher temperatures. Scale bars, 1 mm. (C, left) Mean rotation of sector boundaries at each temperature. (Right) The chiral angle continues to increase with increasing temperature, even at 42°C. Mean chiral angles were calculated for radii highlighted in the yellow region. Each data point is the average of results for ≥5 colonies. Error bars represent 1 standard deviation.
FIG 6
FIG 6
Conditions with enhanced colony chirality exhibit increased fractions of filamentous cells at the colony edge. (A, left) Schematic of sampling from the colony edge. (Right) Imaging of the colony edge reveals filamentous cells at the border (arrows). The inset is a 200% magnification of the region surrounded by the dashed white line, highlighting a filamentous cell. (B) At higher temperatures, a larger fraction of the population exhibits filamentation. (Left) The cumulative distribution function of cell length shifted to the right at increasing temperatures, and very long, filamentous cells were found at high temperatures. The inset is a magnification of the dotted region. Pairwise differences of the distributions are all significant based on Kolmogorov-Smirnov (P < 0.002) and Mann-Whitney (P < 0.004) tests. (Middle) The fraction of cells with a length of >5 μm in samples from the edge of colonies increased at increasing temperature. (Right) The mean cell length also increased slightly with increasing temperature. Each circle was computed from ≥16 fields of view from a sample from a distinct colony. (C) During aerobic growth, a larger fraction of the population exhibits filamentation than anaerobic growth. The inset is a magnification of the dotted region. The difference between cumulative distribution functions is significant based on a Kolmogorov-Smirnov test (P = 10−5), not on a Mann-Whitney test (P = 0.13).
FIG 7
FIG 7
Division inhibition using cephalexin results in enhanced chirality during aerobic growth and the introduction of chirality during anaerobic growth. (A, left) Mean rotation of sector boundaries of aerobically grown wild-type DH5α colonies with various concentrations of cephalexin. (Right) The chiral angle increases with increasing cephalexin concentration. Mean chiral angles were calculated for radii highlighted in the yellow region. Each data point is the average of results for ≥5 colonies. Error bars represent 1 standard deviation. (B) Representative colonies grown aerobically with various concentrations of cephalexin. Scale bars, 1 mm. (C, left) Mean rotation of sector boundaries of anaerobically grown wild-type DH5α colonies without and with cephalexin. (Right) In the presence, but not in the absence, of cephalexin, colonies exhibit chirality. Mean chiral angles were calculated for radii highlighted in the yellow region. Each data point is the average of results for ≥5 colonies. Error bars represent 1 standard deviation. (D) Representative colonies grown anaerobically without and with 10 μg/ml cephalexin. Scale bars, 1 mm.

References

    1. Satir P. 2016. Chirality of the cytoskeleton in the origins of cellular asymmetry. Philos Trans R Soc Lond B Biol Sci 3713:20150408. doi:10.1098/rstb.2015.0408. - DOI - PMC - PubMed
    1. Shi H, Quint DA, Grason GM, Gopinathan A, Huang KC. 2020. Chiral twisting in a bacterial cytoskeletal polymer affects filament size and orientation. Nat Commun 11:1408. doi:10.1038/s41467-020-14752-9. - DOI - PMC - PubMed
    1. Hozumi S, Maeda R, Taniguchi K, Kanai M, Shirakabe S, Sasamura T, Spéder P, Noselli S, Aigaki T, Murakami R, Matsuno K. 2006. An unconventional myosin in Drosophila reverses the default handedness in visceral organs. Nature 440:798–802. doi:10.1038/nature04625. - DOI - PubMed
    1. Inaki M, Liu J, Matsuno K. 2016. Cell chirality: its origin and roles in left-right asymmetric development. Philos Trans R Soc Lond B Biol Sci 371:20150403. doi:10.1098/rstb.2015.0403. - DOI - PMC - PubMed
    1. Naganathan SR, Furthauer S, Nishikawa M, Julicher F, Grill SW. 2014. Active torque generation by the actomyosin cell cortex drives left-right symmetry breaking. Elife 3:e04165. doi:10.7554/eLife.04165. - DOI - PMC - PubMed

Publication types