. 2021 Dec 21;12(6):e0259521.
doi: 10.1128/mBio.02595-21. Epub 2021 Nov 2.

DNA Viral Diversity, Abundance, and Functional Potential Vary across Grassland Soils with a Range of Historical Moisture Regimes

Affiliations

DNA Viral Diversity, Abundance, and Functional Potential Vary across Grassland Soils with a Range of Historical Moisture Regimes

Ruonan Wu et al. mBio. .

Abstract

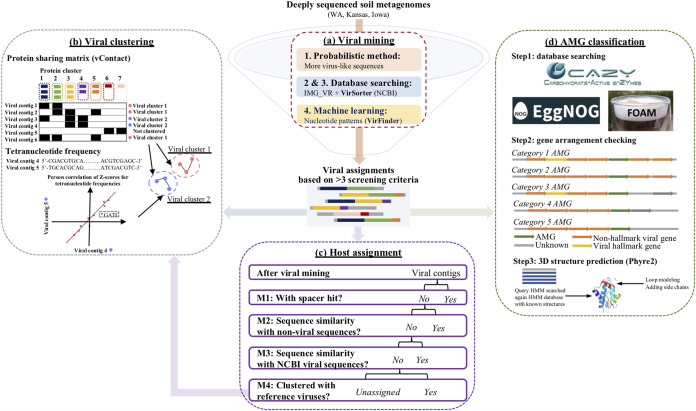
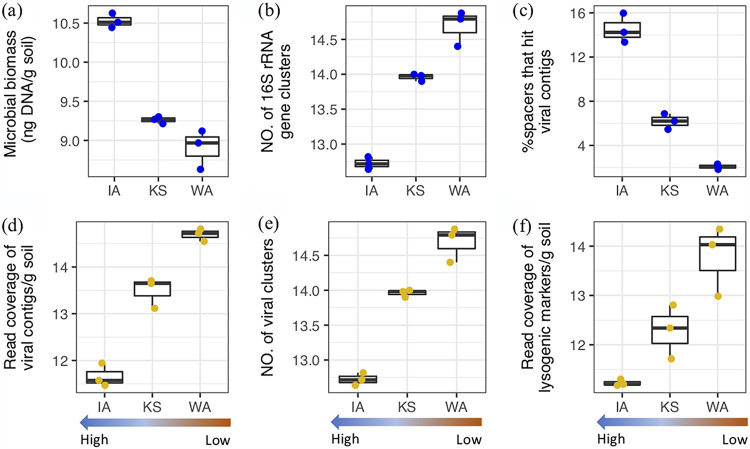
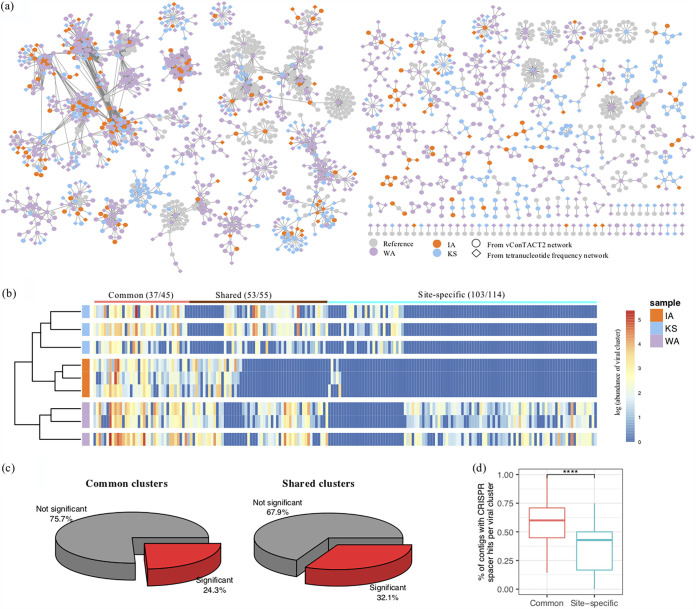
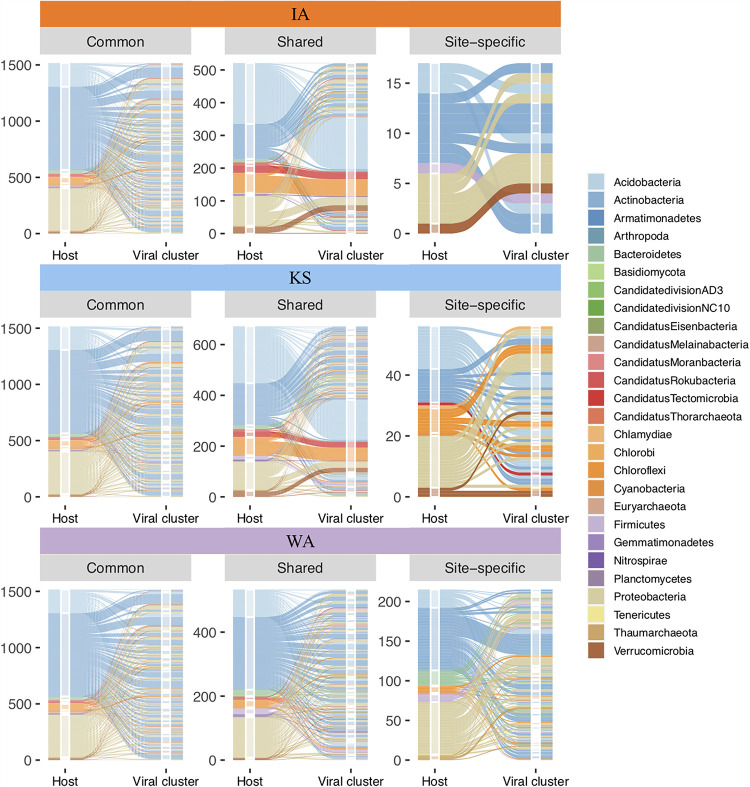
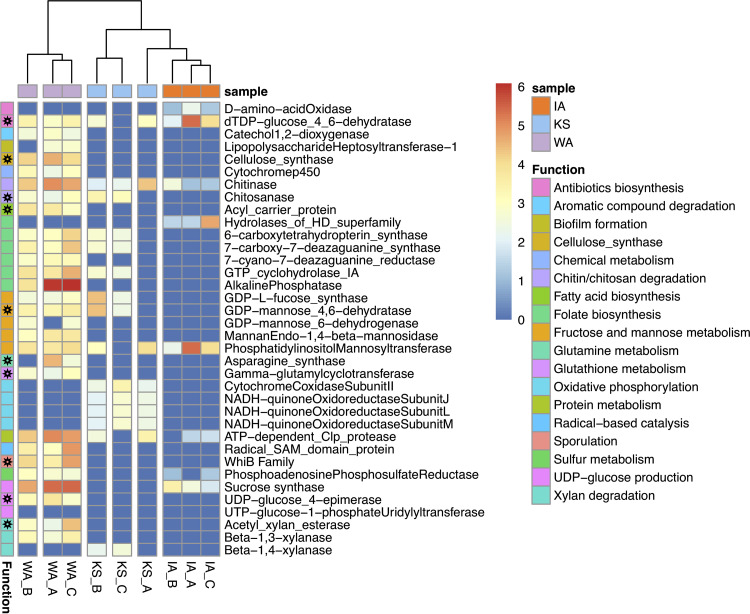
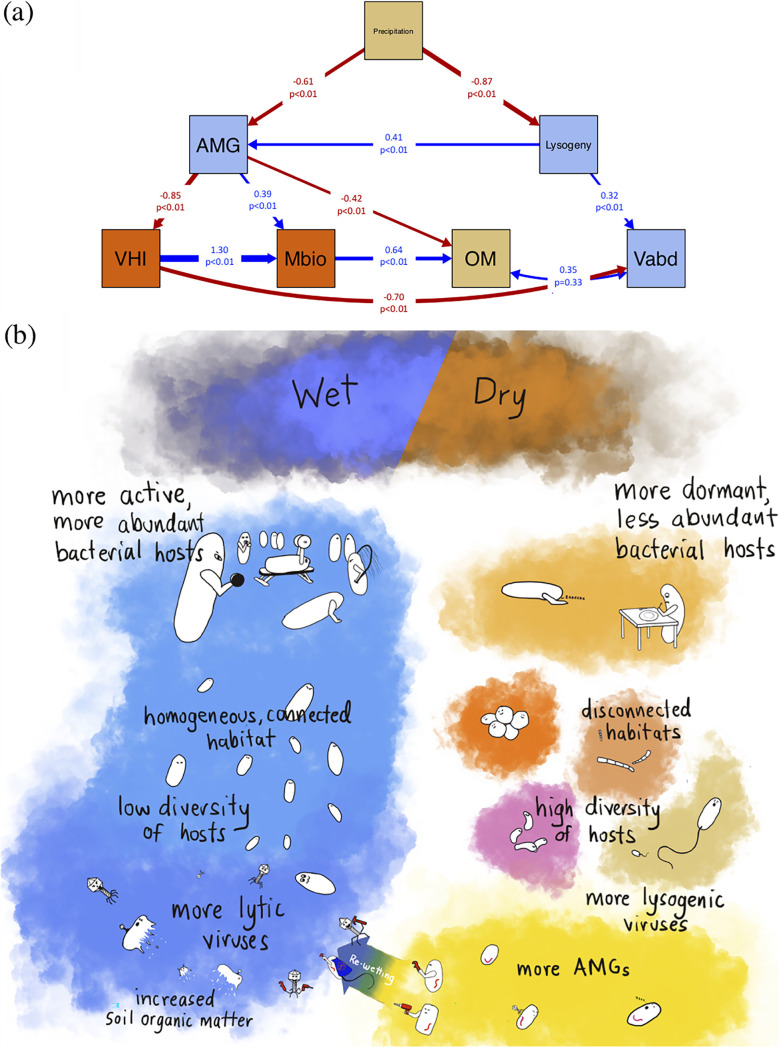
Soil viruses are abundant, but the influence of the environment and climate on soil viruses remains poorly understood. Here, we addressed this gap by comparing the diversity, abundance, lifestyle, and metabolic potential of DNA viruses in three grassland soils with historical differences in average annual precipitation, low in eastern Washington (WA), high in Iowa (IA), and intermediate in Kansas (KS). Bioinformatics analyses were applied to identify a total of 2,631 viral contigs, including 14 complete viral genomes from three deep metagenomes (1 terabase [Tb] each) that were sequenced from bulk soil DNA. An additional three replicate metagenomes (∼0.5 Tb each) were obtained from each location for statistical comparisons. Identified viruses were primarily bacteriophages targeting dominant bacterial taxa. Both viral and host diversity were higher in soil with lower precipitation. Viral abundance was also significantly higher in the arid WA location than in IA and KS. More lysogenic markers and fewer clustered regularly interspaced short palindromic repeats (CRISPR) spacer hits were found in WA, reflecting more lysogeny in historically drier soil. More putative auxiliary metabolic genes (AMGs) were also detected in WA than in the historically wetter locations. The AMGs occurring in 18 pathways could potentially contribute to carbon metabolism and energy acquisition in their hosts. Structural equation modeling (SEM) suggested that historical precipitation influenced viral life cycle and selection of AMGs. The observed and predicted relationships between soil viruses and various biotic and abiotic variables have value for predicting viral responses to environmental change. IMPORTANCE Soil viruses are abundant but poorly understood. Because soil viruses regulate the dynamics of their hosts and potentially key processes in soil ecology, it is important to understand them better. Here, we leveraged massive DNA sequencing to unearth previously unknown soil viruses. We found that soil viruses differed across a historical gradient of precipitation. We compared soil viruses from Iowa, which is traditionally wetter, to those from Washington, which is traditionally drier, and from Kansas, which is intermediate. This study provides strong evidence that changes in historical precipitation impact not only the types of soil viruses but also their functional potential.

Keywords: auxiliary metabolic gene; grassland soil; lysogeny; metagenome; soil bacteriophage; soil virus.


Figures

FIG 1
FIG 1
Overview of bioinformatic workflow. The bioinformatic workflow comprises four modules. (a) Viral mining. Contigs with length greater than 2,500 bp (bp) were selected and screened for viral sequences by an integrated approach that combines a probabilistic approach (1) together with database searching (2) against IMG-VR (63) and (3) VirSorter (66) (NCBI), and machine learning (3). Four different criteria were then used to determine highly confident viral assignments. Only those that corroborated at least three out of the four criteria were included as confident viral sequences for further analyses. (b) Viral clustering. An integrated viral clustering network was constructed based on a protein sharing matrix by vContact (v2.0.9.10) (22). The remaining viral contigs were then linked to the clusters according to their tetranucleotide frequencies (pyani v0.2.9) (92). (c) Host assignments. The primary method (M1) used to assign the hosts of viral contigs was via matching CRISPR spacers in the nonviral contigs with the classified taxon. The additional host assignment methods (M2 to M4) were based on sequence similarity to either nonviral sequences (M2) or reference viruses (M3 based on local alignment; M4 based on protein sharing and tetranucleotide frequency). (d) Auxiliary metabolic gene (AMG) classification. Potential AMGs were first annotated by searching different functional gene databases (CAZY [84], EggNOG [61], and FOAM [85]). Potential AMGs were then classified into five categories based on their gene arrangements, and only those that contained viral genes both upstream and downstream and had a confirmed 3D structure reconstruction by Phyre2 (87) were considered AMG candidates.
FIG 2
FIG 2
Shifts in grassland soil viral and microbial communities along a gradient of historical precipitation (Iowa [IA] > Kansas [KS] > Washington [WA]). (a) Estimates of microbial biomass based on DNA yield per gram of source soil. The same color scheme was applied to all panels, with microbial data in blue and viral data in yellow. (b) Microbial diversity based on the number of 16S rRNA genes clustered at 97% identity. (c) Percentage of CRISPR spacers extracted from each soil metagenome that exactly matched viral contigs identified from the same site. (d) Estimates of viral abundances in the three soils. The sum of the average read coverage of the viral contigs identified in each soil (identity, >95%; coverage, >80%) was used to represent the viral abundance at each site. (e) Viral diversity based on clustering of detected viral contigs using a protein sharing matrix and tetranucleotide frequency (details in Materials and Methods). (f) Abundance of viral lysogenic markers. The total read coverage (identity, >95%; coverage, >80%) of viral genes encoding integrases and excisionases was used to assess the prevalence of lysogeny. All of the values shown in panels a, b, d, e, and f were first normalized to gram of soil and then log transformed. Statistical tests were performed via pairwise comparisons among the three grasslands (n = 3). Significant differences were determined using t tests in the R package (“rstatix”). In each boxplot (panels a, b, c, d, e, and f), the top and bottom of each box represent the 25th and 75th percentiles, respectively, and the center line indicates the median.
FIG 3
FIG 3
Viral contig clusters identified from Washington, Kansas, and Iowa grassland soil metagenomes. (a) Viral contigs detected from Washington (WA, purple), Kansas (KS, blue), and Iowa (IA, orange) grassland metagenomic sequences were clustered together with NCBI reference viruses (gray). Viral contigs that primarily clustered based on their protein sharing matrices are shown as closed circles, and contigs that were added to the vConTACT network based on their Z score correlations by tetranucleotide frequencies are shown as diamonds. (b) The heatmap illustrates abundance estimates for each viral cluster detected in the three replicate metagenomes from each site. The estimated abundances were log transformed, and warmer colors represent higher abundances. The abundance profile was grouped according to the similarity of the viral cluster composition. Viral clusters that were common and detected in all soil locations are labeled “common” (red line). The clusters that were found in any two of the three soil locations are labeled “shared” (brown line). Clusters that were unique to each site are labeled “site-specific” (blue line). (c) The percentage of common and shared viral clusters that differed according to differences in historical precipitation. Viral clusters with significantly differential abundances across sites were colored in red (P < 0.05), with the remainder in gray. (d) Percentage of contigs with CRISPR spacer hits in common clusters (red) versus site-specific clusters (in blue). In each boxplot, the top and bottom of each box represent the 25th and 75th percentiles, respectively, and the center line shows the median.
FIG 4
FIG 4
Predicted virus-host pairing within viral clusters detected in soil metagenomes across a gradient of historical precipitation (Iowa [IA] > Kansas [KS] > Washington [WA]). Alluvial plots illustrate virus-host pairing using the integrated approach described in Fig. 1c (host assignment). The plots are grouped by the grassland soil location (IA, orange; KS, blue; WA, purple). The number of predicted virus-host pairs are shown on the y axis. Within each soil location, virus-host pairs were plotted for viral clusters that were common to all three locations (common), shared among two of three locations (shared), or only found in one location (site-specific). For each plot, the left stratum represents host assignment, colored by phylum, and the right stratum shows viral clusters separated by horizontal white lines. The flow of the pairing is colored by the host lineage assigned. The height of the colored strata demonstrates the relative dominance of each host phylum that the identified soil viruses were predicted to target.
FIG 5
FIG 5
Auxiliary metabolic genes (AMGs) detected in three grassland soil metagenomes across a gradient of historical precipitation (Iowa [IA] > Kansas [KS] > Washington [WA]). The heatmap illustrates abundance estimates for each putative AMG in three replicate metagenomes (IA, orange; KS, blue; WA, purple). The estimated abundances represent log transformed read coverages of the viral contigs detected with the AMGs, and warmer colors represent higher abundances. The abundance profile is clustered by sample according to the similarity of AMG composition. AMGs are further grouped by KEGG Orthology (“function,” details in Table S2). AMGs with a black star in the “function” cells are also detected in the complete viral genomes (Fig. S3).
FIG 6
FIG 6
Structural equation model-supported predictions of the influence of biotic and abiotic factors on grassland soil viruses. (a) Structural equation modeling (SEM) was applied to test the conceptual relationships between abiotic properties (brown boxes), microbial abundance, and virus-host interactions (orange boxes) and the virosphere (blue boxes). The estimated abundances of viral integrases and excisionases were used to infer a lysogenic lifestyle (“lysogeny” in blue box). The total read coverages of the viral contigs with differential abundances (data in Fig. 3c) were used to represent the viral abundances in each location (“Vabd” in blue box). The DNA yield per gram of soil was used to estimate the microbial biomass (“Mbio” in orange box). The percentage of CRISPR spacers that were exact matches to the detected viral contigs was used to represent the degree of virus-host interactions (“VHI” in orange box, data shown in Fig. 2c). Organic matter (“OM” in brown box) represents the percentage of soil organic matter. The number of auxiliary metabolic categories detected from each grassland is noted as “AMG” (blue box). Blue and red arrows represent positive and negative pathways, respectively. Arrow width is proportional to the strength of the relationship, and numbers on the arrows are the path coefficients and the P value. The direction of arrows represents the direct impact of one variable on another supported by SEM. Parameters evaluating the model fitness were Chi-square (χ2) = 7.16, df = 10, P = 0.71, goodness of fit, or GFI, = 0.83, comparative fit index, or CFI, = 0.99, and standardized root mean square residual, or SRMR, = 0.04. (b) An illustration based on the SEM model to summarize viral responses to either wet or dry soil conditions and their associated impacts on the soil microbial community. In wet soil where the environment is more homogenous and microbes are higher in biomass and lower in diversity, viruses are more active and frequently interact with hosts, resulting in more host lysis. The carbon released due to host lysis may contribute to the organic matter pool in soil. In dry soil where the soil habitat is more disconnected, microbial diversity is higher and so is the associated virosphere. Instead of immediately lysing the hosts, temperate viruses carrying AMGs are selected. The hosts (lysogens) may in turn benefit from the auxiliary metabolic functions carried by the viruses, both to cope with the dry environment and when moisture becomes available.

References

    1. Trubl G, Solonenko N, Chittick L, Solonenko SA, Rich VI, Sullivan MB. 2016. Optimization of viral resuspension methods for carbon-rich soils along a permafrost thaw gradient. PeerJ 4:e1999. doi:10.7717/peerj.1999. - DOI - PMC - PubMed
    1. Williamson KE, Fuhrmann JJ, Wommack KE, Radosevich M. 2017. Viruses in soil ecosystems: an unknown quantity within an unexplored territory. Annu Rev Virol 4:201–219. doi:10.1146/annurev-virology-101416-041639. - DOI - PubMed
    1. Emerson JB, Roux S, Brum JR, Bolduc B, Woodcroft BJ, Jang HB, Singleton CM, Solden LM, Naas AE, Boyd JA, Hodgkins SB, Wilson RM, Trubl G, Li C, Frolking S, Pope PB, Wrighton KC, Crill PM, Chanton JP, Saleska SR, Tyson GW, Rich VI, Sullivan MB. 2018. Host-linked soil viral ecology along a permafrost thaw gradient. Nat Microbiol 3:870–880. doi:10.1038/s41564-018-0190-y. - DOI - PMC - PubMed
    1. Trubl G, Jang HB, Roux S, Emerson JB, Solonenko N, Vik DR, Solden L, Ellenbogen J, Runyon AT, Bolduc B, Woodcroft BJ, Saleska SR, Tyson GW, Wrighton KC, Sullivan MB, Rich VI. 2018. Soil viruses are underexplored players in ecosystem carbon processing. mSystems 3:e00076-18. doi:10.1128/mSystems.00076-18. - DOI - PMC - PubMed
    1. Paez-Espino D, Eloe-Fadrosh EA, Pavlopoulos GA, Thomas AD, Huntemann M, Mikhailova N, Rubin E, Ivanova NN, Kyrpides NC. 2016. Uncovering Earth’s virome. Nature 536:425–430. doi:10.1038/nature19094. - DOI - PubMed

Publication types

LinkOut - more resources