. 2021 Nov 2;9(1):214.
doi: 10.1186/s40168-021-01162-2.

Quantitative sequencing clarifies the role of disruptor taxa, oral microbiota, and strict anaerobes in the human small-intestine microbiome

Affiliations

Quantitative sequencing clarifies the role of disruptor taxa, oral microbiota, and strict anaerobes in the human small-intestine microbiome

Jacob T Barlow et al. Microbiome. .

Abstract

Background: Upper gastrointestinal (GI) disorders and abdominal pain afflict between 12 and 30% of the worldwide population and research suggests these conditions are linked to the gut microbiome. Although large-intestine microbiota have been linked to several GI diseases, the microbiota of the human small intestine and its relation to human disease has been understudied. The small intestine is the major site for immune surveillance in the gut, and compared with the large intestine, it has greater than 100 times the surface area and a thinner and more permeable mucus layer.

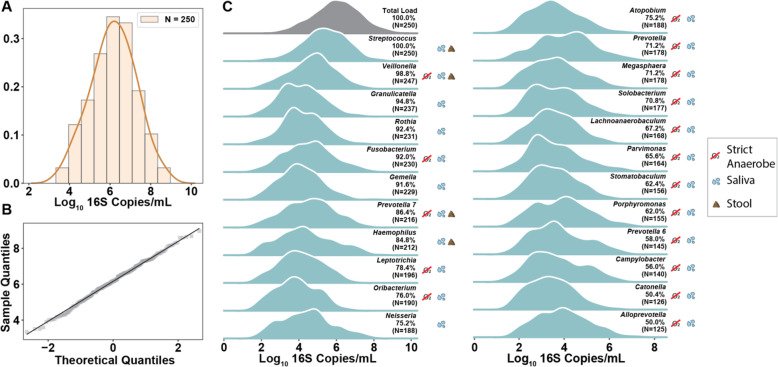
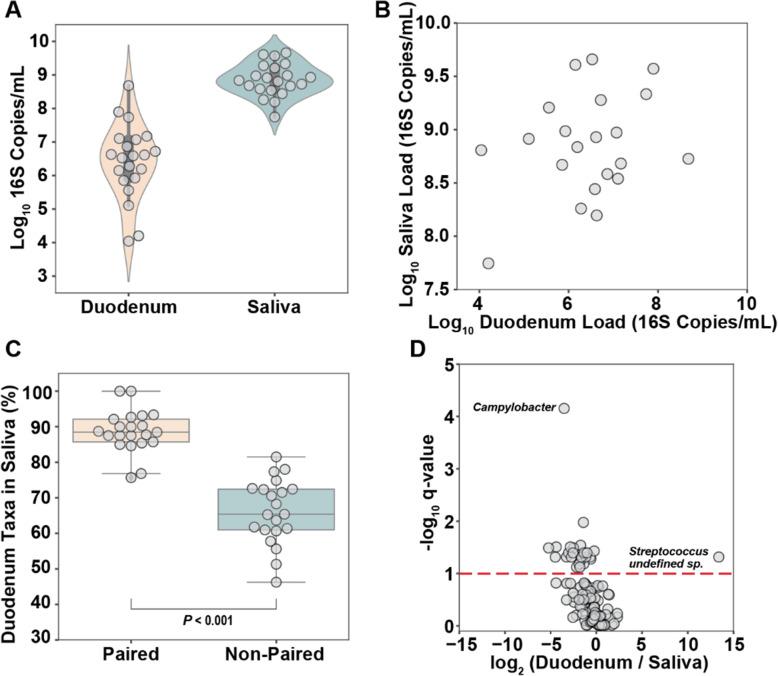
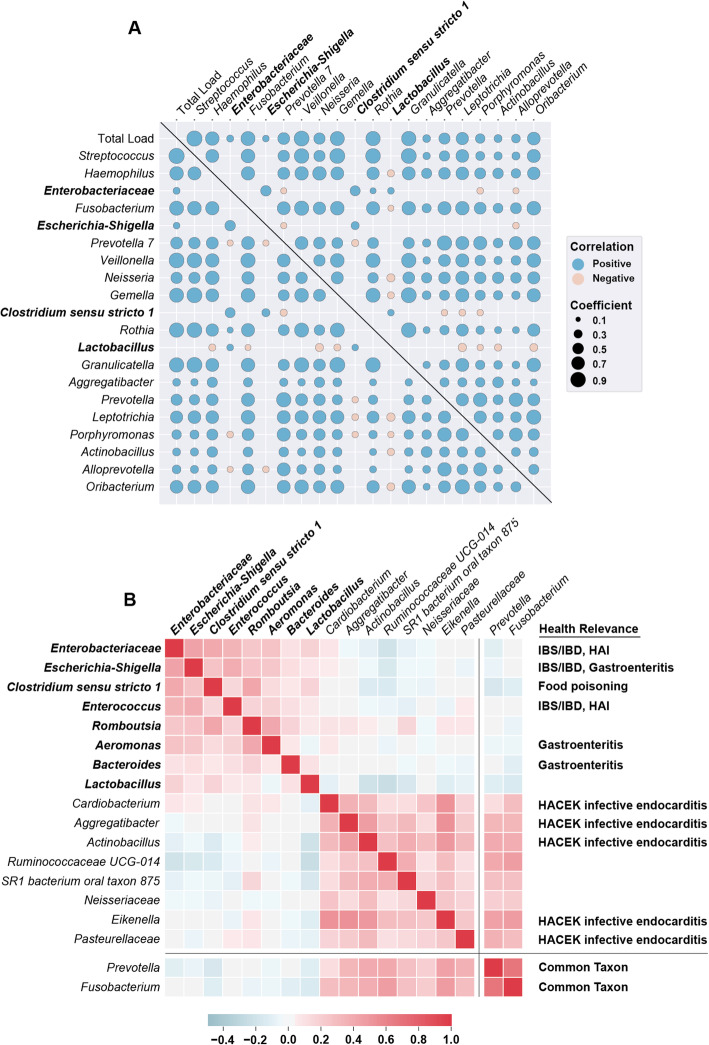
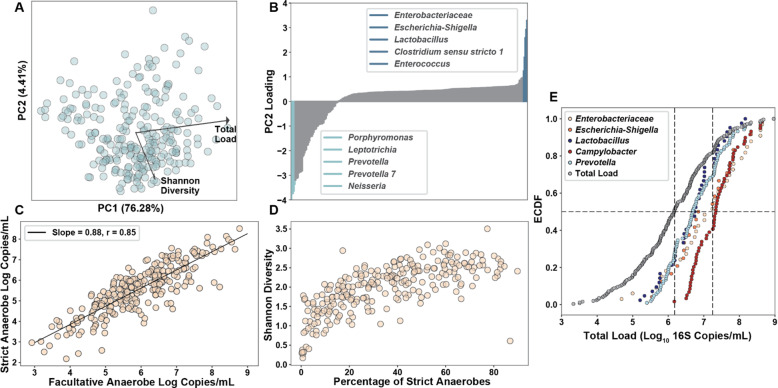
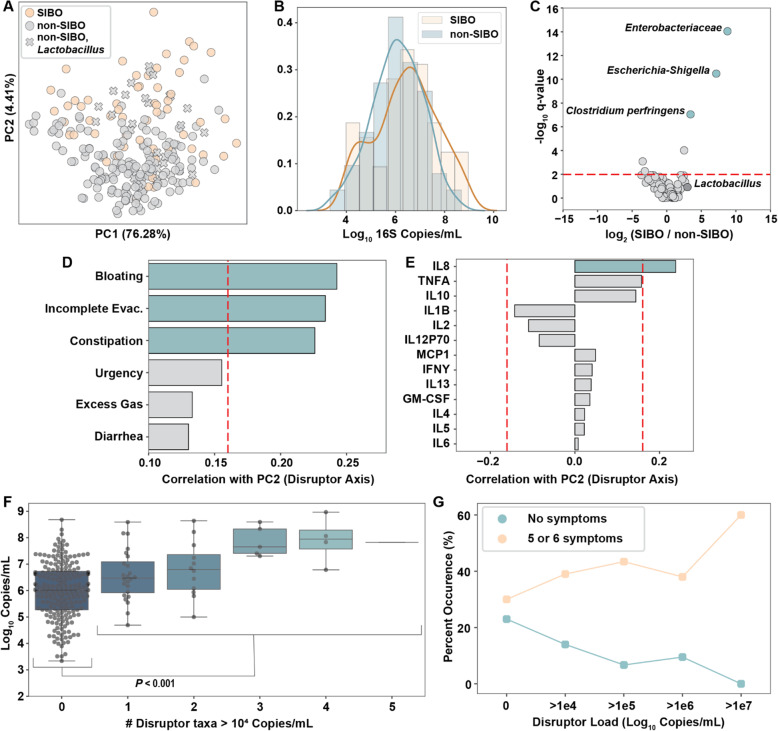
Results: Using quantitative sequencing, we evaluated total and taxon-specific absolute microbial loads from 250 duodenal-aspirate samples and 21 paired duodenum-saliva samples from participants in the REIMAGINE study. Log-transformed total microbial loads spanned 5 logs and were normally distributed. Paired saliva-duodenum samples suggested potential transmission of oral microbes to the duodenum, including organisms from the HACEK group. Several taxa, including Klebsiella, Escherichia, Enterococcus, and Clostridium, seemed to displace strict anaerobes common in the duodenum, so we refer to these taxa as disruptors. Disruptor taxa were enriched in samples with high total microbial loads and in individuals with small intestinal bacterial overgrowth (SIBO). Absolute loads of disruptors were associated with more severe GI symptoms, highlighting the value of absolute taxon quantification when studying small-intestine health and function.

Conclusion: This study provides the largest dataset of the absolute abundance of microbiota from the human duodenum to date. The results reveal a clear relationship between the oral microbiota and the duodenal microbiota and suggest an association between the absolute abundance of disruptor taxa, SIBO, and the prevalence of severe GI symptoms. Video Abstract.

Keywords: Bloating; Constipation; Duodenum; Enterobacteriaceae; HACEK; Human small intestinal microbiome; IBS; Lactobacillus; SIBO; Saliva.


Conflict of interest statement

The quantitative sequencing technology described in this publication is the subject of a patent application filed by Caltech. R.F.I. receives patent royalties from Bio-Rad related to droplet digital PCR.

Figures

Fig. 1
Fig. 1
Microbial load distribution across 250 human duodenal aspirate samples. A Histogram of the total microbial load in 250 duodenal aspirate samples overlaid with a kernel-density estimate. B Quantile-quantile plot comparing the sample distribution of the log10-transformed total microbial load in duodenal aspirate samples to a normal distribution. C Kernel-density estimate plots showing the absolute abundance distribution for the taxa with greater than 50% prevalence in duodenal aspirates. Prevalence (defined as a taxon’s frequency of occurrence in our dataset) and number of samples with each genus are labeled next to the distribution. A legend indicates strict anaerobes (red line through O2) and the location each genus is commonly found (saliva and/or stool) [30, 31]. Classification of taxa as common in stool or saliva was determined by prevalence of ≥ 50% (stool data are not included in this study) in the 16 participants for whom we had paired samples
Fig. 2
Fig. 2
Relationship between saliva and duodenal aspirate microbiomes. A Total microbial load of 21 paired duodenal aspirate and saliva samples. B No significant correlation between the total microbial load of 21 paired duodenal aspirate and saliva samples. C Percentage of taxa in duodenal aspirate samples also present in paired (same patient) vs the average of all non-paired saliva samples (Kruskal-Wallis, P < 0.001). D Volcano plot showing the ratio of relative abundances of species in duodenum vs saliva samples. The red dashed line indicates a significance threshold at q = 0.1 (Kruskal-Wallis with Benjamini-Hochberg correction). Undefined Streptococcus sp. classified as S. pneumoniae with 80% confidence and one base pair mismatch to common Streptococcus taxon found in all samples
Fig. 3
Fig. 3
Co-correlations reveal which taxa co-occur in high abundance and which can be considered disruptor taxa. A Co-correlation matrix of the top 20 most abundant genera and total microbial load. Only significant correlations (q < 0.1, Benjamini–Hochberg correction) are shown. Color of each marker is determined by the sign of the Spearman’s correlation coefficient and size of each marker is determined by the magnitude of the coefficient. Disruptor taxa labels are bolded. B Clustered co-correlation matrix of the top 16 genera ranked by the difference between their maximum abundance and mean abundance. Two common genera in the dataset are shown at the bottom for reference. The color of each square indicates the Spearman correlation coefficient from negative (blue) to positive (red). Disruptor taxa labels are bolded. Taxa with known relevance to human health are indicated. Enterobacteriaceae and Escherichia-Shigella are unique sequence variants from the Enterobacteriaceae family but only Escherichia-Shigella could be classified at the genus level. HAI=hospital acquired infection; IBS, irritable bowel syndrome; IBD, inflammatory bowel disease; HACEK, Haemophilus, Aggregatibacter, Cardiobacterium, Eikenella, Kingella
Fig. 4
Fig. 4
Strict anaerobes and disruptor taxa control diversity. A PCA plot of absolute microbial abundances at the genus level with the top two correlated metadata variables overlaid. B Feature loadings for principal component 2. Top five value-ranked genera in each direction (positive and negative) are highlighted and labeled. C Correlation between the strict anaerobic microbial load and facultative anaerobic microbial load. D Relationship between the percentage abundance of strict anaerobes and Shannon diversity index. E Empiric cumulative distribution function (ECDF) plot for Enterobacteriaceae (N = 33), Escherichia-Shigella (N = 24), Campylobacter (N = 59), Lactobacillus (N = 42), and the common taxa Prevotella (N = 104)
Fig. 5
Fig. 5
Disruptor species are dominant in SIBO samples and correlate with GI symptoms and the inflammatory cytokine IL8. A Principal component analysis (PCA) of absolute microbial abundances at the genus level. Colors indicate non-SIBO (grey) or SIBO (orange) participants as determined by culture. “X” markers indicate samples from non-SIBO participants that contained Lactobacillus. The PC1 axis correlates with total load and the PC2 axis correlates with the abundance of disruptor taxa. B Histogram with overlaid kernel-density estimate of the total microbial loads in samples from SIBO and non-SIBO participants. C Volcano plot indicating the taxa that differed between SIBO and non-SIBO samples. The red dashed line indicates the significance threshold at q = 0.01. D Correlation between PC2 (disruptor axis) and patient-reported symptom scores (on a 0–100 scale). The red dashed line represents significance threshold at q = 0.05. E Correlation between PC2 and patient serum cytokine levels. The red dashed lines represent the significance thresholds at q = 0.05. F Boxplot indicating increasing average total microbial load with increasing number of disruptor taxa with loads greater than 104 rRNA gene copies/mL (not including Lactobacillus). A significant difference between total load in samples with zero disruptor taxa and total load in samples with at least 1 disruptor taxa was observed (P < 0.001). G Percentage of samples from patients with either 0 symptoms or 5–6 symptoms (out of 6 categories) for individuals with varying loads of disruptor taxa (not including Lactobacillus)

References

    1. Donaldson GP, Lee SM, Mazmanian SK. Gut biogeography of the bacterial microbiota. Nat Rev Microbiol. 2016;14(1):20–32. doi: 10.1038/nrmicro3552. - DOI - PMC - PubMed
    1. Yasuda K, Oh K, Ren B, Tickle TL, Franzosa EA, Wachtman LM, Miller AD, Westmoreland SV, Mansfield KG, Vallender EJ, Miller GM, Rowlett JK, Gevers D, Huttenhower C, Morgan XC. Biogeography of the intestinal mucosal and lumenal microbiome in the rhesus macaque. Cell Host Microbe. 2015;17(3):385–391. doi: 10.1016/j.chom.2015.01.015. - DOI - PMC - PubMed
    1. Leite GGS, Weitsman S, Parodi G, Celly S, Sedighi R, Sanchez M, Morales W, Villanueva-Millan MJ, Barlow GM, Mathur R, Lo SK, Jamil LH, Paski S, Rezaie A, Pimentel M. Mapping the segmental microbiomes in the human small bowel in comparison with stool: a REIMAGINE study. Dig Dis Sci. 2020;65(9):2595–2604. doi: 10.1007/s10620-020-06173-x. - DOI - PMC - PubMed
    1. Johansson MEV, Sjövall H, Hansson GC. The gastrointestinal mucus system in health and disease. Nat Rev Gastroenterol Hepatol. 2013;10(6):352–361. doi: 10.1038/nrgastro.2013.35. - DOI - PMC - PubMed
    1. Ko H-J, Chang S-Y. Regulation of intestinal immune system by dendritic cells. Immune Netw. 2015;15(1):1–8. doi: 10.4110/in.2015.15.1.1. - DOI - PMC - PubMed

Publication types

LinkOut - more resources