Clinical Trial
. 2022 Jan;33(1):121-137.
doi: 10.1681/ASN.2020121753. Epub 2021 Nov 1.

mTOR Inhibitors Prevent CMV Infection through the Restoration of Functional αβ and γδ T cells in Kidney Transplantation

Affiliations
Clinical Trial

mTOR Inhibitors Prevent CMV Infection through the Restoration of Functional αβ and γδ T cells in Kidney Transplantation

Hannah Kaminski et al. J Am Soc Nephrol. 2022 Jan.

Abstract

Background: The reported association of mTOR-inhibitor (mTORi) treatment with a lower incidence of cytomegalovirus (CMV) infection in kidney transplant recipients (KTR) who are CMV seropositive (R+) remains unexplained.

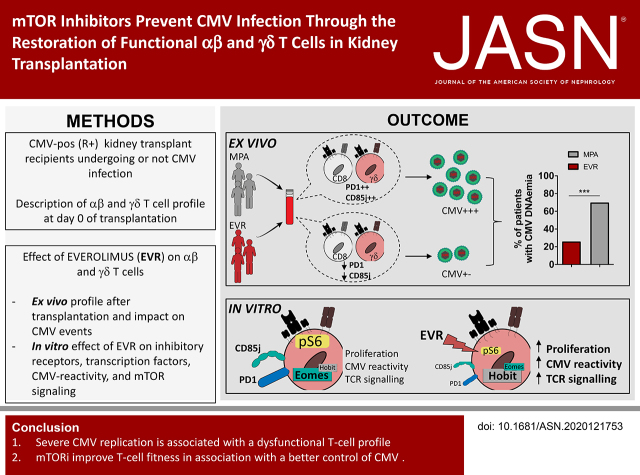
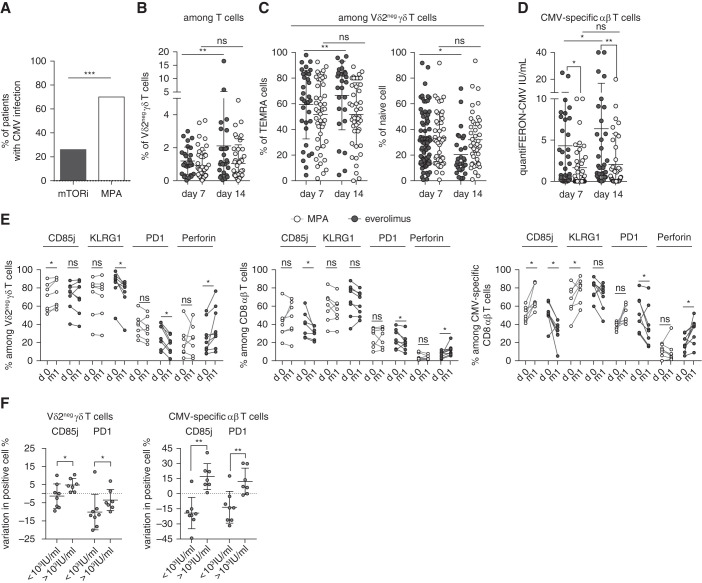
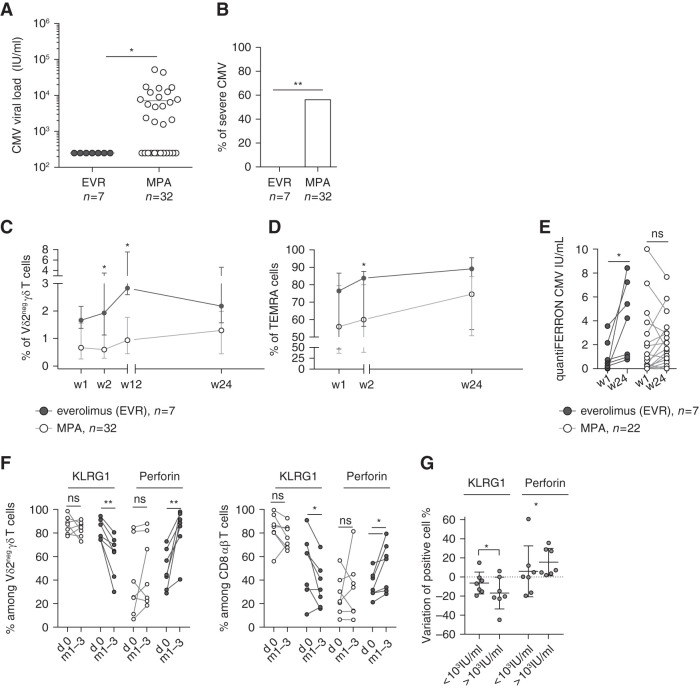
Methods: The incidence of CMV infection and T-cell profile was compared between KTRs treated with mTORis and mycophenolic acid (MPA), and in vitro mTORi effects on T-cell phenotype and functions were analyzed.

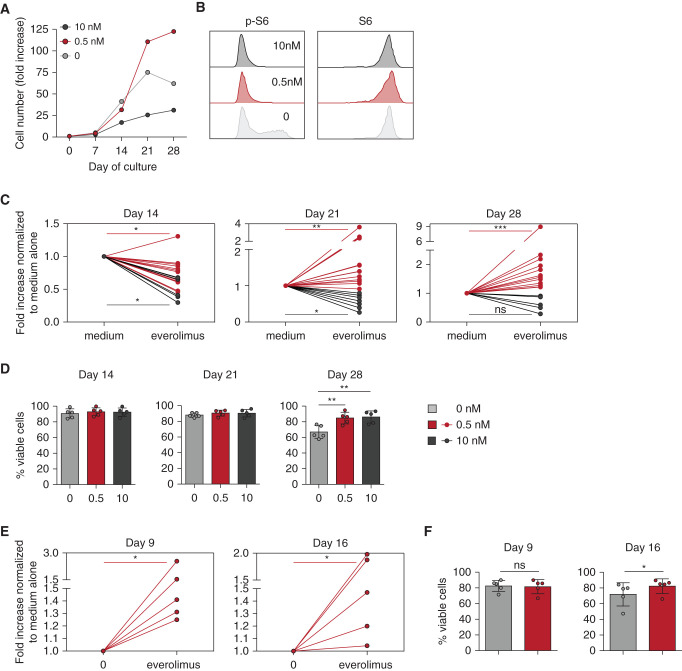
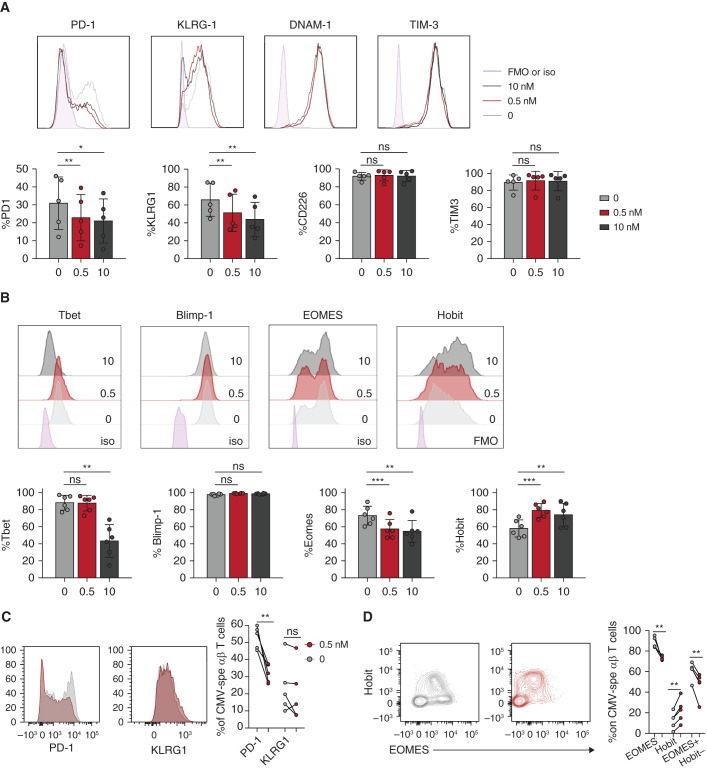
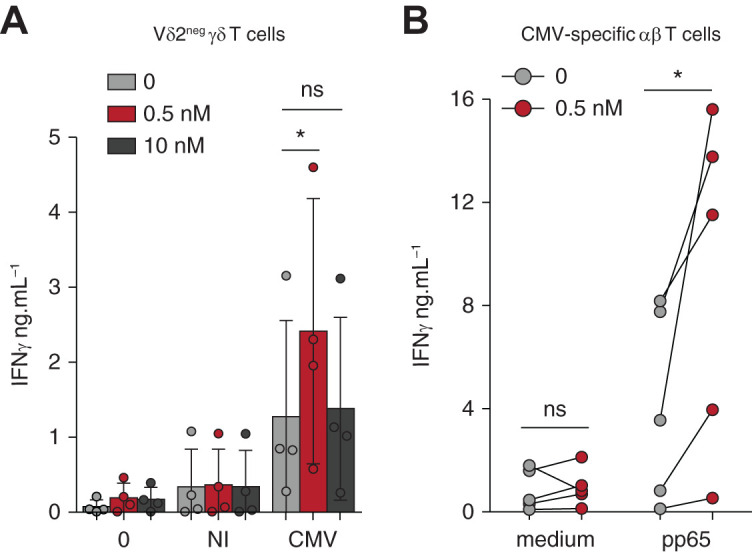
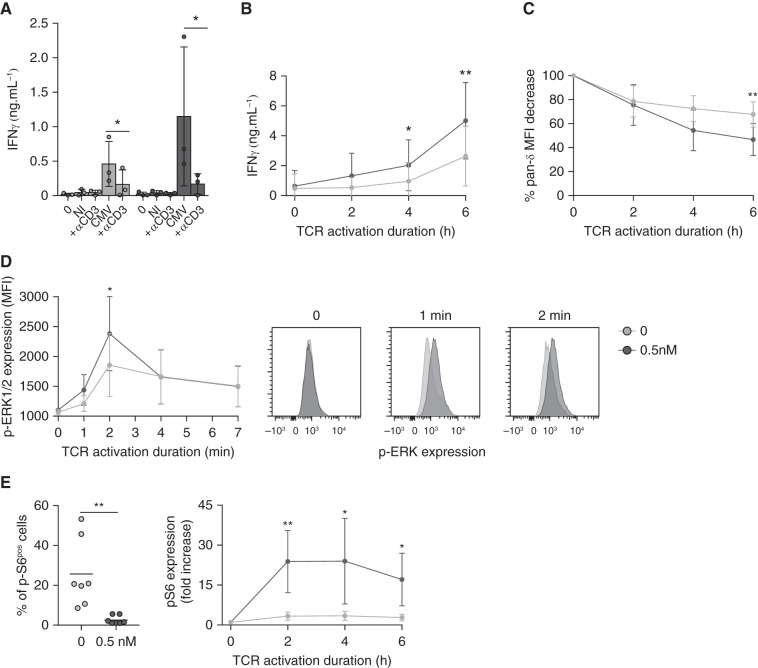
Results: In KTRs who were R+ and treated with MPA, both αβ and γδ T cells displayed a more dysfunctional phenotype (PD-1+, CD85j+) at day 0 of transplantation in the 16 KTRs with severe CMV infection, as compared with the 17 KTRs without or with spontaneously resolving CMV infection. In patients treated with mTORis (n=27), the proportion of PD-1+ and CD85j+ αβ and γδ T cells decreased, when compared with patients treated with MPA (n=44), as did the frequency and severity of CMV infections. mTORi treatment also led to higher proportions of late-differentiated and cytotoxic γδ T cells and IFNγ-producing and cytotoxic αβ T cells. In vitro, mTORis increased proliferation, viability, and CMV-induced IFNγ production of T cells and decreased PD-1 and CD85j expression in T cells, which shifted the T cells to a more efficient EOMESlow Hobithigh profile. In γδ T cells, the mTORi effect was related to increased TCR signaling.

Conclusion: Severe CMV replication is associated with a dysfunctional T-cell profile and mTORis improve T-cell fitness along with better control of CMV. A dysfunctional T-cell phenotype could serve as a new biomarker to predict post-transplantation infection and to stratify patients who should benefit from mTORi treatment.

Clinical trial registry name and registration number: Proportion of CMV Seropositive Kidney Transplant Recipients Who Will Develop a CMV Infection When Treated With an Immunosuppressive Regimen Including Everolimus and Reduced Dose of Cyclosporine Versus an Immunosuppressive Regimen With Mycophenolic Acid and Standard Dose of Cyclosporine A (EVERCMV), NCT02328963.

Keywords: CMV; CMV-specific immunity; kidney transplantation; mTOR inhibitors.


Figures

None
Graphical abstract
Figure 1.
Figure 1.
Vδ2neg γδ T cells and CD8+ T cells express inhibitory receptors at baseline in patients with severe CMV infections. Vδ2neg γδ T cells and total CD8+ T cells were analyzed for (A) their expression of CD27 and CD45RA and (B) their costimulatory and coinhibitory receptors, in (A and B) all patients who were R+ and treated with MPA (n=21) and (C) by separating patients with well-controlled CMV (n=12) versus patients severe CMV (n=9). (D) Finally, phenotypes were extended to CMV-specific CD8+ T cells in an internal validation cohort of patients with well-controlled CMV (n=5) versus patients with severe CMV (n=7). Each symbol represents an individual donor; large horizontal lines indicate the mean and small horizontal lines indicate the SD. *P<0.05, **P<0.01, ***P<0.001, ****P<0.0001 as determined by the Mann–Whitney U test.
Figure 2.
Figure 2.
High percentage of functional T cells in patients treated with mTORis correlated with a lower incidence of CMV infection. (A) Incidence of CMV DNAemia in 27 patients treated with mTORis and in 44 patients treated with MPA at month 12 post-transplantation. (B and C) Whole blood staining of Vδ2neg γδ T cells and their expression of CD27 and CD45RA. Frequencies of Vδ2neg γδ T cells among (B) T cells, and (C) of TEMRA (CD27neg CD45RA+) and naive (CD27hi CD45RA+) cells among Vδ2neg γδ T cells at day 7 and 14 post-transplantation (n=27 EVR, n=44 MPA). Each symbol represents an individual donor; large horizontal lines indicate the mean and small horizontal lines indicate the SD. (D) CMV-specific αβ T cells were analyzed with QuantiFERON-CMV (IU/mL) at day 7 (n=27 EVR, n=41 MPA) and 14 post-transplantation (n=27 EVR, n=43 MPA). Each symbol represents an individual donor; large horizontal lines indicate the mean and small horizontal lines indicate the SD. (E) Proportions among Vδ2neg γδ T cells (left); among total CD8+ T cells (middle); and CMV-specific CD8+ T cells (right) of CD85j+, perforin+, KLRG1+, and PD-1+ cells, compared between day 0 (d0) and month 1 (m1) post-transplantation in patients treated with mTORis (n=8) and MPA (n=7). Each symbol represents an individual donor. (F) Difference of CD85j and PD-1+ cell percentages between month 1 and day 0 (value m1 minus value day 0) was calculated and compared in patient groups with a post-transplantation CMV viral load >1000 or <1000 IU/ml (including 0 IU/ml). *P<0.05, **P<0.01, ***P<0.001, as determined for all unpaired data by the Mann–Whitney U test and for paired data by Wilcoxon test.
Figure 3.
Figure 3.
Better response of T cells in patients treated with mTORis than in those treated with MPA correlated with a lower severity of CMV infection. (A) Maximal CMV viral load (IU/ml) in patients treatd with mTORis (n=7) and MPA (n=32). Each symbol represents the CMV viral load value for an individual patient; large horizontal lines indicate the mean. (B) Proportion of patients treated with MPA (n=38) and mTORis (n=7) who experienced CMV DNAemia. *P<0.05, as determined by the Fisher exact test. (C and D) Whole blood staining of Vδ2neg γδ T cells and their expression of CD27 and CD45RA. Proportion of (C) Vδ2neg γδ T cells among T cells and of (D) TEMRA (CD27neg CD45RA+) among Vδ2neg γδ T cells at week 1, 2, 12, and 24 post-transplantation in patients treated with mTORis (n=7) and MPA (n=32). Each symbol represents the median (interquartile range) value for each group of patients. (E) QuantiFERON-CMV (IU/ml) at week 1 and week 24 in patients treated with mTORis (n=7) and MPA (n=22) who experienced CMV DNAemia post-transplantation. Each symbol represents an individual donor. (F) Proportions among Vδ2neg γδ T cells (left) and among total CD8+ T cells (right) of perforin+ and KLRG1+ cells, compared between day 0 and during CMV DNAemia (either month 1 or month 3) in patients treated with mTORis (n=7) and MPA (n=7). Each symbol represents an individual donor. (G) Difference of KLRG1 and perforin+ Vδ2neg γδ T-cell percentages between month 1 and day 0 were calculated and compared in patient groups with a post-transplantation CMV viral load ≥1000 IU/ml. *P<0.05, **P<0.01, as determined for paired data by the Wilcoxon test and for unpaired data by Mann–Whitney U test.
Figure 4.
Figure 4.
Long-term in vitro mTORi treatment improves proliferation and viability of Vδ2neg γδ T cells and CMV-specific αβ T cells. PBMCs from KTRs who were R+ were incubated with IL-2, with or without IL-15, for Vδ2neg γδ T cells, and IL-2 alone for CMV-specific αβ T cells, and with the indicated doses of EVR. Proliferation and viability of Vδ2neg γδ T cells at day 14, 21, and 28 of culture and of CMV-specific αβ T cells at day 9 and 16 of culture were performed. (A) Representative donor for proliferation of Vδ2neg γδ T cells. (B) Representative flow cytometry staining of S6 and phospho-S6 (p-S6) among Vδ2neg γδ T cells at day 14 of culture. (C) Proliferation of Vδ2neg γδ T cells, represented as fold increases normalized to culture with medium alone, at day 14 (0.5 nM EVR, n=13; 10 nM EVR, n=6), 21 (0.5 nM EVR, n=15; 10 nM EVR, n=8), and 28 (0.5 nM EVR, n=12; 10 nM EVR, n=6). (D) Vδ2neg γδ T-cell viability tested by flow cytometry live-dead staining (n=5). (E) Proliferation of CMV-specific αβ T cells, represented as fold increases normalized to culture with medium alone (0.5 nM EVR, n=5). (F) Viability of CMV-specific αβ T cells tested by flow cytometry live-dead staining (n=5). For (C), (D), (E), and (F), each symbol represents an individual donor. *P<0.05, **P<0.01, ***P<0.001, as determined by Wilcoxon test.
Figure 5.
Figure 5.
Low-dose mTORi improves the functional profile of Vδ2neg γδ T cells and CMV-specific αβ T cells. Vδ2neg γδ T cells (after 21 days) and CMV-specific αβ T cells (after 16 days) were analyzed after in vitro culture, with or without EVR, of PBMCs from KTRs who were R+. Frequencies of (A) PD-1, KLRG1, DNAM-1, and TIM-3; and (B) Tbet, Blimp-1, EOMES, and Hobit among Vδ2neg γδ T cells for one representative donor (top) and for five donors (bottom). Frequencies of (C) PD-1 and KLRG1 and of (D) EOMES and Hobit among CMV-specific αβ T cells for one representative donor (left) and five donors (right). Each symbol represents an individual donor. *P<0.05, **P<0.01, as determined by the Wilcoxon test. FMO, fluorescence minus one; iso, control isotype.
Figure 6.
Figure 6.
Low-dose mTORi improves the response of Vδ2neg γδ T cells and CMV-specific αβ T cells to CMV. (A) Vδ2neg γδ T cells were purified and cultured in medium alone or with NI or CMV-infected fibroblasts for 24 hours, and ELISA for IFNγ was performed (n=4 donors). (B) PBMCs, from donors who were R+, were cultured for 7 days and then maintained in medium alone or stimulated with 0.6 nmol/L of pp65 PepTivator for 24 hours, and ELISA for IFNγ was performed (n=5). Each symbol represents an individual donor and, in (A), large horizontal lines indicate the mean and small horizontal lines indicate the SD. *P<0.05, **P<0.01, as determined by the Wilcoxon test.
Figure 7.
Figure 7.
TCR engagement and signaling of Vδ2neg γδ T cells are improved by mTORi. (A) Vδ2neg γδ T cells were purified and cultured in medium alone, with NI or CMV-infected fibroblasts, with or without a blocking anti-CD3 mAb (10 µg/ml) for 24 hours, and ELISA for IFNγ was performed (n=4 donors). (B) Vδ2neg γδ T cells among the total PBMCs were specifically stimulated via their TCR by an anti-Vδ1 mAb (10 µg/ml), for 2, 4, and 6 hours, and then ELISA for IFNγ was performed, and (C) cells were stained for γδ TCR downregulation analysis by flow cytometry (n=4 donors). (D) Vδ2neg γδ T cells were purified and stimulated with an anti-CD3 antibody (UCHT1, 10 µg/ml) for 0, 1, 2, 4, and 7 minutes. Erk 1/2 phosphorylation was measured by flow cytometry (one representative donor, right; in four donors, left). (E) Vδ2neg γδ T cells among the total PBMCs were specifically stimulated via their TCR by an anti-Vδ1 mAb (10 µg/ml) for 2, 4, and 6 hours, and S6 phosphorylation was measured by flow cytometry. Basal levels before stimulation are represented for seven donors (left), and activation kinetics normalized to the basal level for each condition (0 and 0.5 nM EVR) (right) for four donors are represented. Each symbol represents an individual donor, large horizontal lines indicate the mean and small horizontal lines indicate the SD in (A) and (E, left). Each symbol represents the median of the results for four donors, and the small horizontal lines represent the ranges in (B), (C), (D), and (E, right). *P<0.05, **P<0.01, as determined by the Wilcoxon test.

Comment in

References

    1. Kotton CN, Kumar D, Caliendo AM, Huprikar S, Chou S, Danziger-Isakov L, et al. ; The Transplantation Society International CMV Consensus Group : The Third International Consensus Guidelines on the Management of Cytomegalovirus in Solid-organ Transplantation. Transplantation 102: 900–931, 2018 - PubMed
    1. Zuhair M, Smit GSA, Wallis G, Jabbar F, Smith C, Devleesschauwer B, et al. : Estimation of the worldwide seroprevalence of cytomegalovirus: A systematic review and meta-analysis. Rev Med Virol 29: e2034, 2019 - PubMed
    1. Jarque M, Crespo E, Melilli E, Gutiérrez A, Moreso F, Guirado L, et al. : Cellular immunity to predict the risk of cytomegalovirus infection in kidney transplantation: A prospective, interventional, multicenter clinical trial. Clin Infect Dis 71: 2375–2385, 2020 - PubMed
    1. Kaminski H, Jarque M, Halfon M, Taton B, Di Ascia L, Pfirmann P, et al. : Different impact of rATG induction on CMV infection risk in D+R- and R+ KTRs. J Infect Dis 220: 761–771, 2019 - PubMed
    1. Appay V, van Lier RAW, Sallusto F, Roederer M: Phenotype and function of human T lymphocyte subsets: consensus and issues. Cytometry A 73: 975–983, 2008 - PubMed

Publication types

MeSH terms

Associated data