. 2021 Nov 9;118(45):e2101695118.
doi: 10.1073/pnas.2101695118.

Growth and thermal maturation of the Toba magma reservoir

Affiliations

Growth and thermal maturation of the Toba magma reservoir

Ping-Ping Liu et al. Proc Natl Acad Sci U S A. .

Abstract

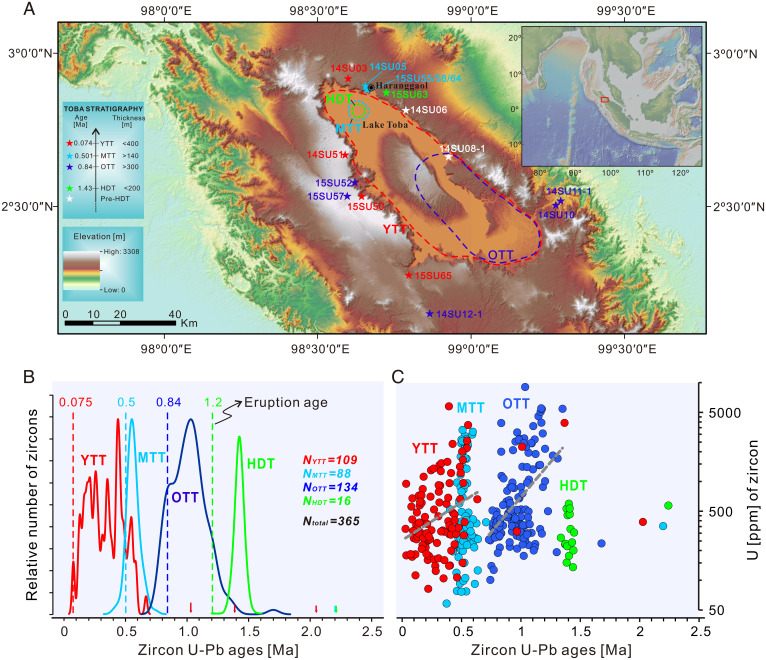
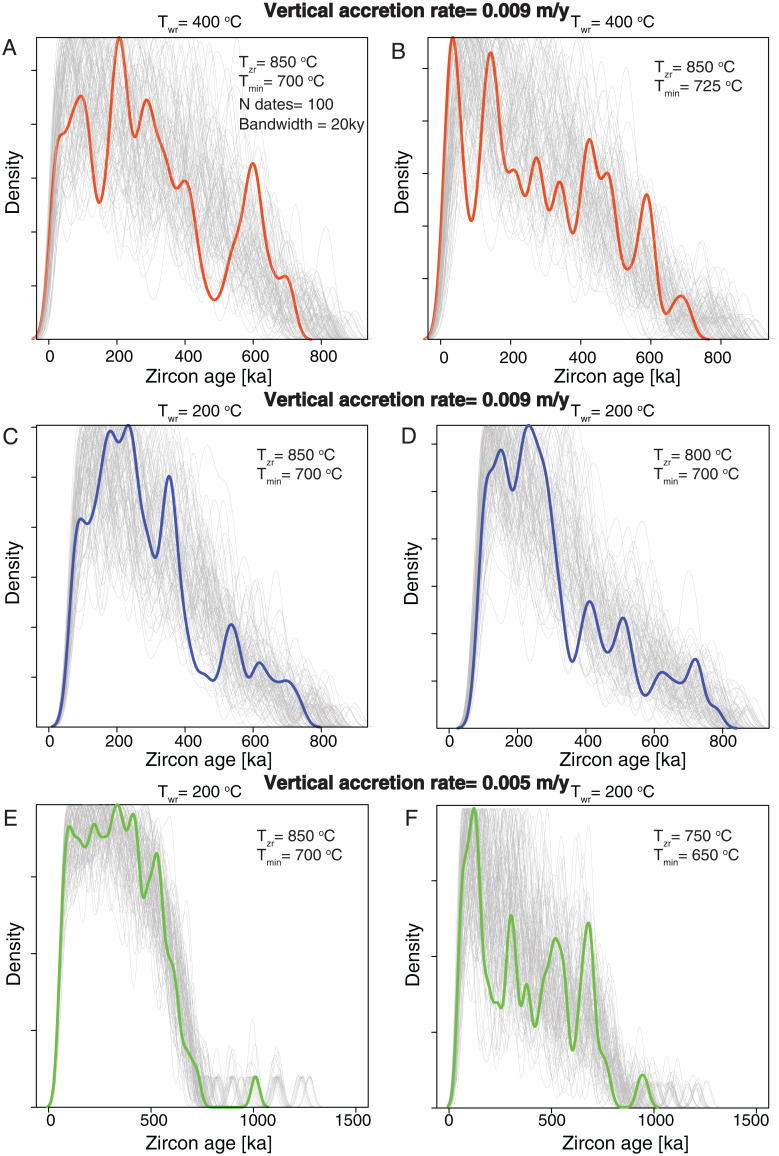
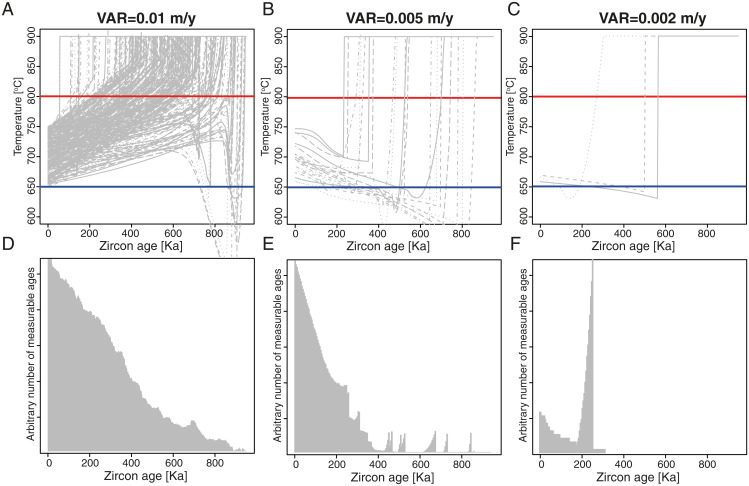
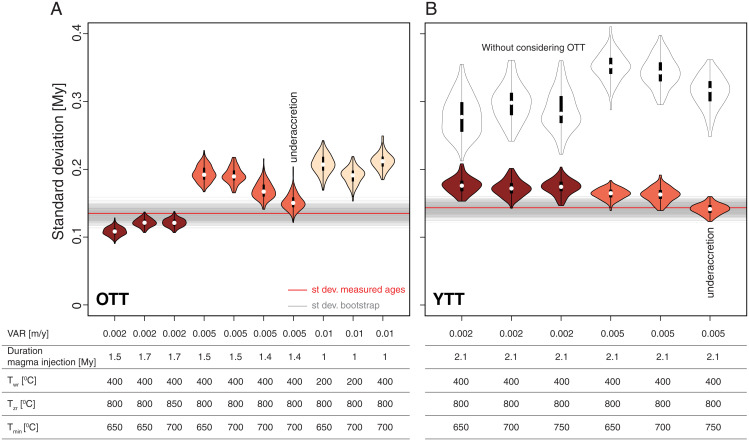
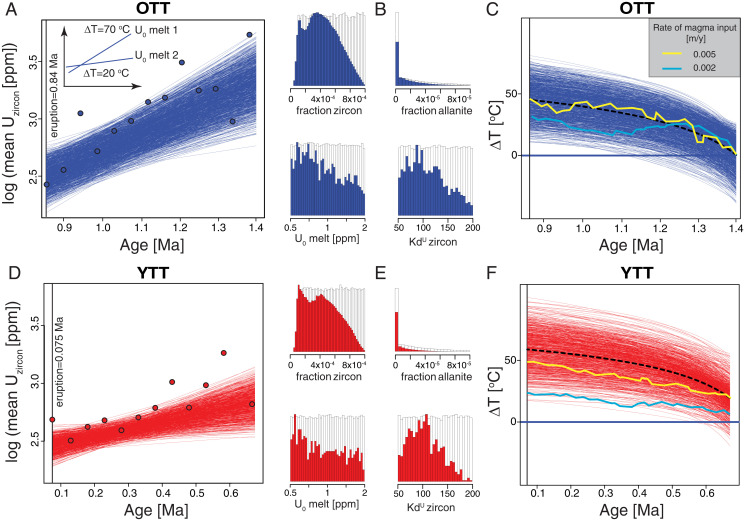
The Toba volcanic system in Indonesia has produced two of the largest eruptions (>2,000 km3 dense-rock equivalent [DRE] each) on Earth since the Quaternary. U-Pb crystallization ages of zircon span a period of ∼600 ky before each eruptive event, and in the run-up to each eruption, the mean and variance of the zircons' U content decrease. To quantify the process of accumulation of eruptible magma underneath the Toba caldera, we integrated these observations with thermal and geochemical modeling. We show that caldera-forming eruptions at Toba are the result of progressive thermal maturation of the upper crustal magma reservoir, which grows and chemically homogenizes, by sustained magma influx at average volumetric rates between 0.008 and 0.01 km3/y over the past 2.2 My. Protracted thermal pulses related to magma-recharge events prime the system for eruption without necessarily requiring an increased magma-recharge rate before the two supereruptions. If the rate of magma input was maintained since the last supereruption of Toba at 75 ka, eruptible magma is currently accumulating at a minimum rate of ∼4.2 km3 per millennium, and the current estimate of the total volume of potentially eruptible magma available today is a minimum of ∼315 km3 Our approach to evaluate magma flux and the rate of eruptible magma accumulation is applicable to other volcanic systems capable of producing supereruptions and thereby could help in assessing the potential of active volcanic systems to feed supereruptions.

Keywords: Toba caldera; eruptible magma; supereruption; thermal modeling; zircon.


Conflict of interest statement

The authors declare no competing interest.

Figures

Fig. 1.
Fig. 1.
Topographic map of the Toba caldera, along with age-distribution spectrum and U content of zircons from the four eruptions of Toba. (A) Approximate source-caldera areas of the HDT, OTT, MTT, and YTT are outlined (15). Stars represent the sampling locations. (Inset) The location of the Toba caldera in northern Sumatra, Indonesia. (B) Zircon age distributions for the HDT, OTT, MTT, and YTT. The colored arrows pointing to the x axis indicate zircons with older ages in respective eruptions. We present the density of the natural ages with a bandwidth equal to 1σ analytical error. Eruption ages (Ma) and number of zircon (N) analyzed in each eruption are also specified. (C) Variation of U content of zircons as a function of age for each eruption. Gray dotted lines represent the mean trend of zircon U contents of the OTT and YTT eruptions with age.
Fig. 2.
Fig. 2.
Distribution of zircon crystallization ages for different rates of magma input (VAR), temperature of the wall rocks (Twr), and temperature range of zircon saturation and eruption (Tzr, temperature of zircon saturation; Tmin, minimum temperature of eruption). (A–F) The gray lines are bootstrapped distributions obtained by subsampling the synthetic populations of zircon crystallization 100 times with a probability proportional to the number of calculated measurable crystallization times. The thick colored lines show an example of a distribution. Note the different scales of E and F. The peaks in crystallization times are randomly distributed and do not have a geological meaning.
Fig. 3.
Fig. 3.
Relationships between rate of magma input and distribution of zircon ages. (AC) Each gray line shows the evolution of temperature for one of the passive tracers injected throughout the modeled period. The red line at 800 °C is the zircon-saturation temperature, and the blue line at 650 °C is the minimum temperature of zircons that are eruptible (in this case, we consider equal to the solidus temperature for simplicity). (DF) Distribution of measurable zircon ages (no assumption on the location of age in a single zircon) for the simulation presented in AC, respectively.
Fig. 4.
Fig. 4.
Summary of the thermal modeling results for zircon crystallization. (A–B) The red line is the SD (st. dev.) of zircon ages for the natural OTT and YTT samples. The gray lines are SDs for the bootstrapped zircon age distributions. The violin plots present the distributions of SDs for 1,000 samples from a larger population, for the same number of measurements collected for the OTT (n = 134) and the YTT (n = 109). The colors of the violins relate to the VAR used in the model. The white violin plots show the results obtained without considering the removal of zircons by the OTT eruption. Each of the violin plots shows the results of models performed for different scenarios, as specified at the bottom of the figure. The best-fit models are considered those for which the violin plot overlaps with the gray lines.
Fig. 5.
Fig. 5.
Summary of the modeling results of the U content in zircon. (A) The circles show the mean U content of zircons as a function of age (binned for 50-ky range) for the OTT (blue). The blue lines show the best-matching simulations. (Inset) The impact of different total increase of temperature (ΔT) and initial U content of the melt from which zircons crystallize (U0), on the slope and intercept of the calculated lines in the semilog plot. (B) The white histograms show the distributions of the simulated range for each of the relevant parameters of the models, and the blue histograms show the distributions for the best-matching simulations. (C) The blue lines show the evolution of relative temperature as a function of zircon ages for the best-matching simulations shown in A. The dashed black line is the mean temperature increase for the best-matching simulations. The yellow and cyan lines show the evolution of relative temperature for VARs of 0.005 and 0.002 m/y, respectively. (DF) Same as AC, but for the YTT eruption.

References

    1. Newhall C. G., Self S., The volcanic explosivity index (VEI) an estimate of explosive magnitude for historical volcanism. J. Geophys. Res. Oceans 87, 1231–1238 (1982).
    1. Self S., The effects and consequences of very large explosive volcanic eruptions. Philos. Trans.- Royal Soc., Math. Phys. Eng. Sci. 364, 2073–2097 (2006). - PubMed
    1. de Silva S., Arc magmatism, calderas, and supervolcanoes. Geology 36, 671–672 (2008).
    1. Jaxybulatov K., et al. ., Volcanology. A large magmatic sill complex beneath the Toba caldera. Science 346, 617–619 (2014). - PubMed
    1. Shapiro N. M., Koulakov I., Geophysics. Probing the underbelly of a supervolcano. Science 348, 758–759 (2015). - PubMed

Publication types

LinkOut - more resources