. 2021 Nov 9;118(45):e2105323118.
doi: 10.1073/pnas.2105323118.

Dendritic cell paucity in mismatch repair-proficient colorectal cancer liver metastases limits immune checkpoint blockade efficacy

Affiliations

Dendritic cell paucity in mismatch repair-proficient colorectal cancer liver metastases limits immune checkpoint blockade efficacy

William W Ho et al. Proc Natl Acad Sci U S A. .

Abstract

Liver metastasis is a major cause of mortality for patients with colorectal cancer (CRC). Mismatch repair-proficient (pMMR) CRCs make up about 95% of metastatic CRCs, and are unresponsive to immune checkpoint blockade (ICB) therapy. Here we show that mouse models of orthotopic pMMR CRC liver metastasis accurately recapitulate the inefficacy of ICB therapy in patients, whereas the same pMMR CRC tumors are sensitive to ICB therapy when grown subcutaneously. To reveal local, nonmalignant components that determine CRC sensitivity to treatment, we compared the microenvironments of pMMR CRC cells grown as liver metastases and subcutaneous tumors. We found a paucity of both activated T cells and dendritic cells in ICB-treated orthotopic liver metastases, when compared with their subcutaneous tumor counterparts. Furthermore, treatment with Feline McDonough sarcoma (FMS)-like tyrosine kinase 3 ligand (Flt3L) plus ICB therapy increased dendritic cell infiltration into pMMR CRC liver metastases and improved mouse survival. Lastly, we show that human CRC liver metastases and microsatellite stable (MSS) primary CRC have a similar paucity of T cells and dendritic cells. These studies indicate that orthotopic tumor models, but not subcutaneous models, should be used to guide human clinical trials. Our findings also posit dendritic cells as antitumor components that can increase the efficacy of immunotherapies against pMMR CRC.

Keywords: cancer immunotherapy; immune checkpoint blockade; mismatch repair–proficient colorectal cancer; orthotopic tumor model; tumor immune microenvironment.


Figures

Fig. 1.
Fig. 1.
Orthotopic liver metastasis mouse models of pMMR CRC recapitulate clinical inefficacy of ICB. (A) Number of coding somatic mutations per megabase (MB) DNA in mouse syngeneic CRC cell lines MC38, CT26, and SL4 compared with the median number in human dMMR and pMMR CRC. (B) Survival of mice bearing CT26 subcutaneous tumors (n = 10 per group) or SL4 subcutaneous tumors (n = 9 or 10 per group), untreated or treated with ICB therapy. ***P < 0.001 (log-rank test). (C) Tumor growth of mice bearing CT26 subcutaneous tumors (n = 10 per group) or SL4 subcutaneous tumors (n = 9 or 10 per group), untreated or treated with ICB. *P < 0.05 (two-tailed unpaired t test). (D) Survival of mice bearing CT26 liver metastases (n = 10 per group) or SL4 liver metastases (n = 10 per group), untreated or treated with ICB. n.s., not significant, P > 0.05 (log-rank test). (E) Tumor growth of mice bearing SL4 liver metastases (n = 10 per group), untreated or treated with ICB. n.s., P > 0.05 (two-tailed unpaired t test). There is no tumor growth curve for CT26 liver metastasis because the CT26 cell line used is not transfected with the GFP-Gluc construct. (BE) Experiments were repeated at least twice and representative graphs are shown. (F) Survival of mice bearing CT26 colon tumors (n = 11 per group) or SL4 colon tumors (n = 10 per group), untreated or treated with ICB. n.s., P > 0.05 (log-rank test). (G) Tumor growth of mice bearing CT26 colon tumors (n = 11 per group) or SL4 colon tumors (n = 10 per group), untreated or treated with ICB. n.s., P > 0.05 (two-tailed unpaired t test). Data are mean ± SEM. ICB: anti–PD1 (200 µg per mouse) plus anti–CTLA-4 (100 µg per mouse); i.v. injection, three doses with a 3-d interval between doses.
Fig. 2.
Fig. 2.
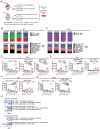
pMMR CRC liver metastases have significantly fewer activated T cells than subcutaneous tumor counterparts when treated with ICB therapy. (A) Schematic diagram illustrating the four groups analyzed by RNA-seq, flow cytometry, and qPCR. ICB: anti–PD1 (200 µg per mouse) plus anti–CTLA-4 (100 µg per mouse), i.v. injection, three doses with a 3-d interval between doses. Tumor tissue was collected 4 d after the third dose of ICB therapy. (B) Average overall cell composition (n = 6 to 8 per group) and immune cell composition (n = 5 to 8 per group) of SL4 liver metastases or subcutaneous tumors, untreated or ICB-treated, determined by flow cytometry. Figure data are combined from two separate experiments. (C) Average overall cell composition (n = 7 to 9 per group) and immune cell composition (n = 5 to 9 per group) of CT26 liver metastases or subcutaneous tumors, untreated or ICB-treated, determined by flow cytometry. There is no cancer cell composition in the overall cell composition because the CT26 cell line used is not transfected with the GFP-Gluc construct. Figure data are combined from two separate experiments. (D) Number of CD8+ T cells, granzyme B+ CD8+ T cells, and IFNγ+TNFα+ CD8+ T cells in CT26 liver metastases or subcutaneous tumors, untreated or ICB-treated (n = 5 to 8 per group). *P < 0.05, **P < 0.01 (one-way ANOVA with Tukey’s multiple-comparisons test). (E) Number of CD8+ T cells, granzyme B+ CD8+ T cells, and IFNγ+TNFα+ CD8+ T cells in SL4 liver metastases or subcutaneous tumors, untreated or ICB-treated (n = 3 to 10 per group). **P < 0.01, ***P < 0.001 (one-way ANOVA with Tukey’s multiple-comparisons test). Figure data are combined from two separate experiments. (F) Number of CD4+FOXP3 T cells and IFNγ+TNFα+ CD4+FOXP3 T cells in SL4 liver metastases or subcutaneous tumors, untreated or ICB-treated (n = 3 to 10 per group). ***P < 0.001, ****P < 0.0001 (one-way ANOVA with Tukey’s multiple-comparisons test). Figure data are combined from two separate experiments. (G) Number of CD4+FOXP3 T cells and IFNγ+TNFα+ CD4+FOXP3 T cells in CT26 liver metastases or subcutaneous tumors, untreated or ICB-treated (n = 5 to 8 per group). *P < 0.05 (one-way ANOVA with Tukey’s multiple-comparisons test). (H) Significantly down-regulated CD8+ T cell– or CD4+ T cell–related pathways in SL4 liver metastases versus SL4 subcutaneous tumors, untreated or ICB-treated (n = 5 per group). *FDR < 0.05, **FDR < 0.01, ***FDR < 0.001 (GSEA); FDR, false discovery rate. Data are mean ± SEM. ICB treatment and tumor tissue collection schedule follows A. PID, Pathway Interaction Database; GO, Gene Ontology; NES, Normalized enrichment score.
Fig. 3.
Fig. 3.
pMMR CRC liver metastases have significantly fewer dendritic cells than subcutaneous tumor counterparts when treated with ICB therapy. (A) Number of total dendritic cells, CD103+CD11b dendritic cells, and CD103CD11b+ dendritic cells in CT26 liver metastases or subcutaneous tumors, untreated or ICB-treated (n = 7 to 9 per group). *P < 0.05, **P < 0.01 (one-way ANOVA with Tukey’s multiple-comparisons test). (B) Number of total dendritic cells, CD103+CD11b dendritic cells, and CD103CD11b+ dendritic cells in SL4 liver metastases or subcutaneous tumors, untreated or ICB-treated (n = 6 to 8 per group). *P < 0.05 (one-way ANOVA with Tukey’s multiple-comparisons test). (C) Number of total GFP+ dendritic cells, GFP+ CD103+CD11b dendritic cells, and GFP+ CD103CD11b+ dendritic cells in SL4-GFP liver metastases or subcutaneous tumors, untreated or ICB-treated (n = 6 to 8 per group). *P < 0.05, **P < 0.01 (one-way ANOVA with Tukey’s multiple-comparisons test). (D) Percentages of total dendritic cells, CD103+CD11b dendritic cells, and CD103CD11b+ dendritic cells that express GFP in SL4-GFP liver metastases or subcutaneous tumors, untreated or ICB-treated (n = 6 to 8 per group). *P < 0.05, **P < 0.01 (one-way ANOVA with Tukey’s multiple-comparisons test). (E) Number of total dendritic cells, CD103+CD11b dendritic cells, and CD103CD11b+ dendritic cells in tdLNs of SL4 liver metastases or subcutaneous tumors, untreated or ICB-treated (n = 6 to 8 per group). *P < 0.05 (one-way ANOVA with Tukey’s multiple-comparisons test). (F) Number of total GFP+ dendritic cells, GFP+ CD103+CD11b dendritic cells, and GFP+ CD103CD11b+ dendritic cells in tdLNs of SL4-GFP liver metastases or subcutaneous tumors, untreated or ICB-treated (n = 6 to 8 per group). *P < 0.05, **P < 0.01 (one-way ANOVA with Tukey’s multiple-comparisons test). (G) Significantly down-regulated dendritic cell–related pathways in SL4 liver metastases versus SL4 subcutaneous tumors, untreated or ICB-treated (n = 5 per group). *FDR < 0.05, **FDR < 0.01, ***FDR < 0.001, ****FDR < 0.0001 (GSEA). Data are mean ± SEM. ICB treatment and tumor tissue collection schedule follows Fig. 2A.
Fig. 4.
Fig. 4.
Flt3L treatment improves dendritic cell infiltration and sensitizes pMMR CRC liver metastases to ICB therapy. (A) Schematic illustrating Flt3L treatment in mice bearing SL4 liver metastases for B to E. Flt3L is given daily, i.p., at 30 µg per mouse. (B) Number of total dendritic cells, CD103+CD11b dendritic cells, and CD103CD11b+ dendritic cells in SL4 liver metastases, untreated or treated with ICB alone, Flt3L alone, or Flt3L plus ICB (n = 8 or 9 per group). ***P < 0.001, ****P < 0.0001 (two-tailed unpaired t test). (C) Number of total dendritic cells, CD103+CD11b dendritic cells, and CD103CD11b+ dendritic cells that express tumor-derived GFP in SL4-GFP liver metastases, untreated or treated with ICB alone, Flt3L alone, or Flt3L plus ICB (n = 8 or 9 per group). **P < 0.01, ****P < 0.0001 (two-tailed unpaired t test). (D) Number of total CD8+ T cells, granzyme B+ CD8+ T cells, and PD1+ CD8+ T cells in SL4 liver metastases, untreated or treated with ICB alone, Flt3L alone, or Flt3L plus ICB (n = 8 or 9 per group). **P < 0.01 (two-tailed unpaired t test). (E) Number of total CD4+FOXP3 T cells and PD1+ CD4+FOXP3 T cells in SL4 liver metastases, untreated or treated with ICB alone, Flt3L alone, or Flt3L plus ICB (n = 8 or 9 per group). **P < 0.01, ***P < 0.001 (two-tailed unpaired t test). (F) Survival of mice bearing SL4 liver metastases (n = 11 per group), untreated or treated with ICB alone, Flt3L alone, or Flt3L plus ICB. n.s., P > 0.05; *P < 0.01 (log-rank test). (G) Survival of mice bearing CT26 liver metastases (n = 11 or 12 per group), untreated or treated with ICB alone, Flt3L alone, or Flt3L plus ICB. **P < 0.01, ***P < 0.001 (log-rank test). Data are shown as mean ± SEM. ICB: anti–PD1 (200 µg per mouse) plus anti–CTLA-4 (100 µg/mouse); i.v. injection.
Fig. 5.
Fig. 5.
IFN-α treatment can improve dendritic cell infiltration and mouse survival. (A) Significantly down-regulated type I IFN-related pathways in SL4 liver metastases versus SL4 subcutaneous tumors, untreated or ICB-treated (n = 5 per group). *FDR < 0.05, **FDR < 0.01, ****FDR < 0.0001 (GSEA). (B) Number of total dendritic cells, CD103+CD11b dendritic cells, and CD103CD11b+ dendritic cells in SL4 liver metastases, untreated or treated with IFN-α (n = 7 or 8 per group). **P < 0.01 (two-tailed unpaired t test). (C) Number of total CD8+ T cells, granzyme B+ CD8+ T cells, and PD1+ CD8+ T cells in SL4 liver metastases, untreated or treated with IFN-α (n = 7 or 8 per group). *P < 0.05, **P < 0.01 (two-tailed unpaired t test). (D) Number of total CD4+FOXP3 T cells and PD1+ CD4+FOXP3 T cells in SL4 liver metastases, untreated or treated with IFN-α (n = 7 or 8 per group). n.s., P > 0.05 (two-tailed unpaired t test). (BD) IFN-α: 20,000 units daily, i.p., 11 d. Tumor tissue collection: day after last treatment. (E) Survival of mice bearing SL4 liver metastases (n = 8 or 9 per group), untreated or treated with ICB alone, IFN-α alone, or IFN-α plus ICB. n.s., P > 0.05; *P < 0.05, **P < 0.01, ***P < 0.001 (log-rank test). IFN-α: 20,000 units daily, i.p., on the indicated days. (F) Survival of mice bearing CT26 liver metastases (n = 8 to 11 per group), untreated or treated with ICB alone, IFN-α alone, or IFN-α plus ICB. n.s., P > 0.05; *P < 0.05, **P < 0.01 (log-rank test). IFN-α: 20,000 units daily, i.p., on the indicated days. Data are mean ± SEM. ICB: anti–PD-1 (200 µg per mouse) plus anti–CTLA-4 (100 µg per mouse); i.v. injection.
Fig. 6.
Fig. 6.
Radiation plus ICB therapy can improve dendritic cell infiltration and mouse survival. (A) Number of total dendritic cells, CD103+CD11b dendritic cells, and CD103−CD11b+ dendritic cells in CT26 liver metastases, untreated or treated with ICB alone, radiation alone, or radiation plus ICB (n = 7 to 15 per group). *P < 0.05, **P < 0.01, ***P < 0.001, ****P < 0.0001 (one-way ANOVA with Tukey’s multiple-comparisons test). There is no GFP+ dendritic cell data for CT26 liver metastasis because the CT26 cell line used is not transfected with the GFP-Gluc construct. (B) Number of total dendritic cells, CD103+CD11b dendritic cells, and CD103CD11b+ dendritic cells in SL4 liver metastases, untreated or treated with ICB alone, radiation alone, or radiation plus ICB (n = 7 or 8 per group). *P < 0.05, **P < 0.01 (one-way ANOVA with Tukey’s multiple-comparisons test). (C) Number of total dendritic cells, CD103+CD11b dendritic cells, and CD103CD11b+ dendritic cells that express tumor-derived GFP in SL4-GFP liver metastases, untreated or treated with ICB alone, radiation alone, or radiation plus ICB (n = 7 or 8 per group). *P < 0.05, **P < 0.01 (one-way ANOVA with Tukey’s multiple-comparisons test). (D) Number of total CD4+FOXP3 T cells and PD1+ CD4+FOXP3 T cells in CT26 liver metastases, untreated or treated with ICB alone, radiation alone, or radiation plus ICB (n = 7 to 15 per group). *P < 0.05, **P < 0.01, ***P < 0.001 (one-way ANOVA with Tukey’s multiple-comparisons test). (E) Number of total CD4+FOXP3 T cells and PD1+ CD4+FOXP3 T cells in SL4 liver metastases, untreated or treated with ICB alone, radiation alone, or radiation plus ICB (n = 7 or 8 per group). *P < 0.05, **P < 0.01 (one-way ANOVA with Tukey’s multiple-comparisons test). (F) Number of total CD8+ T cells, granzyme B+ CD8+ T cells, and PD1+ CD8+ T cells in CT26 liver metastases, untreated or treated with ICB alone, radiation alone, or radiation plus ICB (n = 7 to 15 per group). *P < 0.05, **P < 0.01, ***P < 0.001 (one-way ANOVA with Tukey’s multiple-comparisons test). (G) Number of total CD8+ T cells, granzyme B+ CD8+ T cells, and PD1+ CD8+ T cells in SL4 liver metastases, untreated or treated with ICB alone, radiation alone, or radiation plus ICB (n = 7 or 8 per group). n.s., P > 0.05 (one-way ANOVA with Tukey’s multiple-comparisons test). (A, D, and F) Radiation: 8 Gy; ICB: days 11, 14, and 17; tumor tissue collection: day 20. (B, C, E, and G) Radiation: 8 Gy; ICB: days 7, 10, and 13; tumor tissue collection: day 17. (H) Survival of mice bearing CT26 liver metastases (n = 8 to 11 per group), untreated or treated with ICB alone, radiation alone, or radiation plus ICB. n.s., P > 0.05; *P < 0.05, **P < 0.01, ***P < 0.001, ****P < 0.0001 (log-rank test). (I) Survival of mice bearing SL4 liver metastases (n = 8 or 9 per group), untreated or treated with ICB alone, radiation alone, or radiation plus ICB. n.s., P > 0.05; ****P < 0.0001 (log-rank test). Data are mean ± SEM. ICB: anti–PD1 (200 µg per mouse) plus anti–CTLA-4 (100 µg per mouse); i.v. injection.
Fig. 7.
Fig. 7.
Human CRC liver metastases and MSS CRC primary tumors have a paucity of CD4+ T cells, CD8+ T cells, and dendritic cells. (A) GSVA enrichment score of activated CD4+ T cells and central memory CD4+ T cells in human CRC liver metastases (CRCLiM), MSS CRC primary tumors (CRCPC MSS), MSI-H CRC primary tumors (CRCPC MSI-H), and melanoma tumors (SKCM). *P < 0.05, **P < 0.01, ****P < 0.0001 (one-way ANOVA with Tukey’s multiple-comparisons test). (B) GSVA enrichment score of central memory CD8+ T cells and effector memory CD8+ T cells in human CRC liver metastases (CRCLiM), MSS CRC primary tumors (CRCPC MSS), MSI-H CRC primary tumors (CRCPC MSI-H), and melanoma tumors (SKCM). *P < 0.05, **P < 0.01, ***P < 0.001, ****P < 0.0001 (one-way ANOVA with Tukey’s multiple-comparisons test). (C) GSVA enrichment score of activated dendritic cells and immature dendritic cells in human CRC liver metastases (CRCLiM), MSS CRC primary tumors (CRCPC MSS), MSI-H CRC primary tumors (CRCPC MSI-H), and melanoma tumors (SKCM). *P < 0.05, **P < 0.01, ***P < 0.001, ****P < 0.0001 (one-way ANOVA with Tukey’s multiple-comparisons test). CRCLiM: n = 25; CRCPC MSS: n = 336; CRCPC MSI-H: n = 58; SKCM: n = 473. Data are mean ± SEM.

References

    1. Ribas A., Wolchok J. D., Cancer immunotherapy using checkpoint blockade. Science 359, 1350–1355 (2018). - PMC - PubMed
    1. Larkin J., et al. ., Five-year survival with combined nivolumab and ipilimumab in advanced melanoma. N. Engl. J. Med. 381, 1535–1546 (2019). - PubMed
    1. Haslam A., Prasad V., Estimation of the percentage of US patients with cancer who are eligible for and respond to checkpoint inhibitor immunotherapy drugs. JAMA Netw. Open 2, e192535 (2019). - PMC - PubMed
    1. Siegel R. L., Miller K. D., Fuchs H. E., Jemal A., Cancer statistics, 2021. CA Cancer J. Clin. 71, 7–33 (2021). - PubMed
    1. Sung H., et al. ., Global cancer statistics 2020: GLOBOCAN estimates of incidence and mortality worldwide for 36 cancers in 185 countries. CA Cancer J. Clin. 71, 209–249 (2021). - PubMed

Publication types

Substances