

Quantifying contributions of natural variability and anthropogenic forcings on increased fire weather risk over the western United States
- PMID: 34725162
- PMCID: PMC8609294
- DOI: 10.1073/pnas.2111875118
Quantifying contributions of natural variability and anthropogenic forcings on increased fire weather risk over the western United States
Abstract
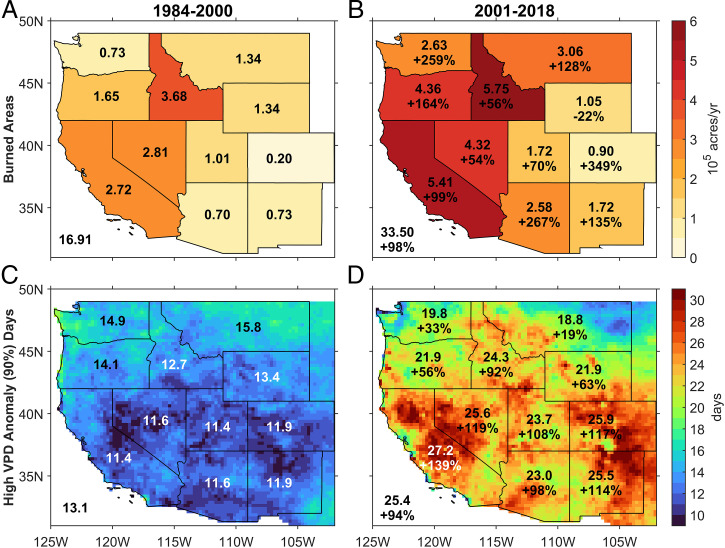
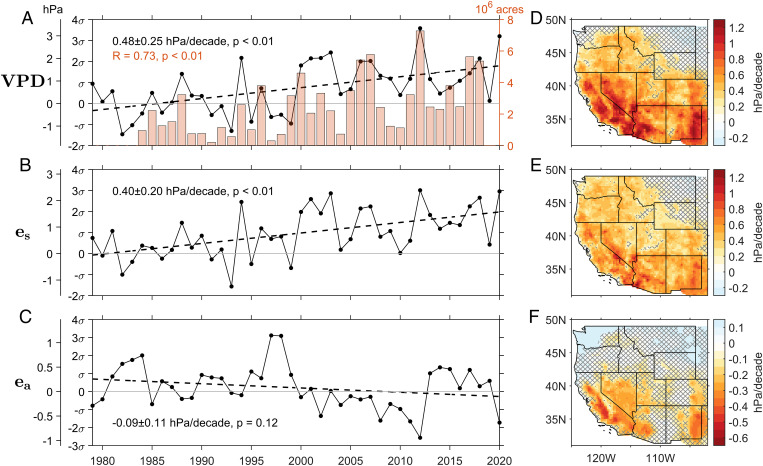
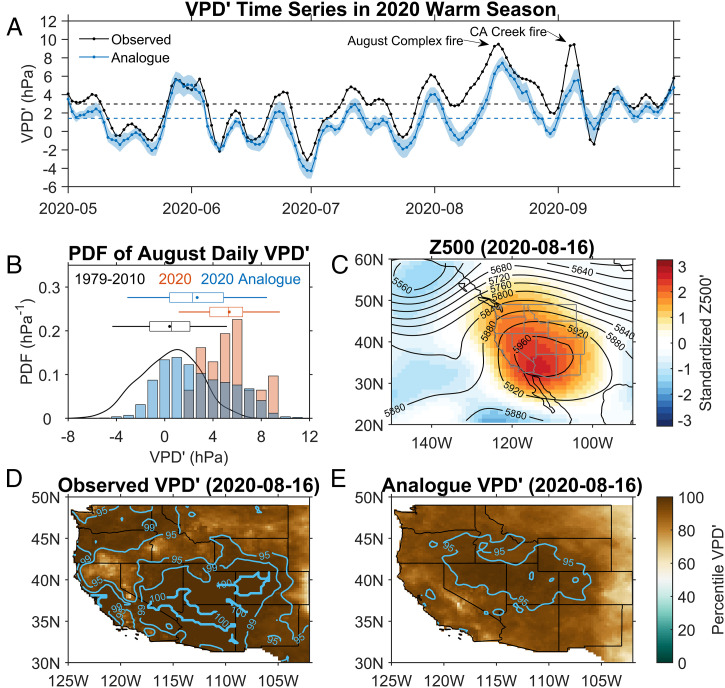
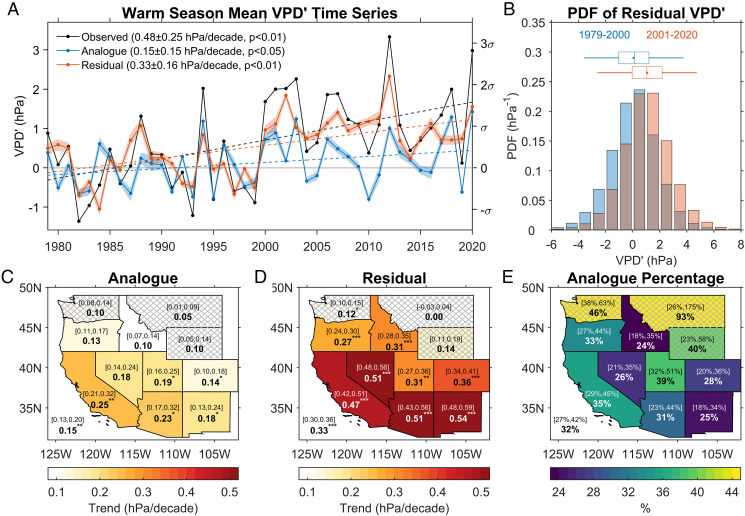
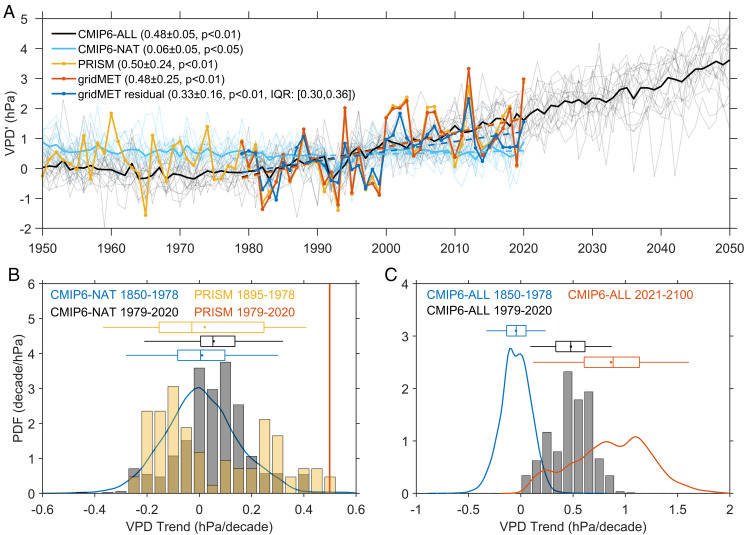
Previous studies have identified a recent increase in wildfire activity in the western United States (WUS). However, the extent to which this trend is due to weather pattern changes dominated by natural variability versus anthropogenic warming has been unclear. Using an ensemble constructed flow analogue approach, we have employed observations to estimate vapor pressure deficit (VPD), the leading meteorological variable that controls wildfires, associated with different atmospheric circulation patterns. Our results show that for the period 1979 to 2020, variation in the atmospheric circulation explains, on average, only 32% of the observed VPD trend of 0.48 ± 0.25 hPa/decade (95% CI) over the WUS during the warm season (May to September). The remaining 68% of the upward VPD trend is likely due to anthropogenic warming. The ensemble simulations of climate models participating in the sixth phase of the Coupled Model Intercomparison Project suggest that anthropogenic forcing explains an even larger fraction of the observed VPD trend (88%) for the same period and region. These models and observational estimates likely provide a lower and an upper bound on the true impact of anthropogenic warming on the VPD trend over the WUS. During August 2020, when the August Complex "Gigafire" occurred in the WUS, anthropogenic warming likely explains 50% of the unprecedented high VPD anomalies.
Keywords: anthropogenic warming; atmospheric circulation; attribution; fire weather; western United States.
Copyright © 2021 the Author(s). Published by PNAS.
Conflict of interest statement
The authors declare no competing interest.
Figures
Comment in
-
Atmospheric variability contributes to increasing wildfire weather but not as much as global warming.Proc Natl Acad Sci U S A. 2021 Nov 16;118(46):e2117876118. doi: 10.1073/pnas.2117876118. Proc Natl Acad Sci U S A. 2021. PMID: 34764227 Free PMC article. No abstract available.
Similar articles
-
Impact of anthropogenic climate change on wildfire across western US forests.Proc Natl Acad Sci U S A. 2016 Oct 18;113(42):11770-11775. doi: 10.1073/pnas.1607171113. Epub 2016 Oct 10. Proc Natl Acad Sci U S A. 2016. PMID: 27791053 Free PMC article.
-
Exacerbating risk in human-ignited large fires over western United States due to lower flammability thresholds and greenhouse gas emissions.PNAS Nexus. 2025 Feb 11;4(2):pgaf012. doi: 10.1093/pnasnexus/pgaf012. eCollection 2025 Feb. PNAS Nexus. 2025. PMID: 39935590 Free PMC article.
-
Increasing large wildfires over the western United States linked to diminishing sea ice in the Arctic.Nat Commun. 2021 Oct 26;12(1):6048. doi: 10.1038/s41467-021-26232-9. Nat Commun. 2021. PMID: 34702824 Free PMC article.
-
Do lakes feel the burn? Ecological consequences of increasing exposure of lakes to fire in the continental United States.Glob Chang Biol. 2019 Sep;25(9):2841-2854. doi: 10.1111/gcb.14732. Epub 2019 Jul 13. Glob Chang Biol. 2019. PMID: 31301168 Review.
-
Adapting western North American forests to climate change and wildfires: 10 common questions.Ecol Appl. 2021 Dec;31(8):e02433. doi: 10.1002/eap.2433. Epub 2021 Oct 13. Ecol Appl. 2021. PMID: 34339088 Free PMC article. Review.
Cited by
-
Strengthening Maternal and Infant Health Resilience Before Weather and Climate Disasters: Preparedness Resources from CDC's Division of Reproductive Health.J Womens Health (Larchmt). 2024 Oct;33(10):1289-1295. doi: 10.1089/jwh.2024.0669. Epub 2024 Aug 12. J Womens Health (Larchmt). 2024. PMID: 39129561 Free PMC article.
-
Storyline attribution of human influence on a record-breaking spatially compounding flood-heat event.Sci Adv. 2023 Dec;9(48):eadi2714. doi: 10.1126/sciadv.adi2714. Epub 2023 Nov 29. Sci Adv. 2023. PMID: 38019915 Free PMC article.
-
Drought assessment has been outpaced by climate change: empirical arguments for a paradigm shift.Nat Commun. 2022 May 17;13(1):2715. doi: 10.1038/s41467-022-30316-5. Nat Commun. 2022. PMID: 35581261 Free PMC article.
-
Co-occurring climate events and environmental justice in California, 2018-2019.Environ Res Health. 2025 Jun 1;3(2):021001. doi: 10.1088/2752-5309/ada96f. Epub 2025 Feb 4. Environ Res Health. 2025. PMID: 39916876 Free PMC article.
-
Rapid summer Russian Arctic sea-ice loss enhances the risk of recent Eastern Siberian wildfires.Nat Commun. 2024 Jun 26;15(1):5399. doi: 10.1038/s41467-024-49677-0. Nat Commun. 2024. PMID: 38926364 Free PMC article.
References
-
- Picotte J. J., et al. ., Changes to the monitoring trends in burn severity program mapping production procedures and data products. Fire Ecol. 16, 16 (2020).
-
- Agee J. K., Skinner C. N., Basic principles of forest fuel reduction treatments. For. Ecol. Manage. 211, 83–96 (2005).
-
- Stephens S. L., Ruth L. W., Federal forest-fire policy in the United States. Ecol. Appl. 15, 532–542 (2005).
-
- Littell J. S., McKenzie D., Peterson D. L., Westerling A. L., Climate and wildfire area burned in western U.S. ecoprovinces, 1916-2003. Ecol. Appl. 19, 1003–1021 (2009). - PubMed
-
- Williams A. P., Abatzoglou J. T., Recent advances and remaining uncertainties in resolving past and future climate effects on global fire activity. Curr. Clim. Change Rep. 2, 1–14 (2016).
