. 2021 Nov 1;9(1):e1038.
doi: 10.1212/NXI.0000000000001038. Print 2022 Jan.

GRP78 Antibodies Are Associated With Blood-Brain Barrier Breakdown in Anti-Myelin Oligodendrocyte Glycoprotein Antibody-Associated Disorder

Affiliations

GRP78 Antibodies Are Associated With Blood-Brain Barrier Breakdown in Anti-Myelin Oligodendrocyte Glycoprotein Antibody-Associated Disorder

Fumitaka Shimizu et al. Neurol Neuroimmunol Neuroinflamm. .

Abstract

Background and objectives: To analyze (1) the effect of immunoglobulin G (IgG) from patients with anti-myelin oligodendrocyte glycoprotein antibody (MOG-Ab)-associated disorder on the blood-brain barrier (BBB) endothelial cells and (2) the positivity of glucose-regulated protein 78 (GRP78) antibodies in MOG-Ab-associated disorders.

Methods: IgG was purified from sera with patients with MOG-Ab-associated disorder in the acute phase (acute MOG, n = 15), in the stable stage (stable MOG, n = 14), healthy controls (HCs, n = 9), and disease controls (DCs, n = 27). Human brain microvascular endothelial cells (BMECs) were incubated with IgG, and the number of nuclear NF-κB p65-positive cells in BMECs using high-content imaging system and the quantitative messenger RNA change in gene expression over the whole transcriptome using RNA-seq were analyzed. GRP78 antibodies from patient IgGs were detected by Western blotting.

Results: IgG in the acute MOG group significantly induced the nuclear translocation of NF-κB and increased the vascular cell adhesion molecule 1/intercellular adhesion molecule 1 expression/permeability of 10-kDa dextran compared with that from the stable MOG and HC/DC groups. RNA-seq and pathway analysis revealed that NF-κB signaling and oxidative stress (NQO1) play key roles. The NQO1 and Nrf2 protein amounts were significantly decreased after exposure to IgG in the acute MOG group. The rate of GRP78 antibody positivity in the acute MOG group (10/15, 67% [95% confidence interval, 38%-88%]) was significantly higher than that in the stable MOG group (5/14, 36% [13%-65%]), multiple sclerosis group (4/29, 14% [4%-32%]), the DCs (3/27, 11% [2%-29%]), or HCs (0/9, 0%). Removal of GRP78 antibodies from MOG-IgG reduced the effect on NF-κB nuclear translocation and increased permeability.

Discussion: GRP78 antibodies may be associated with BBB dysfunction in MOG-Ab-associated disorder.


Figures

Figure 1
Figure 1. NF-κB p65 Activation and Permeability of Brain Endothelial Cells After Exposure to IgG From Patients With Acute MOG Antibody–Associated Disorder
(A–D) Immunostaining of human brain microvascular endothelial cells (TY10 cells) for NF-κB p65 (green) after exposure to IgG (500 µg/mL) from patients with MOG-Ab–associated disorder in the acute phase (acute MOG) (A) or patients with MOG-Ab–associated disorder in the stable phase (stable MOG) (B), DCs (C), or HCs (D). Arrows indicate representative nuclear NF-κB p65–positive cells (A). Images were captured by an In Cell Analyzer 2000. Scale bar, 50 μm. (E) Scatter plots of the number of nuclear NF-κB p65-positive TY10 cells, as determined by high-content imaging after exposure to IgG from patients with MOG-Ab–associated disorder in the acute phase (acute MOG, n = 15), patients with MOG-Ab–associated disorder in the stable phase (stable MOG, n = 14), DCs (n = 27), and HCs (n = 7). The data were normalized to cultures that had not been exposed to human IgG and are shown as the mean ± standard error of the mean from 4 independent experiments, performed in technical triplicate. Black dots show the 6 samples inducing the 6 highest degrees of nuclear translocation of NF-κB. The p values were determined by the nonparametric Kruskal-Wallis test (*p < 0.05). (F) The proportion of nuclear NF-κB p65 nuclear-positive cells between the acute and stable phase in the same individual is shown. The p values were determined by a paired 2-tailed t test (G) Scatter plots of the 10-kDa dextran permeability of TY10 cells after exposure to acute MOG-IgG (n = 15), stable MOG-IgG (n = 14), DC-IgG (n = 27), or HC-IgG (n = 7). Black dots show the 6 samples inducing the 6 highest degrees of nuclear translocation of NF-κB. The p values were determined by the nonparametric Kruskal-Wallis test (*p < 0.05, ***p < 0.001 vs the stable MOG, DC, and HC groups). DC = disease control; HC = healthy control; MOG = myelin oligodendrocyte glycoprotein; MOG-Ab = myelin oligodendrocyte glycoprotein antibody.
Figure 2
Figure 2. Changes in the VCAM-1 and ICAM-1 Expression After IgG Exposure From Acute MOG Antibody–Associated Disorders
(A) Western blotting of VCAM-1 or ICAM-1 in TY10 after exposure to IgG (500 µg/mL) from patients with MOG-Ab–associated disorder in the acute phase (acute MOG, n = 15), the stable phase (stable MOG, n = 14), DCs (n = 8), or HCs (n = 7). (B) (C) Scatter plots of quantification by Western blotting for VCAM-1 (B) or ICAM-1 (C) in relation to actin. Each scatter plot reflects the combined densitometry data (mean ± standard error of the mean). The p values were determined by a 1-way analysis of variance followed by the Tukey multiple comparison test (**p < 0.01 vs the DC or HC group followed by the Tukey multiple comparison test). (D) Immunostaining of human brain microvascular endothelial cells (TY10 cells) for ICAM-1 (green) after exposure to IgG (500 µg/mL) from patients with MOG-Ab–associated disorder in the acute phase (acute MOG), DCs, or HCs. Tumor necrosis factor-α and interferon-γ stimulation served as a positive control. Image of ICAM-1 captured by an In Cell Analyzer 2000. Scale bar, 50 μm. (E) Scatter plots of intensity of ICAM-1, as determined by high-content imaging after exposure to IgG from patients with MOG-Ab–associated disorder in the acute phase (acute MOG, n = 14), DCs (n = 7), and HCs (n = 9). The data were normalized to cultures that had not been exposed to human IgG and are shown from 3 independent experiments. The p values were determined by a 1-way ANOVA followed by the Tukey multiple comparison test (*p < 0.05 vs the DC or HC group followed by the Tukey multiple comparison test). ANOVA = analysis of variance; DC = disease control; HC = healthy control; ICAM-1 = intercellular adhesion molecule 1; MOG = myelin oligodendrocyte glycoprotein; MOG-Ab = myelin oligodendrocyte glycoprotein antibody; VCAM-1 = vascular cell adhesion molecule 1.
Figure 3
Figure 3. Whole Transcriptome Analysis With RNA-Seq of TY10 After Exposure to IgG From Patients With MOG Antibody–Associated Disorders
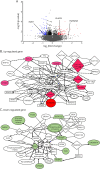
TY10 cells were incubated with IgG from the patients with MOG-Ab–associated disorder (n = 4) and healthy controls (n = 3). TY10 cells without exposure to IgGs were also used as control. Over 32,000 genes were detected from approximately 30 million reads in each sample. (A) Volcano plots (FC > 1.5; p < 0.05) revealed that 189 genes were significantly differentially expressed (FC > 1.5; p < 0.05), including 83 upregulated genes (red) and 106 downregulated genes (blue), between the patients with MOG-Ab–associated disorder (n = 4) and healthy control (n = 3)/control (n = 1) groups (total n = 4). (B) In the network analysis of upregulated genes, NF-κB was detected in the center of the network analysis. The red nodes show the upregulated genes in the RNA-seq analysis (FC > 1.5; p < 0.05). (C) In the network analysis of downregulated genes, NQO1 and DNAJB1 were detected in the center of the network analysis. The green nodes show the downregulated genes in the RNA-seq analysis (FC < 1.5; p < 0.05). DC = disease control; HC = healthy control; FC = fold change; ICAM-1 = intercellular adhesion molecule 1; MOG = myelin oligodendrocyte glycoprotein; MOG-Ab = myelin oligodendrocyte glycoprotein antibody; VCAM-1 = vascular cell adhesion molecule 1.
Figure 4
Figure 4. Changes in the Protective Proteins Against Oxidative Stress After IgG Exposure From Acute MOG Antibody–Associated Disorders
(A, B) Immunostaining of human brain microvascular endothelial cells (TY10 cells) for NQO1 or Nrf2 (green), or JC-1 (green/red) after exposure to IgG (500 µg/mL) from patients with MOG-Ab–associated disorder in the acute phase (acute MOG), DCs, or HCs (upper, NQO1/lower, Nrf2). Images were captured by an In Cell Analyzer 2000. The JC-1 red/green intensity ratio reflects the mitochondria potential. Scale bar, 50 μm. (C–E) Scatter plots of the intensity of NQO1 or Nrf2, or JC-1 red/green intensity ratio in TY10 cells, as determined by high-content imaging after exposure to IgG from patients with MOG-Ab–associated disorder in the acute phase (acute MOG, n = 14), DCs (n = 9), and HCs (n = 7). The data were normalized to cultures that had not been exposed to human IgG and are shown from 3 independent experiments. The p values were determined by a 1-way ANOVA followed by the Tukey multiple comparison test (*p < 0.05 vs the DC or HC group followed by the Tukey multiple comparison test). (F) Western blotting of Nrf2 in TY10 after exposure to acute MOG-IgG (n = 15), DC-IgG (n = 7), or HC-IgG (n = 7) (500 μg/mL). (G) Scatter plots of quantification by Western blotting for Nrf2 in relation to actin. Each scatter plot reflects the combined densitometry data (mean ± standard error of the mean). The p values were determined by a 1-way ANOVA followed by the Tukey multiple comparison test (***p < 0.001 vs the DC or HC group followed by the Tukey multiple comparison test). (H) Effect of 2 MOG-IgG (Pts 1 and 9, 250 µg/mL) on 10-kDa dextran permeability on BMECs after incubation with and without bardoxolone methyl (MOG vs MOG + bardoxolone methyl), which has the effect of activating Nrf2 and inhibiting NF-κB activation. ANOVA = analysis of variance; BMEC = brain microvascular endothelial cell; DC = disease control; HC = healthy control; MOG = myelin oligodendrocyte glycoprotein; MOG-Ab = myelin oligodendrocyte glycoprotein antibody.
Figure 5
Figure 5. Western Blotting of GRP78 Autoantibodies in IgG From Patients With MOG Antibody–Associated Disorders
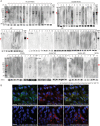
(A) The results of Western blotting of individual IgG samples (5 μg/mL) from patients with acute and stable MOG, MS, DCs, and HCs, as determined using recombinant human GRP78 protein prepared from Escherichia coli. The arrowhead indicates an immunoreactive band corresponding to GRP78. Rabbit anti-GRP78 antibodies were used as the positive control. The rate of GRP78 antibody positivity: (1) the acute MOG group (10/15, 67% [95% CI 38%–88%]), (2) stable MOG group (5/14, 36% [95% CI 13%–65%]), (3) MS group (total MS: 4/29, 14% [95% CI 4%–32%]), (4) DC group (3 of 27, 11% [95% CI 2%–29%]), (5) HC group (0 of 9, 0% [95% CI 0%]), (6) secondary progressive MS group (3 of 10, 30% [95% CI 6%–65%]), (7) acute MS group (0 of 10, 0% [95% CI 0%], and (8) stable MS group (1 of 9, 11% [95% CI 0.3%–48%]). (B) Immunofluorescence labeling of TY10 cells with MOG-IgG (50 μg/mL) (green) and commercial anti-GRP78 antibodies (red) shows colocalization of the 2 proteins (merged in yellow). Scale bar, 50 μm. CI = confidence interval; DC = disease control; HC = healthy control; MOG = myelin oligodendrocyte glycoprotein.
Figure 6
Figure 6. Effect of the Removal of GRP78 Autoantibodies From Acute MOG-IgG on the NF-κB p65 Nuclear Translocation in BMECs
The removal of GRP78 antibodies from 2 acute MOG-IgGs (500 µg/mL, patients 1 and 9) with MOG-Ab–associated disorder significantly decreased the NF-κB nuclear translocation of BMECs (A) and the 10-kDa dextran permeability (B). Data are shown as the mean ± standard error of the mean of 6 independent experiments. Statistical significance was determined by a paired 2-tailed t test. GRP78 Ab (+), MOG-IgG with GRP78 autoantibodies; GRP78 Ab (−), MOG-IgG without GRP78 autoantibodies. BMEC = brain microvascular endothelial cell; MOG = myelin oligodendrocyte glycoprotein; MOG-Ab = myelin oligodendrocyte glycoprotein antibody.

Similar articles

Cited by

References

    1. Fujihara K. Neuromyelitis optica spectrum disorders: still evolving and broadening. Curr Opin Neurol. 2019;32(3):385-394. - PMC - PubMed
    1. Cobo-Calvo A, Vukusic S, Marignier R. Clinical spectrum of central nervous system myelin oligodendrocyte glycoprotein autoimmunity in adults. Curr Opin Neurol. 2019;32(3):459-466. - PubMed
    1. Dos Passos GR, Oliveira LM, da Costa BK, et al. . MOG-IgG-Associated optic neuritis, encephalitis, and myelitis: lessons learned from neuromyelitis optica spectrum disorder. Front Neurol. 2018;9(4):217. - PMC - PubMed
    1. Reindl M, Jarius S, Rostasy K, Berger T. Myelin oligodendrocyte glycoprotein antibodies: how clinically useful are they? Curr Opin Neurol. 2017;30(3):295-301. - PubMed
    1. Spadaro M, Gerdes LA, Mayer MC, et al. . Histopathology and clinical course of MOG-antibody-associated encephalomyelitis. Ann Clin Transl Neurol. 2015;2(3):295-301. - PMC - PubMed

Publication types

Substances