. 2021 Nov 1;12(11):1038.
doi: 10.1038/s41419-021-04318-y.

PERK signaling through C/EBPδ contributes to ER stress-induced expression of immunomodulatory and tumor promoting chemokines by cancer cells

Affiliations

PERK signaling through C/EBPδ contributes to ER stress-induced expression of immunomodulatory and tumor promoting chemokines by cancer cells

Namratha Sheshadri et al. Cell Death Dis. .

Abstract

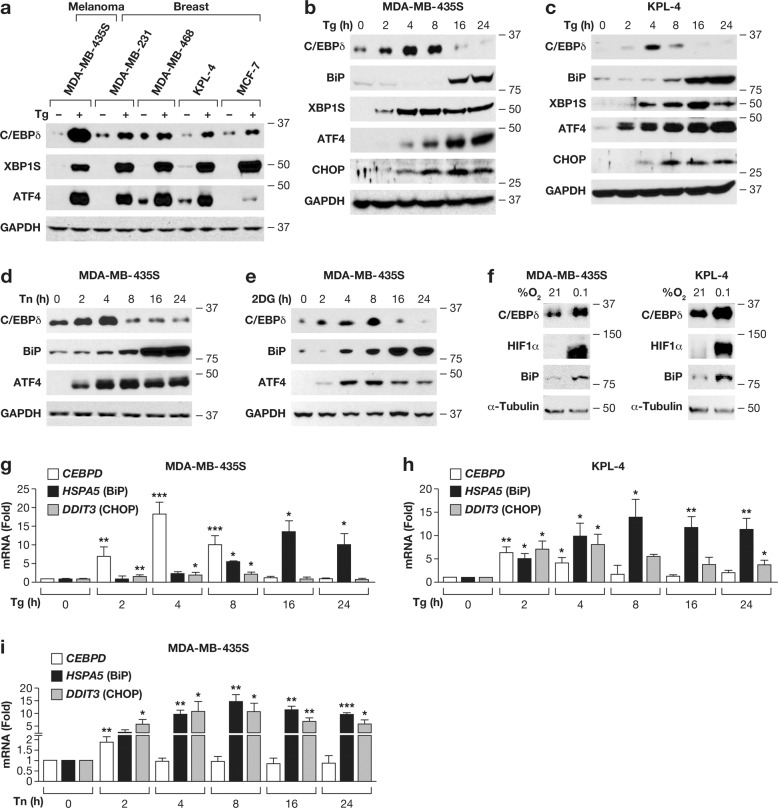
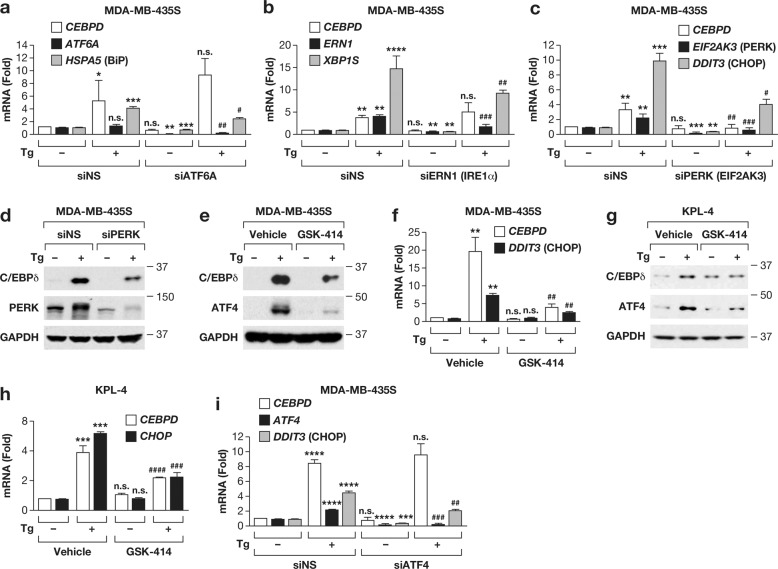
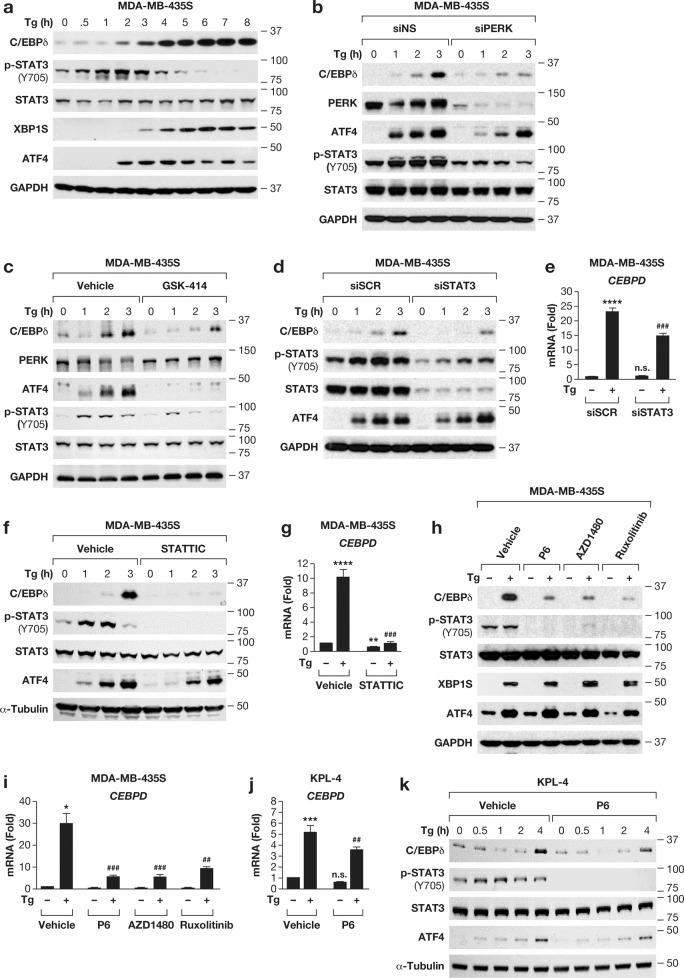
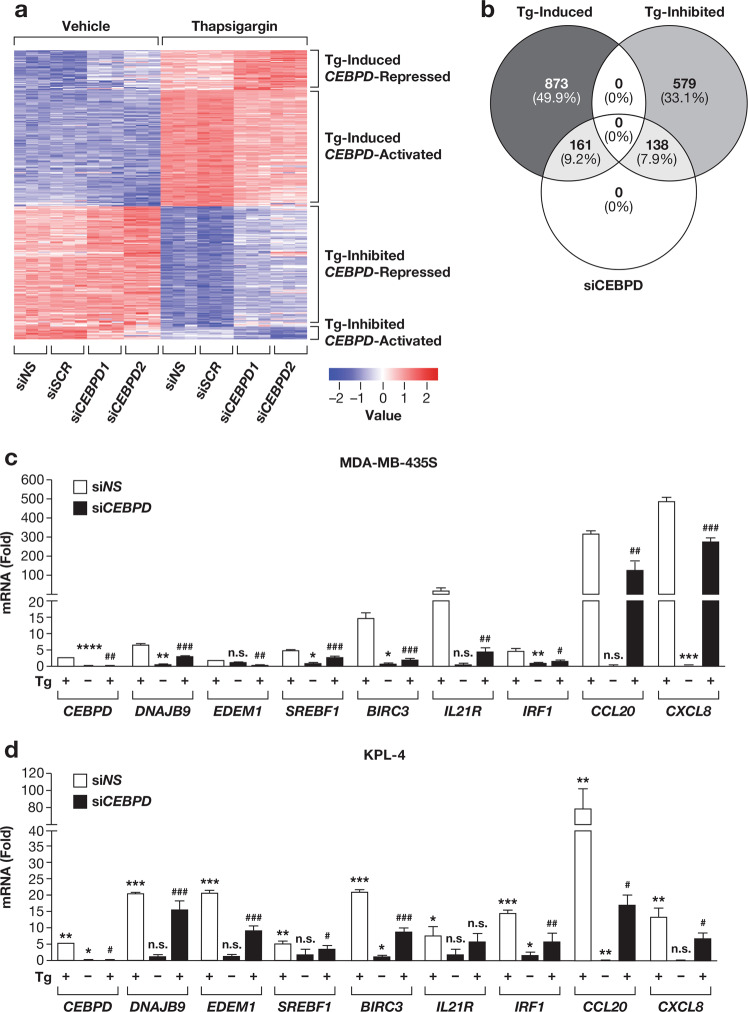
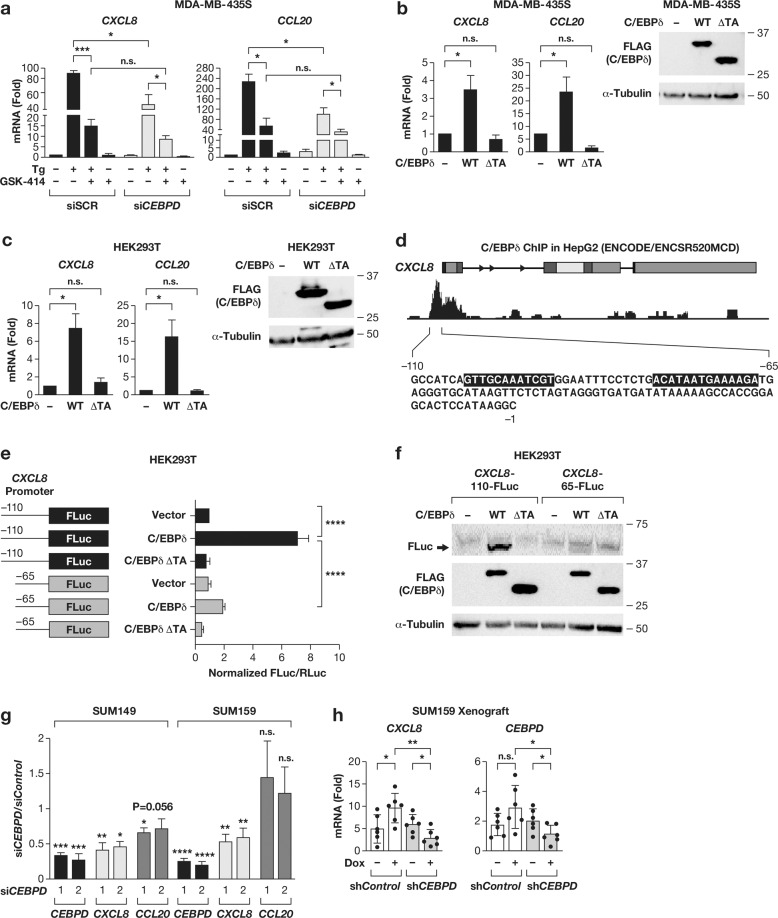
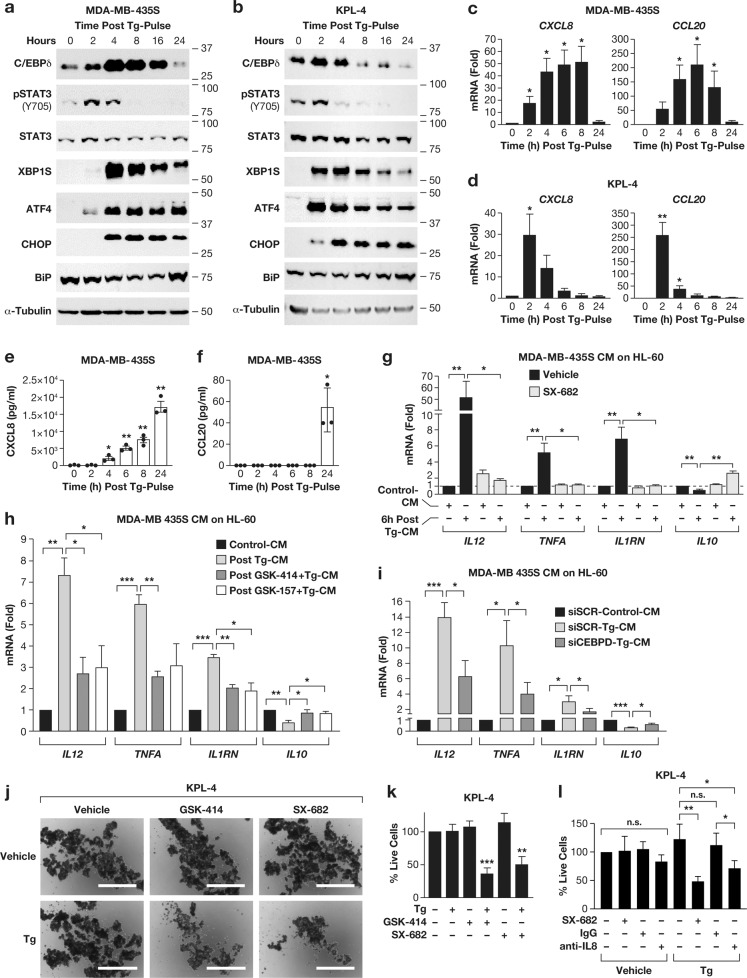
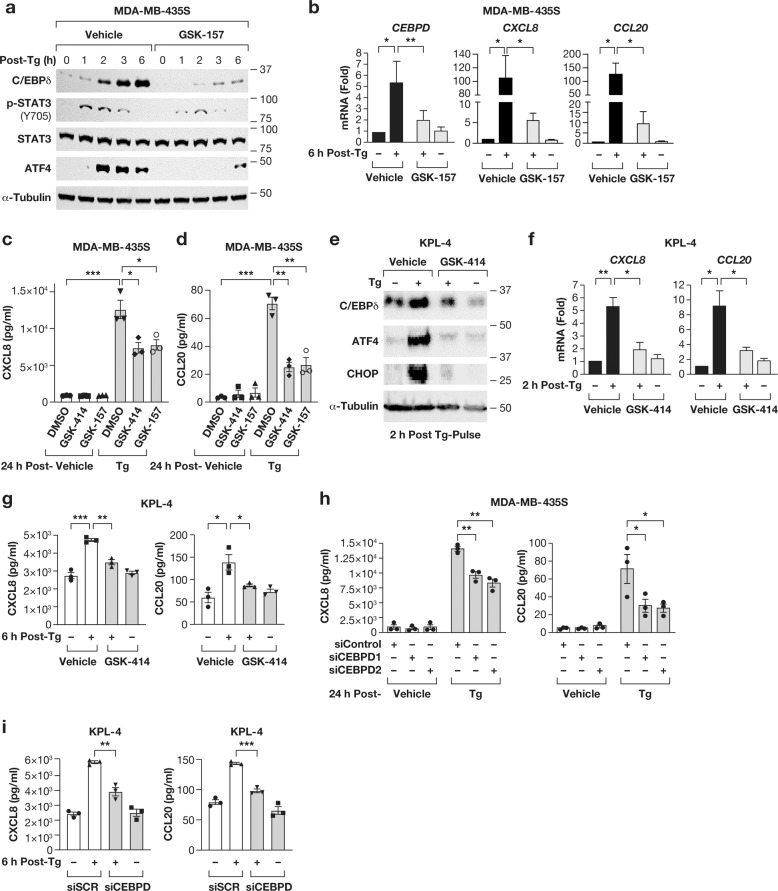
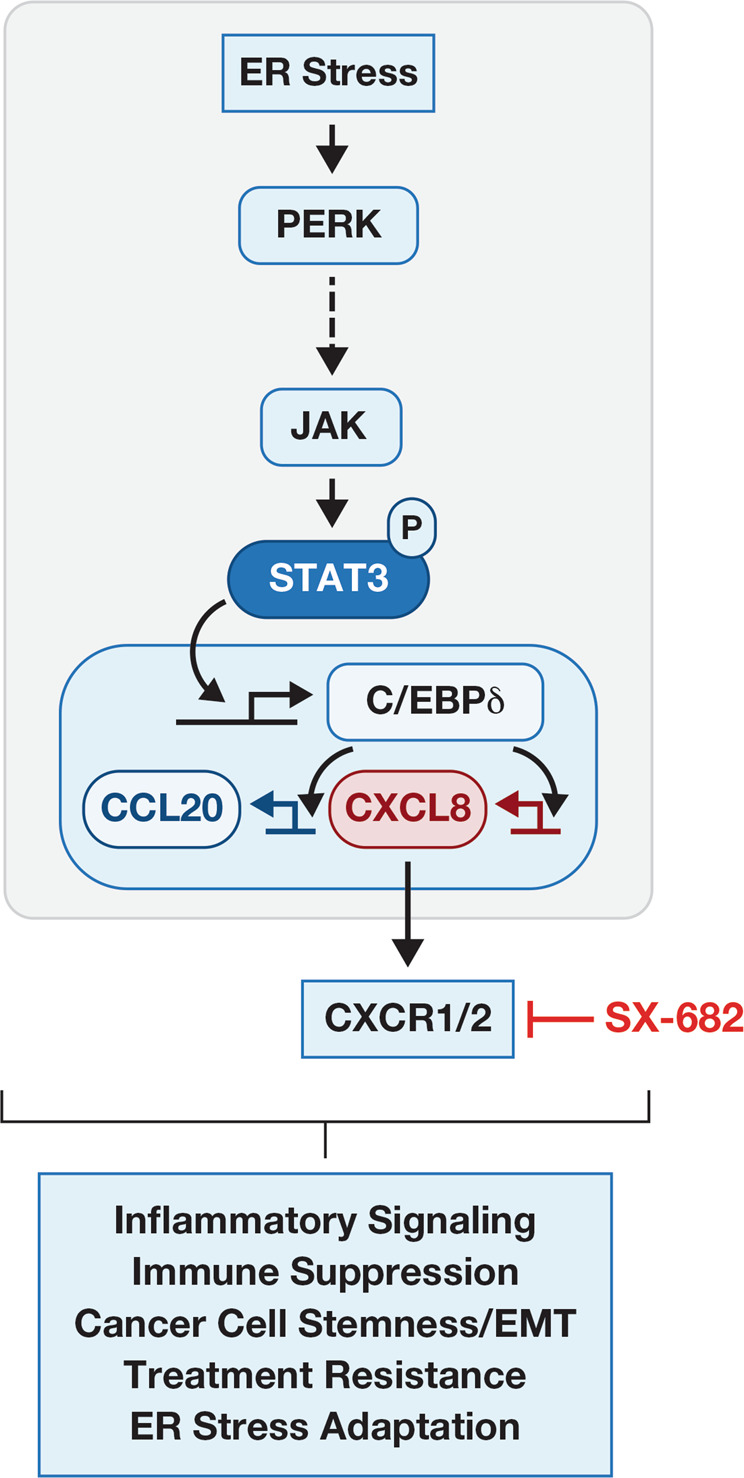
Cancer cells experience endoplasmic reticulum (ER) stress due to activated oncogenes and conditions of nutrient deprivation and hypoxia. The ensuing unfolded protein response (UPR) is executed by ATF6, IRE1 and PERK pathways. Adaptation to mild ER stress promotes tumor cell survival and aggressiveness. Unmitigated ER stress, however, will result in cell death and is a potential avenue for cancer therapies. Because of this yin-yang nature of ER stress, it is imperative that we fully understand the mechanisms and dynamics of the UPR and its contribution to the complexity of tumor biology. The PERK pathway inhibits global protein synthesis while allowing translation of specific mRNAs, such as the ATF4 transcription factor. Using thapsigargin and tunicamycin to induce acute ER stress, we identified the transcription factor C/EBPδ (CEBPD) as a mediator of PERK signaling to secretion of tumor promoting chemokines. In melanoma and breast cancer cell lines, PERK mediated early induction of C/EBPδ through ATF4-independent pathways that involved at least in part Janus kinases and the STAT3 transcription factor. Transcriptional profiling revealed that C/EBPδ contributed to 20% of thapsigargin response genes including chaperones, components of ER-associated degradation, and apoptosis inhibitors. In addition, C/EBPδ supported the expression of the chemokines CXCL8 (IL-8) and CCL20, which are known for their tumor promoting and immunosuppressive properties. With a paradigm of short-term exposure to thapsigargin, which was sufficient to trigger prolonged activation of the UPR in cancer cells, we found that conditioned media from such cells induced cytokine expression in myeloid cells. In addition, activation of the CXCL8 receptor CXCR1 during thapsigargin exposure supported subsequent sphere formation by cancer cells. Taken together, these investigations elucidated a novel mechanism of ER stress-induced transmissible signals in tumor cells that may be particularly relevant in the context of pharmacological interventions.


Conflict of interest statement

The authors declare no competing interests.

Figures

Fig. 1
Fig. 1. Endoplasmic reticulum stress modulates C/EBPδ expression in multiple cell lines.
a Western blot analysis of the indicated proteins from cell lines representing melanoma and breast cancer treated with 100 nM of Thapsigargin (Tg) for 4 h. be Western blot analysis of b MDA-MB-435S or c KPL-4 cells treated with 100 nM Tg for the indicated times, d MDA-MB-435S cells treated with 10 µg/ml Tunicamycin (Tn) or e 10 mM 2-deoxy-glucose (2DG) for the indicated duration (0 h = vehicle treated for 24 h). f MDA-MB-435S and KPL-4 cells exposed to anoxia (0.1% O2) or ambient (21% O2) for 24 h. af labels on the right indicate molecular weight in kDa for this and subsequent Figures. g, h qRT-PCR analysis of mRNA levels as indicated in g MDA-MB-435S and h KPL-4 cells treated as in b. i qRT-PCR analysis of mRNA levels in MDA-MB-435S cells treated with 10 µg/ml Tn for the indicated times. Data are represented as mean±S.E.M, n = 3, *P < 0.05, **P < 0.01, ***P < 0.001.
Fig. 2
Fig. 2. C/EBPδ is induced by the PERK pathway of the unfolded protein response in MDA-MB-435S and KPL-4 cells.
ac qRT-PCR analysis of the indicated mRNA levels in MDA-MB-435S cells transfected with control siRNA (siNS) or a siATF6A (ATF6α), b siERN1 (IRE1α), or c siPERK (targeting EIF2AK3), and treated for 6 h with 100 nM Tg (+) or DMSO (−). d Western blot analysis of MDA-MB-435S cells transfected with siRNA and treated with Tg (100 nM) for 3 h as indicated. eh Western blot analysis (e, g) and qRT-PCR analysis (f, h) of MDA-MB-435S (e, f) and KPL-4 (g, h) cells treated with DMSO or Tg (100 nM) for 3 h and with or without pre-treatment with 1 µM GSK2606414 (GSK-414). i qRT-PCR analysis of the indicated mRNA levels in MDA-MB-435S cells transfected with siNS or siATF4 and treated with DMSO or Tg for 6 h. Quantitative data are represented as mean ± S.E.M, n = 3; *P < 0.05, **P < 0.01, ***P < 0.001, ****P < 0.0001 for comparisons to siNS or vehicle control *without Tg or #with Tg treatment, n.s., not significant.
Fig. 3
Fig. 3. PERK-dependent JAK/STAT3 activation contributes to C/EBPδ induction.
a Western blot analysis of the indicated proteins in MDA-MB-435S cells treated with 100 nM Tg for the indicated times (0 h = vehicle treated for 8 h). b, c Western blot analysis of MDA-MB-435S cells (b) transfected with siNS or siPERK, or c pre-treated with 1 µM GSK-414, and treated with Tg for the indicated times (0 h = vehicle treated for 3 h). d Western analysis of cells treated as in b after transfection with siSCR or siSTAT3. e qRT-PCR analysis of CEBPD mRNA in cells as in d treated for 3 h with Tg. f Western analysis of MDA-MB-435S cells as in c pre-treated with DMSO or STAT3 inhibitor STATTIC (20 µM). g qRT-PCR analysis of CEBPD mRNA in cells as in f treated for 3 h with Tg. h, i Western (h) and qRT-PCR (i) analysis of MDA-MB-435S cells treated with DMSO or Tg (100 nM) for 3 h and pre-treated with the JAK inhibitors Pyridone6 (P6, 1 µM), AZD1480 (1 µM) or Ruxolitinib (1 µM) as indicated. j, k qRT-PCR (j) and Western blot analysis (k) of KPL-4 cells treated with DMSO or Tg (100 nM) for 3 h (j) or as indicated (k) with or without pre-treatment with JAK inhibitor Pyridone6 (P6, 1 µM). Quantitative data are represented as mean±S.E.M, n = 3; *P < 0.05, **P < 0.01, ***P < 0.001, ****P < 0.0001 for comparisons to control siRNA or vehicle *without or #with Tg-treatment, n.s., not significant.
Fig. 4
Fig. 4. C/EBPδ mediates ER stress-induced changes in gene expression.
a Heatmap of differentially expressed genes (DEGs) as determined by mRNA-Seq of MDA-MB-435S cells transfected with either of two independent controls (NS, SCR) or two independent CEBPD-targeting siRNAs (CEBPD1, CEBPD2) treated with vehicle or 100 nM Tg for 6 h. Only genes that were significantly altered by Tg-treatment in control siRNA transfected cells were included in this analysis, b Venn diagram illustrating the number of DEGS shown in a. c qRT-PCR analysis of select genes from a in siCEBPD1 transfected cells relative to DMSO-treated siNS control of cells treated as in a. d qRT-PCR analysis of the indicated genes in KPL-4 cells after transfection with siNS control or siCEBPD1 + 2 and treated with DMSO or Tg (100 nM) for 6 h, relative to DMSO treated control. Quantitative data are represented as mean±S.E.M, n = 3; *P < 0.05, **P < 0.01, ***P < 0.001, ****P < 0.0001 for comparisons to siNS treated with *DMSO or #Tg; n.s., not significant.
Fig. 5
Fig. 5. C/EBPδ is sufficient to induce CXCL8 and CCL20 transcription.
a qRT-PCR analysis of CXCL8 and CCL20 mRNA levels in MDA-MB-435S cells transfected with siSCR or siCEBPD, treated with DMSO (−) or Tg (100 nM) for 6 h and with or without with GSK-414 (1 µM) pre-treatment as indicated. b, c qRT-PCR analysis of CXCL8 and CCL20 mRNA levels in MDA-MB-435S (a) and HEK293T (b) cells transfected with expressing constructs of full length (WT) or transactivation domain-truncated (ΔTA) C/EBPδ with FLAG-tag. Empty vector was used as control. Panels on the right show Western blots to demonstrate expression of ectopic C/EBPδ proteins. d Schematic of the CXCL8 gene along with the C/EBPδ ChIP-Seq track from HepG2 cells as reported by the ENCODE database, and the sequence between positions −110 and −1 harboring a peak and C/EBP motifs (shaded) and indicating the position (−65) of the deletion mutation of the reporter construct shown in e. e Luciferase reporter assay in HEK293T cells co-transfected with C/EBPδ expression constructs as in b and Firefly luciferase (FLuc) reporter constructs containing the proximal CXCL8 promoter region from position −110 or −65 to −1. f Western blot analysis of representative extracts from e showing FLuc and C/EBPδ (anti-FLAG) protein expression. g qRT-PCR analysis of the mRNA levels of CEBPD, CXCL8, and CCL20 in SUM149 and SUM159 cells 72 h after nucleofection with control or two independent siRNAs against CEBPD. h qRT-PCR analysis of CXCL8 and CEBPD mRNA in SUM159 xenograft tumors with Dox-inducible shRNA and with and without Dox-treatment as described [18]. Quantitative data are mean±S.E.M; ac, g, n = 3; e, n = 4; h, n = 6; *P < 0.05, **P < 0.01, ***P < 0.001, ****P < 0.0001; n.s., not significant.
Fig. 6
Fig. 6. Transient exposure to Thapsigargin triggers long-term secretion of CXCL8 and CCL20 and modulation of immune and tumor cells.
a, b Western blot analysis of the indicated proteins in (a) MDA-MB-435S and (b) KPL-4 cells treated with 100 nM Tg for 30 min followed by removal of Tg and collected at indicated times thereafter (0 h = pulse-treated with DMSO). c, d qRT-PCR analysis of CXCL8 and CCL20 mRNA levels in c MDA-MB-435S and d KPL-4 cells treated as panels a and b. e, f Enzyme-linked immunosorbent assay (ELISA) for e CXCL8 and f CCL20 in conditioned media from MDA-MB-435S cells treated as in a. g qRT-PCR analysis of IL12, TNFA, IL1RN and IL10 mRNA levels in HL-60 cells treated for 24 h with 33% of 6 h-conditioned media from MDA-MB-435S cells pulse-treated with 100 nM Tg for 30 min. h qRT-PCR analysis of IL12, TNFA, IL1RN and IL10 mRNA levels in HL-60 cells treated for 1 h with 33% of 6 h-conditioned media from MDA-MB-435S pulse-treated with 100 nM Tg for 30 min and PERK inhibitors GSK-414 or GSK2656157 (GSK-157) as indicated. i qRT-PCR analysis of gene expression in HL-60 cells as in h using CM from MDA-MB-435S cells transfected with siRNA and pulse-treated with Tg for 30 min as indicated. j, k KPL-4 cells by j light microscopy (Scale bar: 1 mm) and k live cell counts on day 4 of suspension culture that was preceded by 6 h of the indicated treatments with Tg (100 nM), GSK-414 (1 µM), and/or SX-682 (10 µM) in attachment culture (2D). l Live cell counts of KPL-4 cells on day 4 of suspension culture that was preceded by 6 h of the indicated treatments with Tg (100 nM), SX-682 (10 μM), IgG (20 μg/ml) or anti-IL8/CXCL8 (20 μg/ml) in attachment culture (2D). Quantitative data are represented as mean±S.E.M; n = 3, except i n = 4; *P < 0.05, **P < 0.01, ***P < 0.001, ****P < 0.0001.
Fig. 7
Fig. 7. PERK and C/EBPδ contribute to chemokine expression following ER stress.
a Western blot analysis of the indicated proteins from MDA-MB-435S cells collected at the indicated times after pulse-treatment with 100 nM Tg for 30 min with or without pre-treatment with GSK-157 (10 µM). b qRT-PCR analysis of CEBPD, CXCL8 and CCL20 mRNA level in MDA-MB-435S cells 6 h after pulse-treatment as in a. c, d ELISA for c CXCL8 and d CCL20 in 24 h conditioned media of MDA-MB-435S cells pulse-treated as in a. e Western blot analysis of indicated proteins from KPL-4 cells 2 h after pulse-treatment with 100 nM Tg with or without 30 min pre-treatment with 1 µM GSK-414. f qRT-PCR analysis of CXCL8 and CCL20 mRNA level from KPL-4 cells treated as in e. g ELISA of CXCL8 and CCL20 in 6 h conditioned media from KPL-4 cells treated as panel e. h ELISA of CXCL8 and CCL20 in 24 h conditioned media from MDA-MB-435S cells transfected with either control siRNA or two independent siRNAs against CEBPD and pulse treated with 100 nM Tg. i ELISA of CXCL8 and CCL20 in 6 h conditioned media from KPL4 cells transfected with either siSCR or siCEBPD and pulse treated with 100 nM Tg. Quantitative data are represented as mean±S.E.M, n = 3, *P < 0.05, **P < 0.01, ***P < 0.001.
Fig. 8
Fig. 8. Model summarizing the pathway described in this study along with known effects of CCL20 and CXCL8 signaling in the context of cancer.
Some of the relationships in this linear pathway may be the result of indirect mechanisms (indicated by dotted line) and/or also include the contribution of additional co-factors (not shown).

Similar articles

Cited by

References

    1. Luo B, Lee AS. The critical roles of endoplasmic reticulum chaperones and unfolded protein response in tumorigenesis and anticancer therapies. Oncogene. 2013;32:805–18. doi: 10.1038/onc.2012.130. - DOI - PMC - PubMed
    1. Hetz C. The unfolded protein response: controlling cell fate decisions under ER stress and beyond. Nat Rev Mol Cell Biol. 2012;13:89–102. doi: 10.1038/nrm3270. - DOI - PubMed
    1. Chevet E, Cameron PH, Pelletier MF, Thomas DY, Bergeron JJ. The endoplasmic reticulum: integration of protein folding, quality control, signaling and degradation. Curr Opin Struct Biol. 2001;11:120–4. doi: 10.1016/S0959-440X(00)00168-8. - DOI - PubMed
    1. Harding HP, Calfon M, Urano F, Novoa I, Ron D. Transcriptional and translational control in the Mammalian unfolded protein response. Annu Rev Cell Dev Biol. 2002;18:575–99. doi: 10.1146/annurev.cellbio.18.011402.160624. - DOI - PubMed
    1. Kaufman RJ. Orchestrating the unfolded protein response in health and disease. J Clin Invest. 2002;110:1389–98. doi: 10.1172/JCI0216886. - DOI - PMC - PubMed

Publication types

MeSH terms