. 2021 Nov 1;12(1):6277.
doi: 10.1038/s41467-021-26506-2.

A live measles-vectored COVID-19 vaccine induces strong immunity and protection from SARS-CoV-2 challenge in mice and hamsters

Affiliations

A live measles-vectored COVID-19 vaccine induces strong immunity and protection from SARS-CoV-2 challenge in mice and hamsters

Phanramphoei N Frantz et al. Nat Commun. .

Abstract

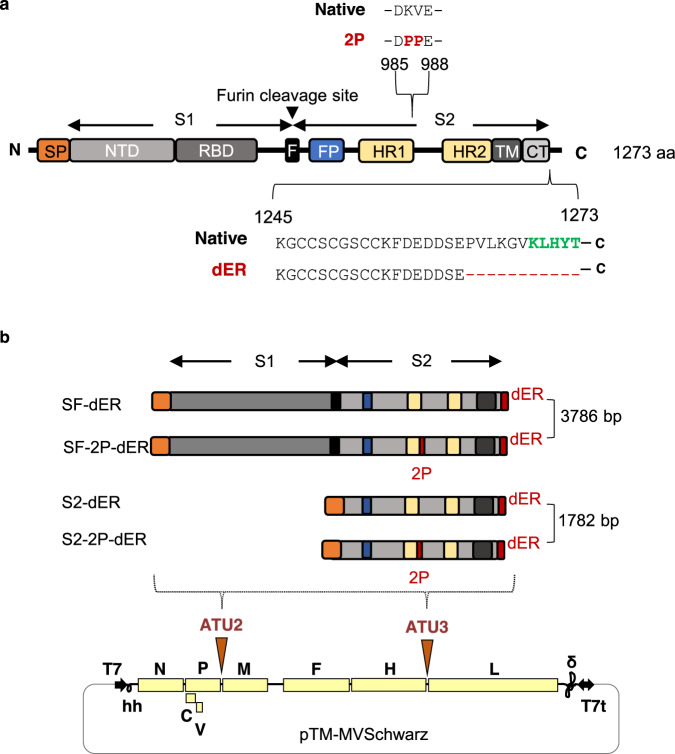
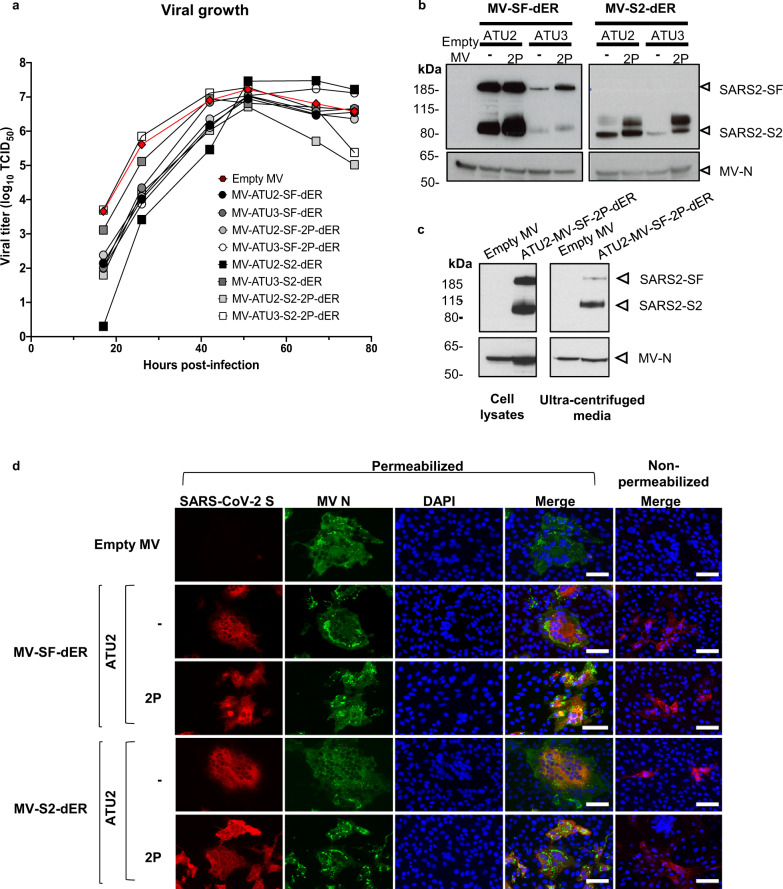
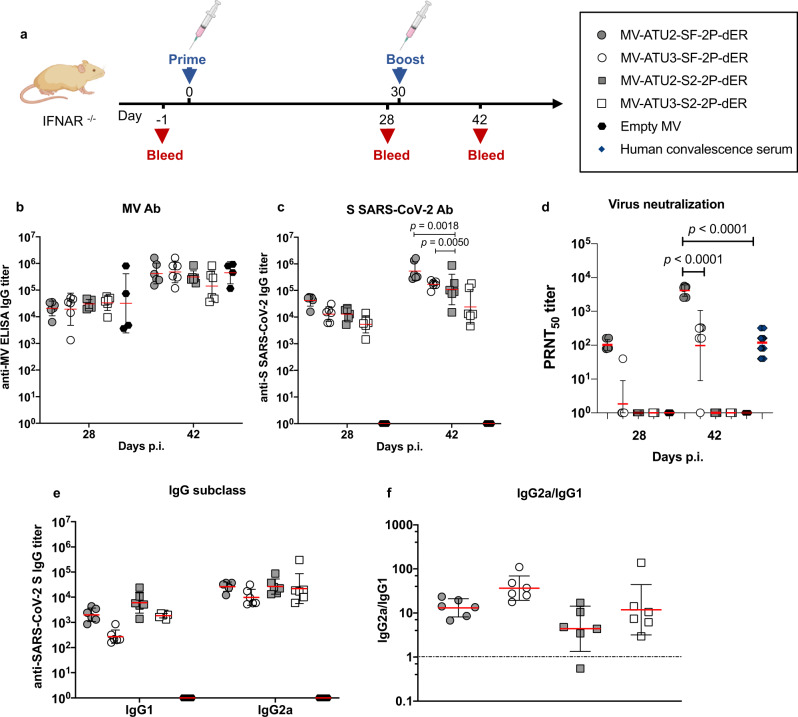
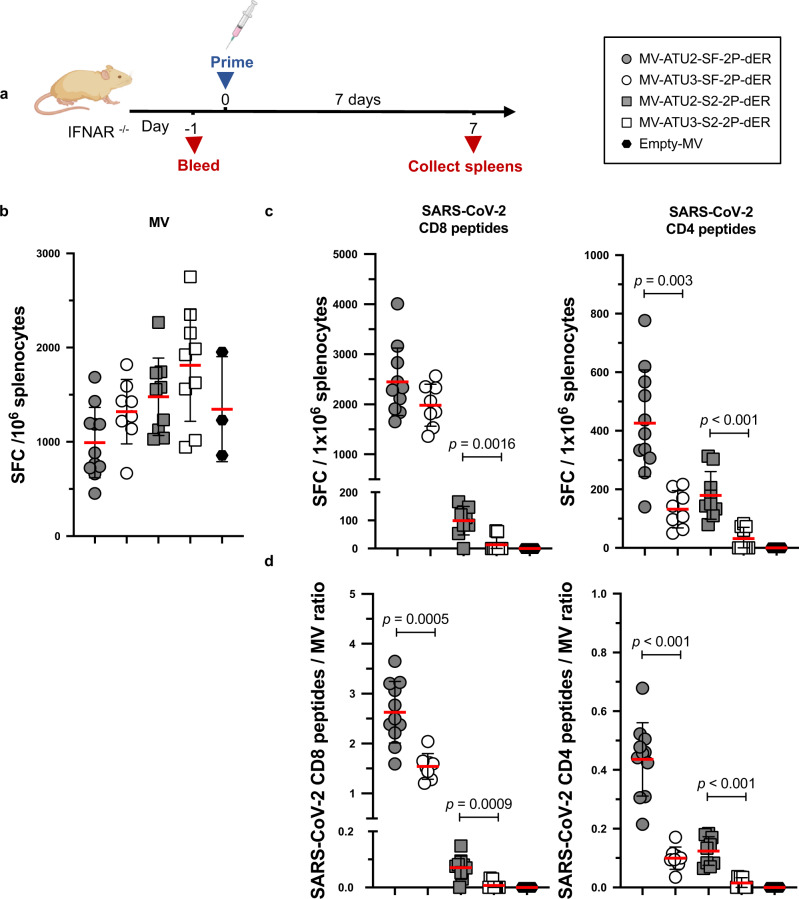
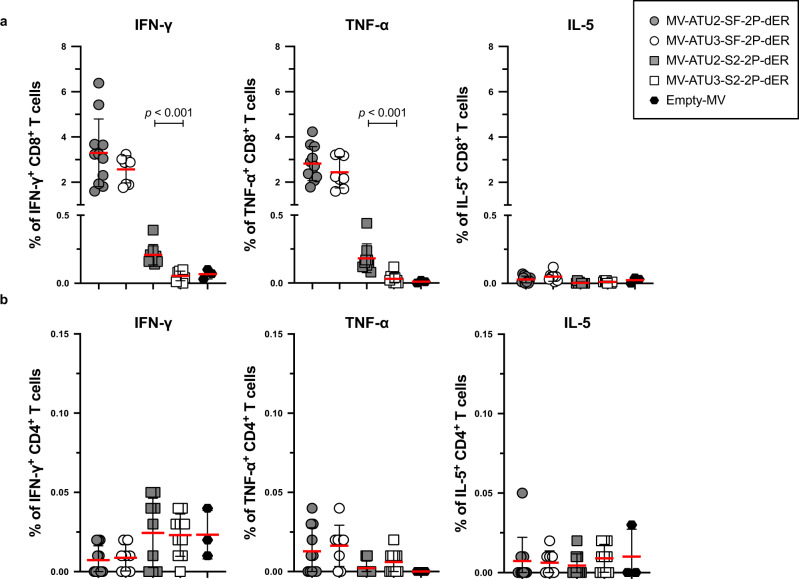
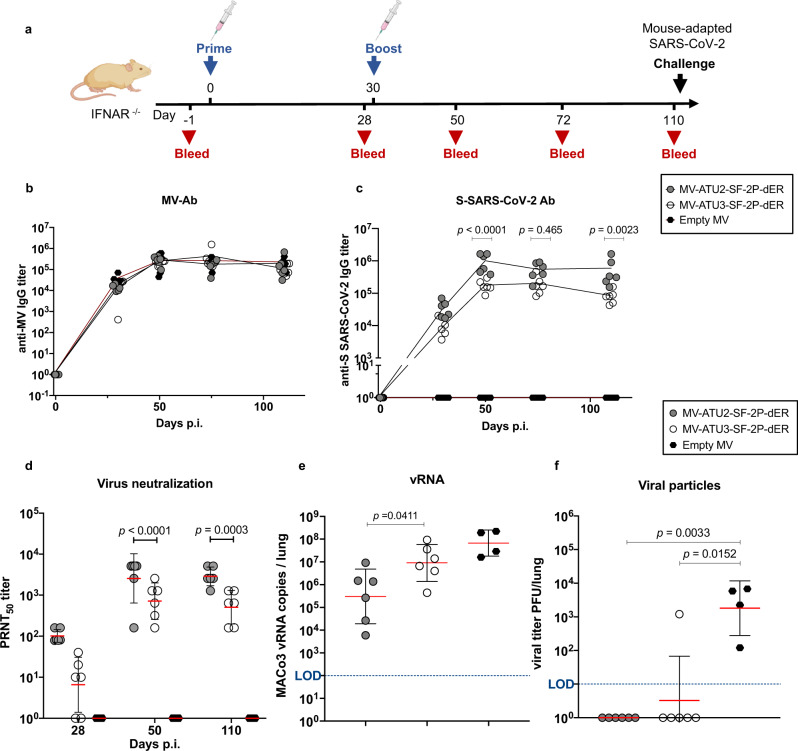
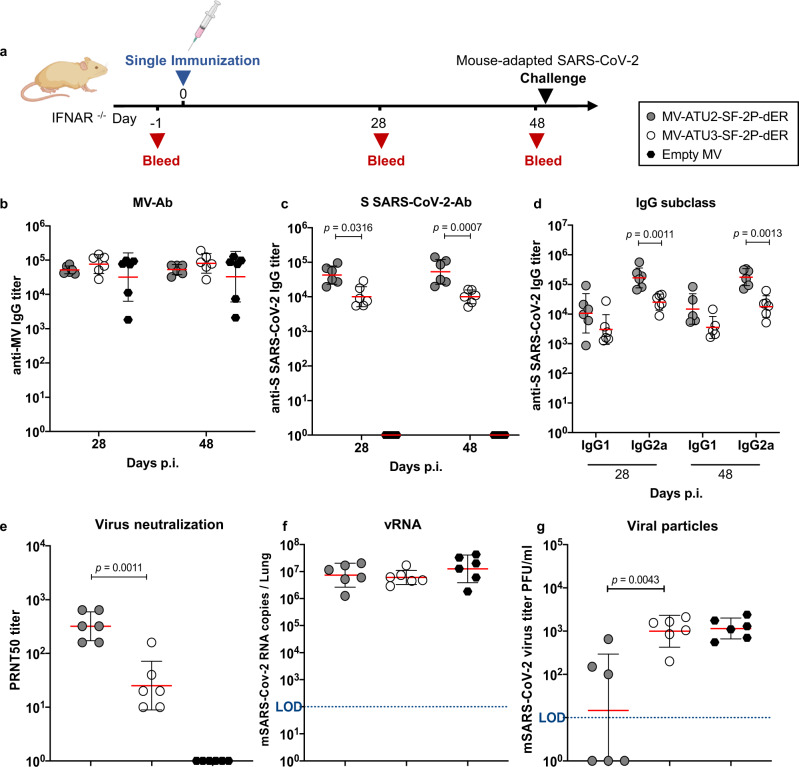
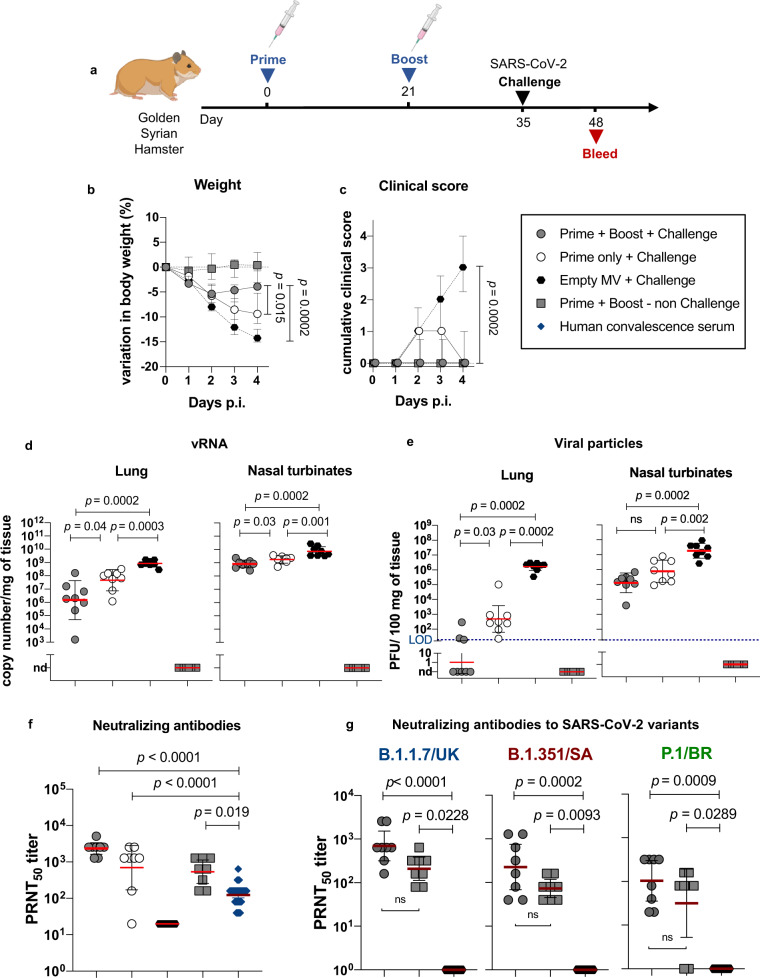
Several COVID-19 vaccines have now been deployed to tackle the SARS-CoV-2 pandemic, most of them based on messenger RNA or adenovirus vectors.The duration of protection afforded by these vaccines is unknown, as well as their capacity to protect from emerging new variants. To provide sufficient coverage for the world population, additional strategies need to be tested. The live pediatric measles vaccine (MV) is an attractive approach, given its extensive safety and efficacy history, along with its established large-scale manufacturing capacity. We develop an MV-based SARS-CoV-2 vaccine expressing the prefusion-stabilized, membrane-anchored full-length S antigen, which proves to be efficient at eliciting strong Th1-dominant T-cell responses and high neutralizing antibody titers. In both mouse and golden Syrian hamster models, these responses protect the animals from intranasal infectious challenge. Additionally, the elicited antibodies efficiently neutralize in vitro the three currently circulating variants of SARS-CoV-2.


Conflict of interest statement

F.T. and P.N.F. are inventors of a patent describing the vaccine constructs and filed by Institut Pasteur. All other authors declare no competing interests.

Figures

Fig. 1
Fig. 1. Schematic of the native S protein of SARS-CoV-2 and S gene constructs.
a The native S protein is 1273 amino acids (aa) in length. The protein contains 2 subunits, S1 and S2, generated by cleavage at the furin cleavage site (F). S1 contains the signal peptide (SP), N-terminal domain (NTD) and receptor-binding domain (RBD). S2 contains the fusion peptide (FP), heptad repeats 1 (HR1) and 2 (HR2), transmembrane domain (TM), and cytoplasmic tail (CT). The 2P indicates the two mutated prolines, K986P and V987P. The green letters indicate the endoplasmic reticulum retrieval signal (ERRS) motif, KxHxx, in the CT. dER indicates constructs carrying a deletion of the 11 C-terminal amino acids from the CT. b The native S gene of SARS-CoV-2 with notable domains indicated in color boxes relative to the S gene constructs cloned into the MV vector. 2P and dER modifications indicated by the red boxes. All S constructs were cloned into either the second (ATU2) or third (ATU3) additional transcription units of pTM-MVSchwarz (MV Schwarz), the MV vector plasmid. The MV genome comprises the nucleoprotein (N), phosphoprotein (P), V and C accessory proteins, matrix (M), fusion (F), hemagglutinin (H) and polymerase (L) genes. Plasmid elements include the T7 RNA polymerase promoter (T7), hammerhead ribozyme (hh), hepatitis delta virus ribozyme (∂), and T7 RNA polymerase terminator (T7t).
Fig. 2
Fig. 2. Characterization of S-expressing rMVs.
a Growth kinetics of rMV constructs used to infect Vero cells at an MOI of 0.1. Cell-associated virus titers are indicated in TCID50/ml. b Western blot analysis of SARS-CoV-2 S protein in cell lysates of Vero cells infected with the rMVs expressing SF-dER or S2-dER from either ATU2 or ATU3, with or without the 2P mutation. c Western blot analysis of ultracentrifuged media and cell lysates of Vero infected with rMV-ATU2-SF-2P-dER. d Immunofluorescence staining of Vero cells infected with the indicated rMVs 24 h after infection. Permeabilized or non-permeabilized cells were stained for S (red), MV N (green) and nuclei (blue); ×20 magnification (scale bar, 50 µm). The experiments shown were conducted using two or three biologically independent Vero cell batches.
Fig. 3
Fig. 3. Induction of humoral responses by prime-boost vaccination.
a Homologous prime-boost of IFNAR−/− mice (n = 6 or n = 4 for the empty MV control) immunized intraperitoneally with 1 × 105 TCID50 of the indicated rMV at days 0 and 28. Sera were collected 28 and 42 days after immunization and assessed for specific antibody responses to b MV antigens or c S-SARS-CoV-2 S. The data show the reciprocal endpoint dilution titers with each data point representing an individual animal. d Neutralizing antibody responses to SARS-CoV-2 virus expressed as 50% plaque reduction neutralization test (PRNT50) titers. e IgG subclass of S-specific antibody responses in mice 4 weeks after the first immunization. f Ratio of IgG2a/IgG1 responses. Data are represented as geometric mean with line and error bars indicating ±geometric SD. Statistical significance was determined by two-way ANOVA with Tukey’s multiple comparisons test.
Fig. 4
Fig. 4. Induction of S-specific cellular responses by rMV vaccination.
a IFNAR−/− mice were immunized by intraperitoneal injection with 1 × 105 TCID50 of MV-ATU2-SF-2P-dER, n = 11; MV-ATU3-SF-2P-dER, n = 8; MV-ATU2-S2-2P-dER, n = 9; MV-ATU3-S2-2P-dER, n = 9 and Empty MV, n = 3. Seven days after immunization, ELISPOT for IFNγ was performed on freshly extracted splenocytes. The data are shown as IFNγ-secreting cells or spot-forming cells (SFC) per 1 × 106 splenocytes detected after stimulating with b MV Schwarz or c SARS-CoV-2 S peptide pools specific to CD8+ or CD4+ T cells. d Ratio of IFNγ-secreting cells stimulated by CD4+ or CD8+ peptides to those stimulated by MV Schwarz. Each data point represents an individual mouse. Data are represented as mean with line and error bars indicating ±SD. Significant differences between the groups were determined by two-tailed the Mann–Whitney test.
Fig. 5
Fig. 5. Cytokine expression profile of T cells.
IFNAR−/− mice were immunized by intraperitoneal injection with 1 × 105 TCID50 of MV-ATU2-SF-2P-dER, n = 11; MV-ATU3-SF-2P-dER, n = 8; MV-ATU2-S2-2P-dER, n = 9; MV-ATU3-S2-2P-dER, n = 9 and Empty MV, n = 3. Seven days after immunization, splenocytes were stimulated with S-specific peptide pools. S-specific a CD8+ and b CD4+ T-cells were stained for intracellular IFNγ, TNFα and IL-5. Data are represented as mean with line and error bars indicating ±SD. Significant differences between the groups were determined by the two-tailed Mann–Whitney test.
Fig. 6
Fig. 6. Persistence of neutralizing antibodies and immune protection.
a Immunization and challenge schedule for IFNAR−/− mice (n = 6 and n = 4 in the control group; Empty MV). Animals were immunized interperitoneally by homologous prime-boost at days 0 and 28. Sera were collected at days 52, 72, and 110. Animals were challenged on day 110 by intranasal inoculation of mouse-adapted SARS-CoV-2 virus (MACo3) at 1.5 × 105 PFU. Sera were assessed for levels of specific antibodies against b MV and c SARS-CoV-2 S. d Neutralizing antibody responses against SARS-CoV-2 virus, expressed as 50% plaque reduction neutralization test (PRNT50) titers. e SARS-CoV-2 viral RNA copies detected by RT-qPCR in homogenized lungs of challenged animals, calculated as copies/lung. f Titer of infectious viral particles recovered from the homogenized lung of the immunized animals expressed as PFU/lung. Dotted blue line indicates the limit of detection (LOD). Data are represented as geometric means with line and error bars indicating ±geometric SD. Statistical significance was determined by (c, d) a two-way ANOVA with Tukey’s multiple comparisons test and (e) two-tailed the Mann–Whitney test (f) Kruskal–Wallis one-way ANOVA test with Dunn’s multiple comparison test.
Fig. 7
Fig. 7. Immune responses and protection after a single immunization.
a Immunization and challenge schedule for IFNAR−/− mice (n = 6). Animals were immunized interperitoneally on day 0. Sera were collected at days 24 and 48. Animals were challenged on day 48 by intranasal inoculation of mouse-adapted SARS-CoV-2 virus (MACo3) at 1.5 × 105 PFU. Sera were assessed for levels of specific antibodies to b MV and c S-SARS-CoV-2 protein. d Neutralizing antibody responses against SARS-CoV-2 virus, expressed as 50% plaque reduction neutralization test (PRNT50) titers. e SARS-CoV-2 viral RNA copies detected by RT-qPCR in homogenized lungs of challenged animals, calculated as copies/lung. f Titer of infectious viral particles recovered from the homogenized lung of the immunized animals expressed as PFU/lung. Dotted blue line indicates the limit of detection (LOD). Data are represented as geometric means with line and error bars indicating ±geometric SD. Statistical significance was determined by bd two-way ANOVA with Tukey’s multiple comparisons test, eg Kruskal–Wallis one-way ANOVA test with Dunn’s multiple comparison test.
Fig. 8
Fig. 8. MV-ATU2-SF-2P-dER immunization efficacy in golden Syrian hamsters.
a Immunization and challenge schedule for hamsters (n = 8/group). b Variation in the body weight of immunized and challenged hamsters. c Clinical score in immunized and challenged hamsters. The clinical score is based on a cumulative 0–4 scale: ruffled fur; slow movements; apathy; absence of exploration activity. d SARS-CoV-2 viral RNA copies detected by RT-qPCR at 4 dpi in homogenized lungs and nasal turbinates expressed as copy number/mg of tissue. e Titer of infectious viral particles recovered at 4 dpi from the homogenized lungs and nasal turbinates of the immunized animals expressed as PFU/100 mg of tissue. f Neutralizing antibody responses against SARS-CoV-2 virus, expressed as 50% plaque reduction neutralization test (PRNT50) titers. g Neutralizing antibodies against the UK (B.1.1.7), South African (B.1.351), and Brazilian (P.1) SARS-CoV-2 variants. Dotted blue line indicates the limit of detection (LOD). Nd: not detected. Data are represented as geometric means with line and error bars indicating ±geometric SD. Statistical significance was determined by Kruskal–Wallis one-way ANOVA test with Dunn’s multiple comparison test.
Fig. 9
Fig. 9. MV-ATU2-SF-2P-dER immunization protects SARS-CoV-2-challenged golden Syrian hamsters from lung pathology.
Histology and Immunohistochemistry of freshly collected lungs at 4 dpi from immunized and challenged hamsters (representative images of n = 8/group). Scale bars are embedded in the lower right corner of each image. a Hematoxylin and Eosin (H&E) stained whole-lung sections. b Bronchiolar epithelium sections. c Whole-lung sections immuno-stained with SARS-CoV-2 N antibody. d High magnification of the immuno-stained lung sections.

Similar articles

Cited by

References

    1. Baden LR, et al. Efficacy and safety of the mRNA-1273 SARS-CoV-2 vaccine. N. Engl. J. Med. 2021;384:403–416. doi: 10.1056/NEJMoa2035389. - DOI - PMC - PubMed
    1. Polack FP, et al. Safety and efficacy of the BNT162b2 mRNA Covid-19 vaccine. N. Engl. J. Med. 2020;383:2603–2615. doi: 10.1056/NEJMoa2034577. - DOI - PMC - PubMed
    1. Voysey M, et al. Single-dose administration and the influence of the timing of the booster dose on immunogenicity and efficacy of ChAdOx1 nCoV-19 (AZD1222) vaccine: a pooled analysis of four randomised trials. Lancet. 2021;397:881–891. doi: 10.1016/S0140-6736(21)00432-3. - DOI - PMC - PubMed
    1. Bhuiyan MU, et al. Epidemiology of COVID-19 infection in young children under five years: a systematic review and meta-analysis. Vaccine. 2021;39:667–677. doi: 10.1016/j.vaccine.2020.11.078. - DOI - PMC - PubMed
    1. Krammer F. SARS-CoV-2 vaccines in development. Nature. 2020;586:516–527. doi: 10.1038/s41586-020-2798-3. - DOI - PubMed

Publication types

MeSH terms