. 2021 Nov 1;12(1):6271.
doi: 10.1038/s41467-021-26571-7.

Control of osteocyte dendrite formation by Sp7 and its target gene osteocrin

Affiliations

Control of osteocyte dendrite formation by Sp7 and its target gene osteocrin

Jialiang S Wang et al. Nat Commun. .

Abstract

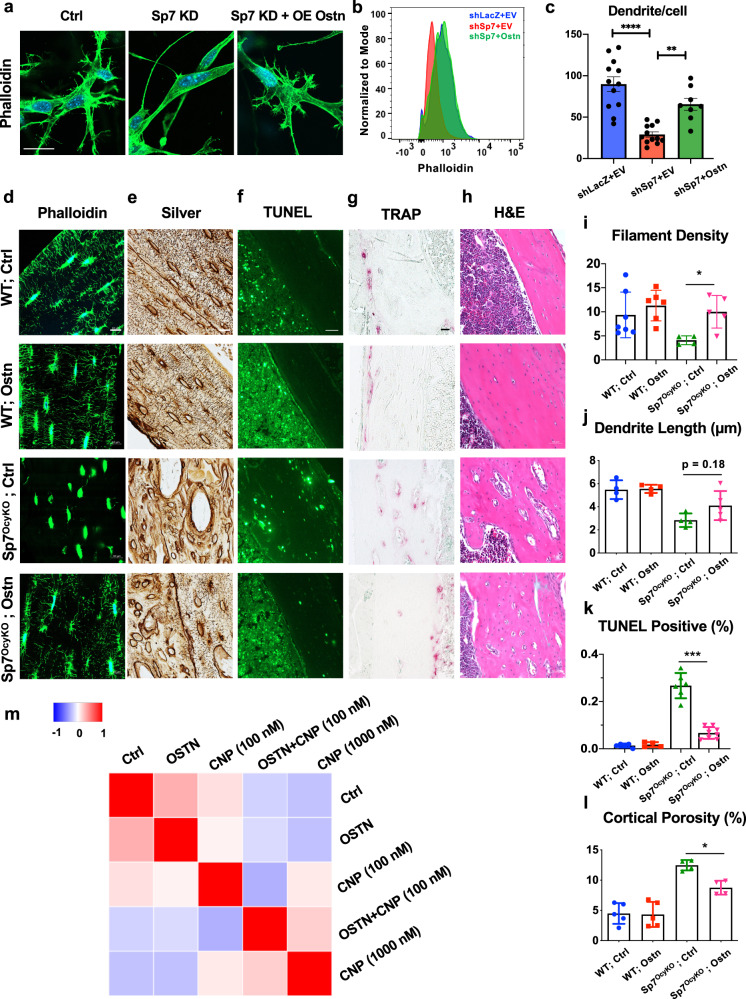
Some osteoblasts embed within bone matrix, change shape, and become dendrite-bearing osteocytes. The circuitry that drives dendrite formation during "osteocytogenesis" is poorly understood. Here we show that deletion of Sp7 in osteoblasts and osteocytes causes defects in osteocyte dendrites. Profiling of Sp7 target genes and binding sites reveals unexpected repurposing of this transcription factor to drive dendrite formation. Osteocrin is a Sp7 target gene that promotes osteocyte dendrite formation and rescues defects in Sp7-deficient mice. Single-cell RNA-sequencing demonstrates defects in osteocyte maturation in the absence of Sp7. Sp7-dependent osteocyte gene networks are associated with human skeletal diseases. Moreover, humans with a SP7R316C mutation show defective osteocyte morphology. Sp7-dependent genes that mark osteocytes are enriched in neurons, highlighting shared features between osteocytic and neuronal connectivity. These findings reveal a role for Sp7 and its target gene Osteocrin in osteocytogenesis, revealing that pathways that control osteocyte development influence human bone diseases.


Conflict of interest statement

The following authors declare the following competing interests: M.N.W. and H.M.K. receive research funding from Radius Health and Galapagos N.V. All other authors declare no competing interests.

Figures

Fig. 1
Fig. 1. Severe skeletal defects in Sp7OcyKO mice.
a Sp7 immunohistochemistry was performed on tibiae from 8-week-old control (Dmp1-Cre; Sp7+/+) and Sp7OcyKO (Dmp1-Cre; Sp7f/f) mice, quantification of Sp7-positive osteocytes is shown in e. b Cross-sectional µ-CT images from the femoral midshaft diaphysis reveal increased cortical porosity and reduced mineralization in Sp7OcyKO mice, quantified in f and g. c 8-week-old mice were labeled with calcein (green) and demeclocycline (red) 7 and 2 days prior to sacrifice, respectively. Non-decalcified sections from the cortical bone in the tibia were analyzed. Control mice show orderly endosteal bone formation. In contrast, Sp7OcyKO animals show abnormal intracortical bone formation. d TRAP-stained (red) paraffin-embedded sections from the tibia show an increased number of intracortical osteoclasts Sp7OcyKO in mice. h Cortical bone RANKL expression was measured by RT-qPCR. i Cryosections from 8-week-old control (Dmp1-Cre; Sp7+/+) and Sp7OcyKO (Dmp1-Cre; Sp7f/f) tibia were stained with phalloidin to visualize actin filaments, m shows quantification indicating reduced filament density (percent of acellular bone matrix occupied by phalloidin-positive filaments) in Sp7OcyKO mice. j In vivo third-generation harmonic imaging of the skull was performed to visualize osteocyte cell bodies and canaliculi in the skull. Quantification of defects in canaliculi/surface area and osteocyte–osteocyte connection is shown in no. kl Apoptosis in situ was analyzed on tibia sections by TUNEL staining and activated caspase-3 immunohistochemistry; both methods demonstrate increased osteocyte apoptosis in Sp7OcyKO mice versus controls. p, u show the quantification. q Hematoxylin and eosin-stained paraffin-embedded sections from the tibia show abnormal cortical porosity and empty osteocyte lacunae, quantified in st. r, v TUNEL staining (green) was performed on control (Dmp1-Cre; Sp7+/+, Ai14) and Sp7OcyKO (Dmp1-Cre; Sp7f/f, Ai14) mice. Thereafter, osteocyte filaments were visualized by tdTomato fluorescence within dendritic projections. Dendrite number was counted in TUNEL-positive (rare in control mice) and TUNEL-negative osteocytes. Reduced dendrite numbers are noted in non-apoptotic (TUNEL-negative) osteocytes lacking Sp7. *p < 0.05, **p < 0.01. ***p < 0.001, ****p < 0.0001. In graphs in eh, mp, and sv, each data point represents a biologically independent animal. Data are presented as mean values ±SEM. Two-sided student’s t tests were used without adjustment for multiple comparisons for all panels except u where two-way ANOVA was performed followed by Tukey’s multiple comparisons test. Exact p values for comparisons are as follows: e <0.0001, f <0.0001, g <0.0001, h 0.0384, m 0.0015, p 0.0118, s 0.0055, u 0.0014, v 0.0002. Formal statistical analysis was not performed for n, o where two mice per genotype were analyzed.
Fig. 2
Fig. 2. Sp7 is required for optimal dendrite formation in vitro.
a Control (shLacZ) and Sp7 knockdown (shSp7) MC3T3-E1 cells were cultured in standard (2D) or 3D (type I collagen gel) conditions, then stained with phalloidin (green) and DAPI (blue). In 3D culture, Sp7 knockdown cells show short dendrites (middle panel) with reduced complexity (right panel). Scale bars for 2D and 3D images represent 10 µm, scale bar for “spine” images represent 1 µm. b The number of dendrites per cell was measured in Sp7 knockdown and control cells grown in 3D culture. Each data point represents the dendrite number of an individually measured cell analyzed over three independent experiments. Two-sided student’s t test was used, **** indicates p < 0.0001. c Control and Sp7 knockdown Ocy454 cells were grown in 3D culture then stained with FITC-Phalloidin for flow cytometry. Reduced intracellular phalloidin staining is noted in Sp7 knockdown cells. d Growth curves for control and Sp7 knockdown Ocy454 cells (top) and MC3T3-E1 cells (bottom) were determined using a resavurin-based viability dye. n = 3 biologically independent samples were measured. e Control and Sp7 knockdown Ocy454 cells were analyzed in vitro for apoptosis and proliferation. Normal proliferation is noted based on EdU incorporation, whereas Sp7 knockdown cells show increased apoptosis. n = 3 biologically independent samples were measured. All data are presented as mean values ±SEM. Two-sided student’s t test was used, *** indicates p = 0.0001.
Fig. 3
Fig. 3. Sp7 controls the expression of genes involved in neuron projection development in osteocytes.
a RNA-seq was performed on control (shLacZ) and Sp7 knockdown (KD, top) and control (LV-GFP) and Sp7 overexpressing (OE, bottom) Ocy454 cells. Volcano plots demonstrate differentially expressed genes (red data points) in each comparison. See Supplementary Data 2. b Gene ontology analysis of genes downregulated by Sp7 knockdown (top) and upregulated by Sp7 overexpression (bottom) reveals enrichment in several terms associated with cell projection development and neuronal morphogenesis. Fisher’s exact test with correction for multiple comparisons was used to determine the significance of enriched gene ontology terms. ce Relationship between gene expression changes in response to Sp7 perturbation. Top, Venn diagram revealing number of genes regulated by both Sp7 overexpression and Sp7 knockdown. Middle, scatterplot showing fold change regulation of all detected genes by Sp7 knockdown (x-axis) and Sp7 overexpression (y axis). Bottom, RRHO2 visualization reveals statistically significant groups of genes counter-regulated by Sp7 knockdown versus overexpression. f Heatmap showing fold change regulation of individual genes in gene ontology groups of interest (neuron cell projection and axon guidance).
Fig. 4
Fig. 4. Definition of the osteocyte-specific Sp7 cistrome.
a Sp7 ChIP-seq was performed in Ocy454 cells, and Sp7-binding patterns were compared between Ocy454 cells and primary osteoblasts (POB). See also Supplementary Data 3. b Genomic distribution of cell type-specific Sp7-binding sites. c Gene ontology analysis of genes linked to Ocy454 cell-specific Sp7 peaks. Sp7 associates with regulatory regions of genes linked to motor neuron axon guidance and actin filament bundle assembly. d Ocy454 cell-specific Sp7-bound enhancer peaks were analyzed for the indicated histone modifications in d3 (POB) and d35 (Ocy) IDG-SW3 cells. See text for details. e Genes were categorized based on the presence of Ocy-specific Sp7 enhancer association in Ocy454 cells. Then, the effect of Sp7 shRNA (versus LacZ shRNA) was reported as the absolute value of the log2 fold change. Genes bound by Sp7 show, on average, a greater effect of Sp7 knockdown than genes without Sp7 enhancer binding sites. Two-tailed Welch’s t test was used, p < 0.0001. f De novo motif analysis of osteocyte-specific, osteoblast-specific, and shared distal Sp7 peaks. See also Supplementary Data 4 and 5. g 77 genes (Supplementary Data 6) are revealed by intersecting transcripts regulated by both Sp7 knockdown and overexpression in Ocy454 cells (FDR < 0.05, 146 genes) and genes with associated Ocy454 cell-specific Sp7 ChIP-seq peaks (6,648 genes).
Fig. 5
Fig. 5. Exogenous osteocrin rescues skeletal phenotypes associated with Sp7 deficiency.
ab Sp7 knockdown (KD) MC3T3-E1 cells were infected with control (empty vector) or osteocrin (LV-Ostn) lentiviruses followed by growth in 3D collagen gels and phalloidin (green) and DAPI (blue) staining. Osteocrin overexpression rescues phalloidin staining intensity to levels observed in control (shLacZ) cells. Scale bar represents 10 µm. c Dendrites number per cell was measured in the indicated cells grown in 3D collagen gel. Each data point represents the dendrite number of individual cells analyzed over three independent experiments. Data are presented as mean values ±SEM. Fisher’s exact test with correction for multiple comparisons was used to determine the significance of enriched gene ontology terms. Ordinary one-way ANOVA was used followed by Tukey’s multiple comparisons test. **** indicates p < 0.0001. ** indicates p = 0.0036. dh Control or Sp7OcyKO mice were injected with AAV8-control or AAV8-osteocrin viral particles at 3 weeks of age, then analyzed 3 weeks later for histologic analysis by phalloidin staining (d), silver staining (e), TUNEL (f), TRAP (g), or H & E (h). The scale bar in de is 10 µm. The scale bar in fh is 50 µm. All results are quantified in il. In these panels, each data point represents the indicated parameter measured in a biologically independent animal. Data are presented as mean values ±SEM. Ordinary one-way ANOVA with Dunnett’s correction was used to determine significance. Exact p values are: i 0.0292, j 0.178, k <0.0001, l 0.0236. m Cell painting similarity matrix of MC3T3-E1 cells treated with control, human OSTN peptide (500 nM), low-dose CNP (100 nM), OSTN (500 nM)+CNP (100 nM) and high-dose CNP (1000 nM). Cells treated with CNP plus OSTN and with high-dose CNP had distinct morphological differences from all other groups.
Fig. 6
Fig. 6. Single-cell transcriptomic profiling of mature osteoblasts and differentiating osteocytes highlights a key role for Sp7.
a Long bones were subjected to serial collagenase/EDTA digestions (see methods), and cells from fractions 5, 7, and 8 were collected for flow cytometry. Viable (DAPI-negative) tdTomato-positive cells were sorted followed by single-cell RNA-seq library construction. See also Supplementary Figs. 5 and 6. Cell-clustering from WT mice was performed. be Feature plots showing the expression of cluster-specific markers: Tnc (c3); Kcnk2 (c4); Dpysl3 (c5); Fbln7 (c6). fj RNA in situ hybridization of cluster-specific markers: Tnc, Kcnk2, Dpysl3, and Fbln7. Kcnk2 expression (red triangle) is primarily noted in endosteal cells that form a canopy around the osteoblast. Dpysl3 expression is noted in osteocytes close to bone surfaces (green) and a subpopulation of endosteal cells (blue). Fbln7 expression is noted only in embedded osteocytes (brown). Negative control: Dabp. k Integrated analysis of cells from WT (blue) and Sp7OcyKO (red) mice after down-sampling of WT library to match cellular representation seen in Sp7 mutant mice. l Feature plot showing Sp7 expression across 8 Ob/Ocy clusters. As expected, Sp7 expression is reduced in mutant mice. m Relative proportions (out of 1.0) in WT vs Sp7OcyKO mice. Sp7 mutants show reduced canonical osteoblasts (cluster 1), increased cells in clusters 3–5, and reduced cells in cluster 6 (mature osteocytes). Barnard’s exact test was used to determine the significance between genotypes. n Monocle3 analysis showing pseudotime trajectory mapping across tdTomato-positive cells in WT (left) and Sp7OcyKO (right) mice. Red arrows indicate Sp7-specific subpopulations in clusters 3 and 5, demonstrating apparently arrested differentiation. o Left: the expression of top 150 mature osteocyte markers (c6) was analyzed in a mouse brain single-cell RNA-seq atlas, where significant enrichment is found in aggregated expression values for neurons (p = 0.022) as compared against all other major cell type aggregated expression values. Right: the expression of the top 150 osteoblast marker (c1 + 2) was analyzed in a mouse brain single-cell RNA-seq atlas. OPC oligodendrocyte progenitor cell, Mitotic mitotic cells, Neurogenesis neurogenesis-associated cells. p Left: the expression of 77 osteocyte-specific Sp7 targets was analyzed in a mouse brain scRNA-seq atlas, where significant enrichment is found in aggregated expression values for neurons (p = 0.047) as compared against all other major cell type aggregated expression values. Right: the expression of 134 POB-specific Sp7 targets was analyzed in a mouse brain scRNA-seq atlas, where significant enrichment is found in aggregated expression values for neurons (p = 0.045) as compared against all other major cell type aggregated expression values. Wilcoxon rank-sum test was used in o and p, exact p values are listed above.
Fig. 7
Fig. 7. Sp7 and osteocyte-linked genes are associated with common and rare human skeletal diseases.
a Negative log Bonferroni-corrected p values obtained from the MAGMA gene-set analyses for all major cell types sampled from WT mice, shaded by effect size (BETA) values from the MAGMA gene-set regression. See Methods for a detailed description of the statistical methods used. b Association between skeletal dysplasia disease groups and genes enriched in the top mature osteocyte markers. Two disease groups are significantly enriched: “Other sclerosing bone disorder” (p = 0.016) and “abnormal mineralization” group (p = 0.039). c Locations of Sp7 and H3K27ac binding in the osteocrin regulatory region in Ocy454 cells and primary osteoblasts (POB). de Ostn_En2 activity is induced by WT, but not R316C, FLAG-tagged SP7 overexpression in HEK293T cells. Comparable expression of both FLAG-tagged SP7 versions is noted by immunoblotting, with GAPDH as a loading control. d each data point represents luciferase activity measured in a biologically independent sample. Data are presented as mean values±SEM. Ordinary one-way ANOVA followed by multiple comparisons test was used. *p = 0.0235, ***p = 0.0004. fh Non-decalcified iliac crest biopsy samples from age/sex-matched and Sp7R316C patient samples were silver-stained to assess osteocyte morphology. Results are quantified in gh where each data point represents the dendrite length or dendrite number from an individual osteocyte. Data are presented as mean values ±SEM. **** indicates p < 0.0001 for comparison between cells measured from controls and patients. i RT-qPCR in Ocy454 cells following overexpression of GFP, WT, and SP7R316C constructs. Each data point represents a biologically independent replicate. Data are presented as mean values ±SEM. Ordinary one-way ANOVA was used, exact p values are 0.0023 for Ostn and 0.0015 for Sost.

Similar articles

Cited by

References

    1. Ducy P, Schinke T, Karsenty G. The osteoblast: a sophisticated fibroblast under central surveillance. Science. 2000;289:1501–1504. doi: 10.1126/science.289.5484.1501. - DOI - PubMed
    1. Boyle WJ, Simonet WS, Lacey DL. Osteoclast differentiation and activation. Nature. 2003;423:337–342. doi: 10.1038/nature01658. - DOI - PubMed
    1. Robling AG, Bonewald LF. The osteocyte: new insights. Annu. Rev. Physiol. 2020;82:485–506. doi: 10.1146/annurev-physiol-021119-034332. - DOI - PMC - PubMed
    1. Dallas SL, Prideaux M, Bonewald LF. The osteocyte: an endocrine cell… and more. Endocr. Rev. 2013;34:658–690. doi: 10.1210/er.2012-1026. - DOI - PMC - PubMed
    1. Bonewald LF. The amazing osteocyte. J. Bone Min. Res. 2011;26:229–238. doi: 10.1002/jbmr.320. - DOI - PMC - PubMed

Publication types

MeSH terms