. 2021 Nov 1;11(1):21395.
doi: 10.1038/s41598-021-00512-2.

Intrinsic timescales across the basal ganglia

Affiliations

Intrinsic timescales across the basal ganglia

Simon Nougaret et al. Sci Rep. .

Abstract

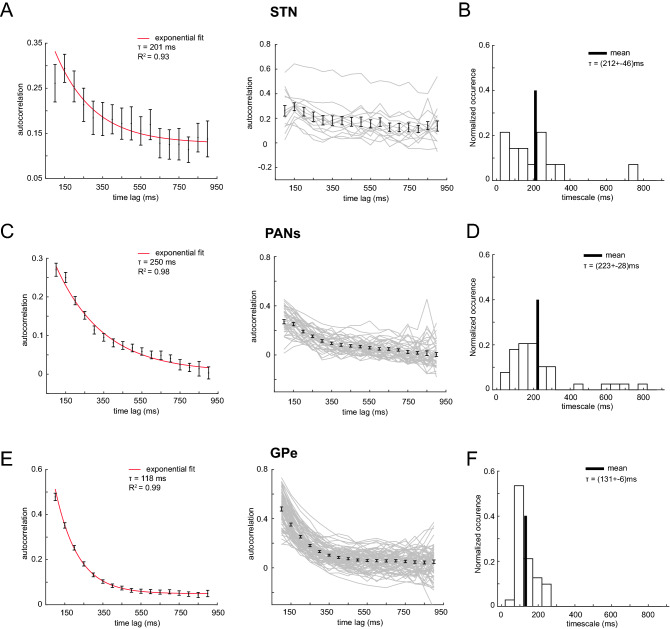
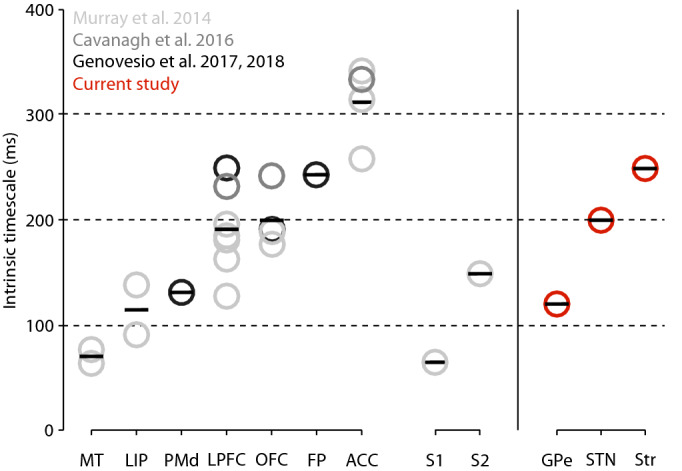
Recent studies have shown that temporal stability of the neuronal activity over time can be estimated by the structure of the spike-count autocorrelation of neuronal populations. This estimation, called the intrinsic timescale, has been computed for several cortical areas and can be used to propose a cortical hierarchy reflecting a scale of temporal receptive windows between areas. In this study, we performed an autocorrelation analysis on neuronal populations of three basal ganglia (BG) nuclei, including the striatum and the subthalamic nucleus (STN), the input structures of the BG, and the external globus pallidus (GPe). The analysis was performed during the baseline period of a motivational visuomotor task in which monkeys had to apply different amounts of force to receive different amounts of reward. We found that the striatum and the STN have longer intrinsic timescales than the GPe. Moreover, our results allow for the placement of these subcortical structures within the already-defined scale of cortical temporal receptive windows. Estimates of intrinsic timescales are important in adding further constraints in the development of computational models of the complex dynamics among these nuclei and throughout cortico-BG-thalamo-cortical loops.


Conflict of interest statement

The authors declare no competing interests.

Figures

Figure 1
Figure 1
Mean autocorrelation values and single timescale distribution. (A) Left Panel: mean autocorrelation averaged across all neurons (n = 14) recorded in the subthalamic nucleus (STN) using 50 ms time bins in a 900 ms time window during the baseline period (mean ± SEM). The solid red line is the exponential fit. The autocorrelation at 50 ms has been excluded from the fit procedure. The intrinsic timescale τ is shown in the top right corner, with the R2 value as a goodness of fit estimator. Right panel: single neuron autocorrelation structure (grey lines) with the mean and standard error bar for each time lag (black bars). (B) Single neuron timescale distribution for STN (n = 14) computed in the same baseline period as in the population timescale shown on the left panel. The solid line is the mean. The mean of the timescale distribution is shown in the top right corner with the standard error of the mean. The median of the distribution is 178 ms, while the mode gets two values, 50 ms and 200 ms. (C) Left Panel: mean autocorrelation averaged across neurons (n = 39) recorded in phasically active neurons (PANs) of the striatum in the same baseline period as (A). The autocorrelation value at 50 ms has been excluded from the fit procedure as in A). Right panel: same as in (A) right panel. (D) Single neuron timescale distribution for PANs (n = 39). The median of the distribution is 181 ms, while the mode gets two values, 50 ms and 150 ms. (E) Left Panel: mean autocorrelation averaged across neurons (n = 71) recorded in the external globus pallidus (GPe) in the same baseline period as (A) and (C). The autocorrelation values at all time lags have been included in the fit procedure. Right panel: same as in (A). (F) Single neuron timescale distribution for GPe neurons (n = 71). The median and mode of the distribution are 115 ms, and 100 ms, respectively.
Figure 2
Figure 2
Hierarchical organization of intrinsic timescales of cortical and subcortical structures. Left Panel: Intrinsic timescales of nine cortical areas reported by in light gray, by in medium gray, and by, in dark gray. The seven areas on the left (MT, LIP, PMd, LPFC, OFC, FP, and ACC) are part of the visual and prefrontal cortices. The two areas on the right are part of the somatosensory cortex (S1, S2). Each circle represents the average τ for each cortical area reported in each study. Each bar represents the average τ among the studies. Right Panel: Same representation for the three subcortical structures (GPe, STN, and striatum) analyzed in the present study. ACC, anterior cingulate cortex; FP, frontopolar cortex; GPe, external globus pallidus; LIP, lateral intraparietal cortex; LPFC, lateral prefrontal cortex; MT, medio-temporal area (of visual cortex); OFC, orbitofrontal cortex; PMd, dorsal premotor cortex; S1, primary somatosensory cortex; S2, secondary somatosensory cortex; STN, subthalamic nucleus.

References

    1. Felleman DJ, Van Essen DC. Distributed hierarchical processing in the primate cerebral cortex. Cereb. Cortex. 1991;1:1–47. doi: 10.1093/cercor/1.1.1. - DOI - PubMed
    1. Barbas H, Rempel-Clower N. Cortical structure predicts the pattern of corticocortical connections. Cereb. Cortex. 1997;7:635–646. doi: 10.1093/cercor/7.7.635. - DOI - PubMed
    1. Petroni F, Panzeri S, Hilgetag CC, Kötter R, Young MP. Simultaneity of responses in a hierarchical visual network. NeuroReport. 2001;12:2753–2759. doi: 10.1097/00001756-200108280-00032. - DOI - PubMed
    1. Murray JD, et al. A hierarchy of intrinsic timescales across primate cortex. Nat. Neurosc. 2014;17:1661–1663. doi: 10.1038/nn.3862. - DOI - PMC - PubMed
    1. Ogawa T, Komatsu H. Differential temporal storage capacity in the baseline activity of neurons in macaque frontal eye field and area V4. J. Neurophysiol. 2010;103:2433–2445. doi: 10.1152/jn.01066.2009. - DOI - PubMed

Publication types