. 2021 Nov 1;11(1):21341.
doi: 10.1038/s41598-021-00597-9.

Unreferenced spatial localization under monocular and dichoptic viewing conditions

Affiliations

Unreferenced spatial localization under monocular and dichoptic viewing conditions

Apoorva Karsolia et al. Sci Rep. .

Abstract

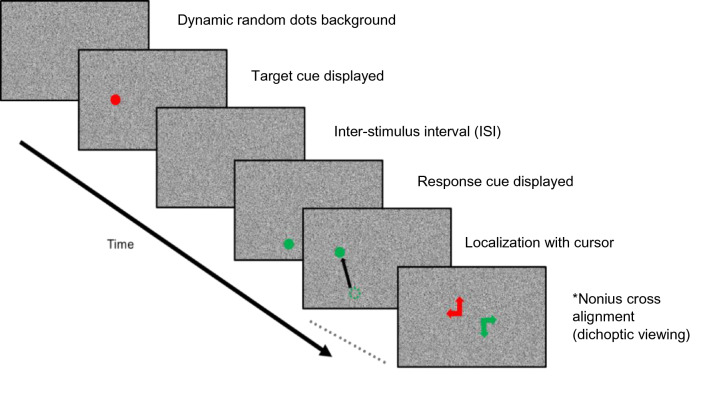
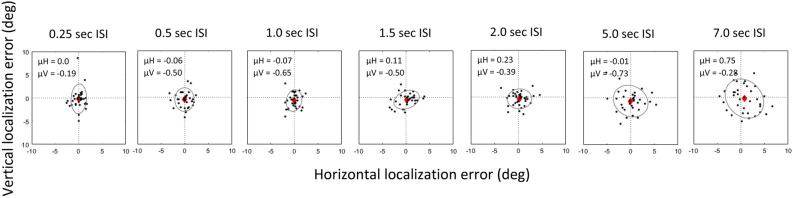
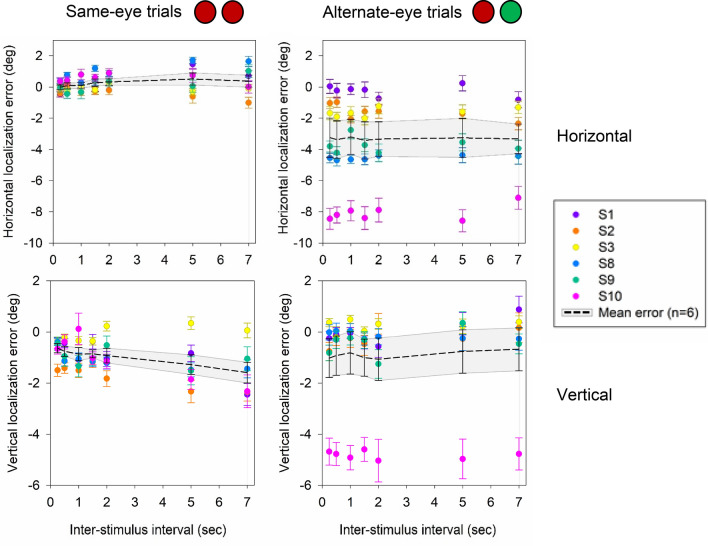
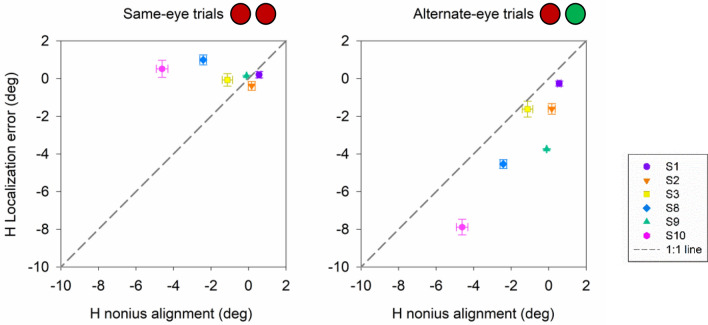
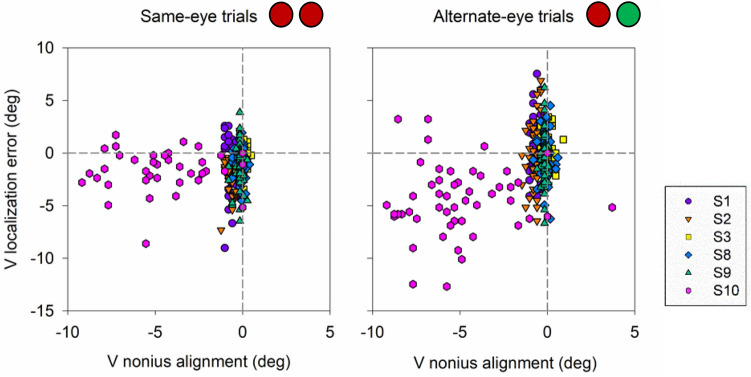
Knowledge of eye position in the brain is critical for localization of objects in space. To investigate the accuracy and precision of eye position feedback in an unreferenced environment, subjects with normal ocular alignment attempted to localize briefly presented targets during monocular and dichoptic viewing. In the task, subjects' used a computer mouse to position a response disk at the remembered location of the target. Under dichoptic viewing (with red (right eye)-green (left eye) glasses), target and response disks were presented to the same or alternate eyes, leading to four conditions [green target-green response cue (LL), green-red (LR), red-green (RL), and red-red (RR)]. Time interval between target and response disks was varied and localization errors were the difference between the estimated and real positions of the target disk. Overall, the precision of spatial localization (variance across trials) became progressively worse with time. Under dichoptic viewing, localization errors were significantly greater for alternate-eye trials as compared to same-eye trials and were correlated to the average phoria of each subject. Our data suggests that during binocular dissociation, spatial localization may be achieved by combining a reliable versional efference copy signal with a proprioceptive signal that is unreliable perhaps because it is from the wrong eye or is too noisy.


Conflict of interest statement

The authors declare no competing interests.

Figures

Figure 1
Figure 1
Sequence of events for a trial (monocular or dichoptic paradigm). Two 1.5° diameter circles (red—target cue; and green—response cue) were displayed in sequence, on a random dot background, with a variable inter-stimulus interval (ISI = 0.25, 0.5, 1, 1.5, 2, 5, and 7 s). Subjects then used a mouse cursor (black arrow; not visible during the trial) to mark the remembered location of the target cue. Red and green nonius lines were displayed after every 5th trial during the dichoptic viewing paradigm, and subjects were asked to align the two lines to provide an estimate of the phoria.
Figure 2
Figure 2
Scatter plot displaying horizontal and vertical localization error across inter-stimulus interval (S6) under monocular viewing conditions. Black dots represent the error in localization for each trial. Red diamond marks the mean horizontal and vertical error in localization across trials providing an estimate of accuracy of localization. BCEA (precision of localization) is the area represented by the grey ellipse.
Figure 3
Figure 3
Mean horizontal and vertical localization error across inter-stimulus interval (0.25, 0.5, 1.0, 1.5, 2, 5 and 7 s). Black dashed line represents the mean localization error and grey shading represents the standard error of localization for all subjects (n = 9). Each color represents the mean and standard error of horizontal and vertical error in localization for each subject.
Figure 4
Figure 4
Relationship between BCEA and inter-stimulus interval. Black triangles represent the mean and standard error in BCEA across subjects. (n = 9). Each color represents the BCEA for a single subject. The black line denotes the linear regression fit.
Figure 5
Figure 5
Scatter plot displaying horizontal and vertical localization error across inter-stimulus interval (0.25, 0.5, 1, 1.5, 2, 5, and 7 s left to right) under dichoptic viewing conditions in one subject (S8). LL, RR, LR and RL indicate which eye viewed the target disk and response disk. The bottom two rows show conditions where the disks were seen by alternate eyes (LR and RL). Black dots represent the error in localization for each trial. Red diamond marks the mean horizontal and vertical error in localization across trials. BCEA is represented by the grey ellipse.
Figure 6
Figure 6
Scatter plot displaying the mean horizontal and vertical localization error across inter-stimulus interval for same eye (LL and RR) and alternate eye (LR and RL) conditions. Black dashed line represents the mean localization error and grey shading represents the standard error of localization for all subjects (n = 6). Each color represents the mean and standard error of horizontal and vertical error in localization for a single subject.
Figure 7
Figure 7
Scatter plot displaying BCEA and relationship with inter-stimulus interval (n = 6) for same-eye and alternate-eye conditions. Black triangles represent the mean and standard error in BCEA across subjects. Each color represents the BCEA for an individual subject. The black line denotes the model fit.
Figure 8
Figure 8
Scatter plot displaying correlation between horizontal nonius alignment and horizontal localization error (n = 6) for same-eye and alternate-eye viewing conditions. Color and shapes represent the mean and standard errors from individual subjects. Grey line is the 1:1 line.
Figure 9
Figure 9
Scatter plot displaying correlation between vertical nonius alignment and vertical localization error (n = 6) for same-eye and alternate-eye viewing conditions. Color and shapes represent the mean and standard errors from individual subjects. Grey line is the 1:1 line.
Figure 10
Figure 10
Scatter plot displaying trial by trial correlation, of every 5th trial, between horizontal nonius alignment and horizontal localization error (n = 6) for same-eye and alternate-eye viewing conditions. Each color and shape represents the data for each trial performed by each subject.
Figure 11
Figure 11
Scatter plot displaying trial by trial correlation, of every 5th trial, between vertical nonius alignment and vertical localization error (n = 6) for same-eye and alternate-eye viewing conditions. Each color and shape represents the data for each trial performed by each subject.

Similar articles

References

    1. Young LR, Stark L. A discrete model for eye tracking movements. IEEE Trans. Military Electron. 1963;MIL-7:113–115. doi: 10.1109/TME.1963.4323060. - DOI
    1. Duhamel JR, Goldberg ME, Fitzgibbon EJ, Sirigu A, Grafman J. Saccadic dysmetria in a patient with a right frontoparietal lesion. The importance of corollary discharge for accurate spatial behaviour. Brain J. Neurol. 1992;115(PT 5):1387–1402. doi: 10.1093/brain/115.5.1387. - DOI - PubMed
    1. Hallett PE, Lightstone AD. Saccadic eye movements to flashed targets. Vision. Res. 1976;16:107–114. doi: 10.1016/0042-6989(76)90084-5. - DOI - PubMed
    1. Wurtz RH. Neuronal mechanisms of visual stability. Vision. Res. 2008;48:2070–2089. doi: 10.1016/j.visres.2008.03.021. - DOI - PMC - PubMed
    1. Wurtz RH. Corollary discharge contributions to perceptual continuity across saccades. Annu. Rev. Vision Sci. 2018;4:215–237. doi: 10.1146/annurev-vision-102016-061207. - DOI - PubMed

Publication types