. 2021 Nov 1;11(1):21417.
doi: 10.1038/s41598-021-00748-y.

Probabilistic modelling of effects of antibiotics and calendar time on transmission of healthcare-associated infection

Affiliations

Probabilistic modelling of effects of antibiotics and calendar time on transmission of healthcare-associated infection

Mirjam Laager et al. Sci Rep. .

Abstract

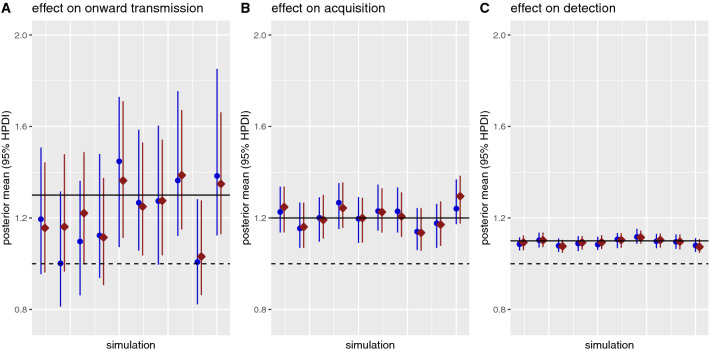
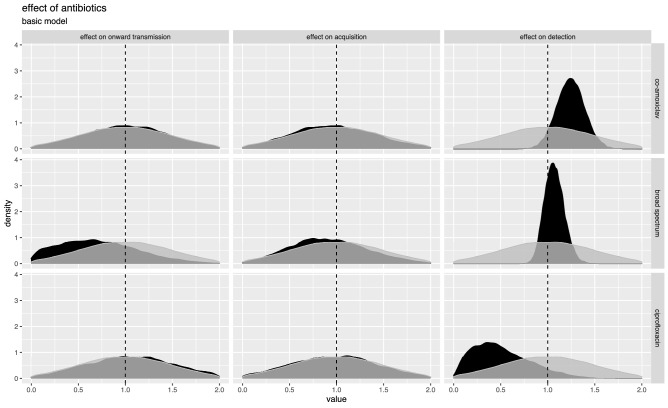
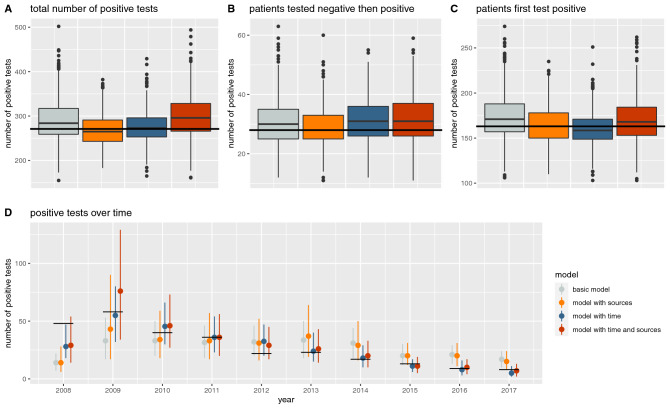
Healthcare-associated infection and antimicrobial resistance are major concerns. However, the extent to which antibiotic exposure affects transmission and detection of infections such as MRSA is unclear. Additionally, temporal trends are typically reported in terms of changes in incidence, rather than analysing underling transmission processes. We present a data-augmented Markov chain Monte Carlo approach for inferring changing transmission parameters over time, screening test sensitivity, and the effect of antibiotics on detection and transmission. We expand a basic model to allow use of typing information when inferring sources of infections. Using simulated data, we show that the algorithms are accurate, well-calibrated and able to identify antibiotic effects in sufficiently large datasets. We apply the models to study MRSA transmission in an intensive care unit in Oxford, UK with 7924 admissions over 10 years. We find that falls in MRSA incidence over time were associated with decreases in both the number of patients admitted to the ICU colonised with MRSA and in transmission rates. In our inference model, the data were not informative about the effect of antibiotics on risk of transmission or acquisition of MRSA, a consequence of the limited number of possible transmission events in the data. Our approach has potential to be applied to a range of healthcare-associated infections and settings and could be applied to study the impact of other potential risk factors for transmission. Evidence generated could be used to direct infection control interventions.


Conflict of interest statement

The authors declare no competing interests.

Figures

Figure 1
Figure 1
Posterior estimates of the effect of antibiotics on onward transmission, acquisition and detection in 10 simulated datasets. The true values are indicated by the solid horizontal lines. Each dataset was analysed with the model using positive and negative swabs only (blue circles) and using typing information (red squares, assuming 4 types were present at equal frequency). The dashed horizontal lines indicate 1 (i.e. no effect). HPDI, highest posterior density interval.
Figure 2
Figure 2
Change in transmission and importation of MRSA in an Oxford ICU, 2008–2017: posterior estimates from four different models. The top panels show point estimates (solid lines) and highest posterior density intervals (ribbons) of the transmission (A) and importation (B) parameters from the models with constant transmission and importation without (grey) and with (orange) considering antibiograms as typing data, and the models with time dependent transmission and importation without (blue) and with (red) antibiograms. The bottom panels show the posterior mean estimates of the number of patients estimated to have been colonised due to acquisition (C) and importation (D). The models without typing data (grey and blue) estimated very similar numbers of acquisitions and importations.
Figure 3
Figure 3
Effects of antibiotics on acquisition, onward transmission and MRSA detection in an Oxford ICU, 2008–2017. Posterior estimates are shown in black and prior distributions in grey. The plot is based on a model without time-dependent transmission or importation parameters or typing data. Alternative plots for these models are very similar and shown in Supplementary Figs. S7–S9.
Figure 4
Figure 4
Posterior predictive checks. The number of positive tests in the true patient data (black lines) is compared to the positive tests in 1000 simulated datasets (boxplots, mean and interquartile range). D shows the number of positive tests for each year in the true patient data (black lines) and in 1000 simulated datasets (median and 0.9 credible interval).

References

    1. Duerden, B., Fry, C., Johnson, A. P. & Wilcox, M. H. The control of methicillin-resistant Staphylococcus aureus blood stream infections in england. Open Forum Infectious Diseases2 (2015). - PMC - PubMed
    1. Seppälä H, et al. The effect of changes in the consumption of macrolide antibiotics on erythromycin resistance in group A streptococci in Finland. N. Engl. J. Med. 1997;337:441–446. doi: 10.1056/NEJM199708143370701. - DOI - PubMed
    1. van Bijnen, E. M. E. et al. Antibiotic exposure and other risk factors for antimicrobial resistance in nasal commensal Staphylococcus aureus: An ecological study in 8 European countries. PLOS ONE10, e0135094 (2015). - PMC - PubMed
    1. Vernaz N, et al. Temporal effects of antibiotic use and hand rub consumption on the incidence of MRSA and Clostridium difficile. J. Antimicrob. Chemother. 2008;62:601–607. doi: 10.1093/jac/dkn199. - DOI - PubMed
    1. Aldeyab, M. A. et al. Modelling the impact of antibiotic use and infection control practices on the incidence of hospital-acquired methicillin-resistant Staphylococcus aureus: A time-series analysis. J. Antimicrob. Chemother.62, 593–600. - PubMed

Publication types

MeSH terms

Substances