. 2021 Nov;18(11):1333-1341.
doi: 10.1038/s41592-021-01282-5. Epub 2021 Nov 1.

Single-cell chromatin state analysis with Signac

Affiliations

Single-cell chromatin state analysis with Signac

Tim Stuart et al. Nat Methods. 2021 Nov.

Erratum in

Abstract

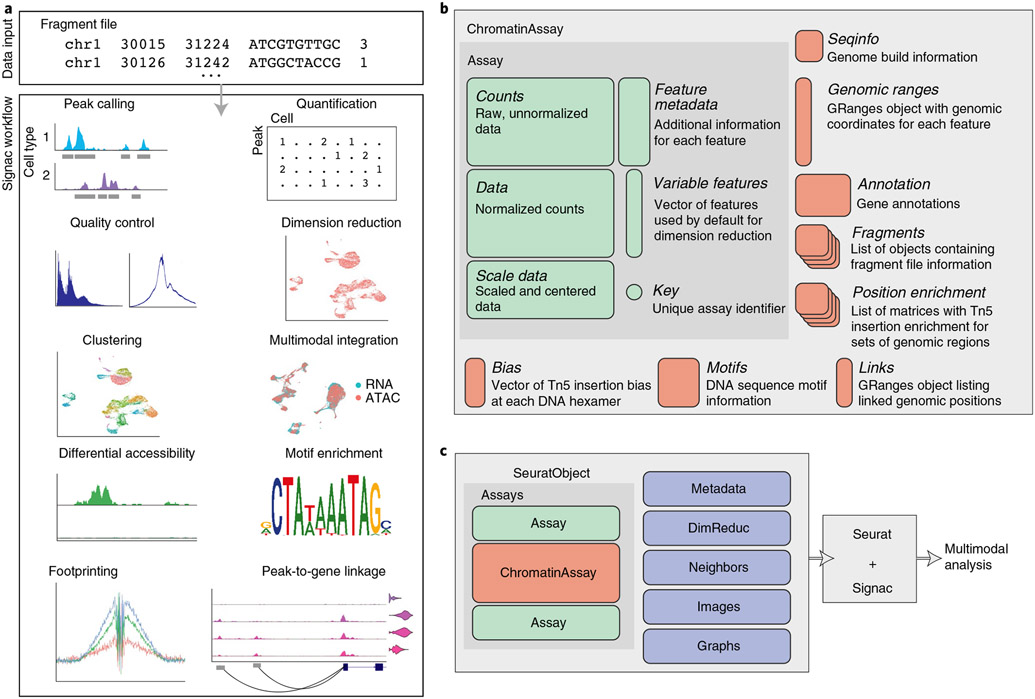
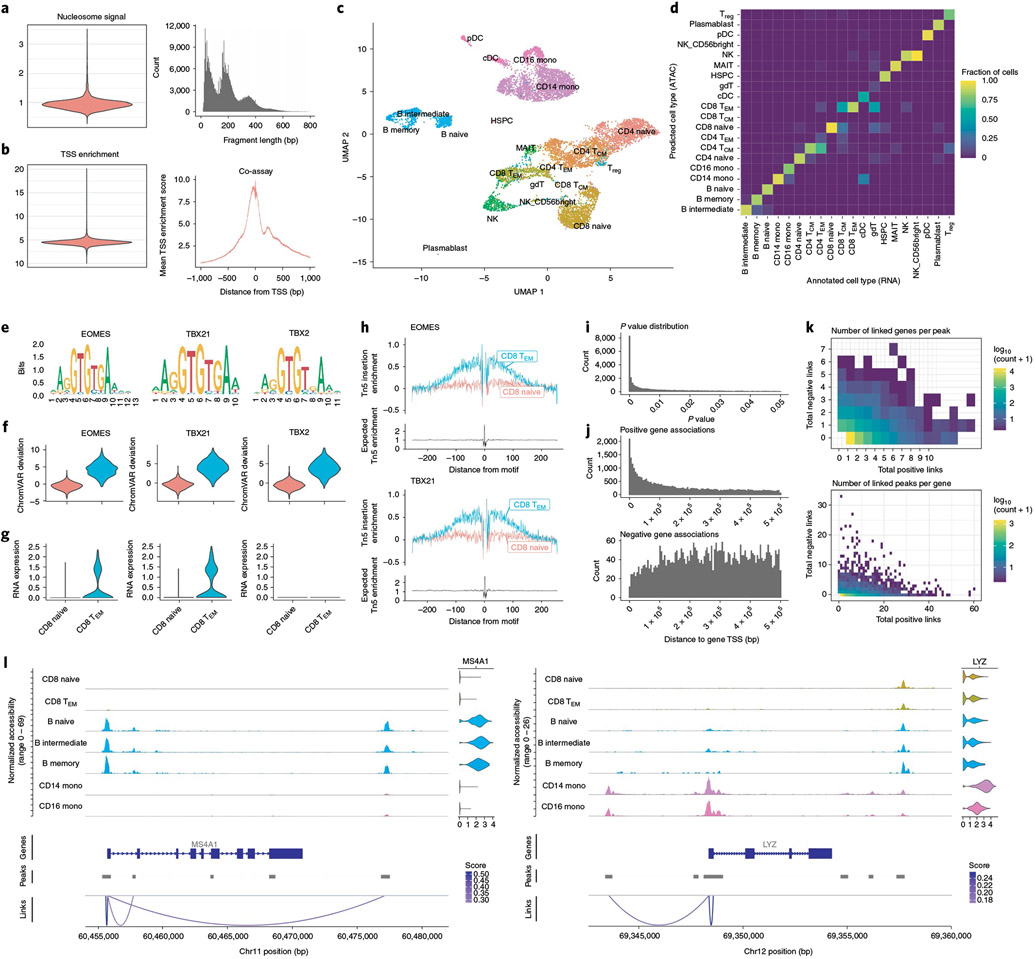
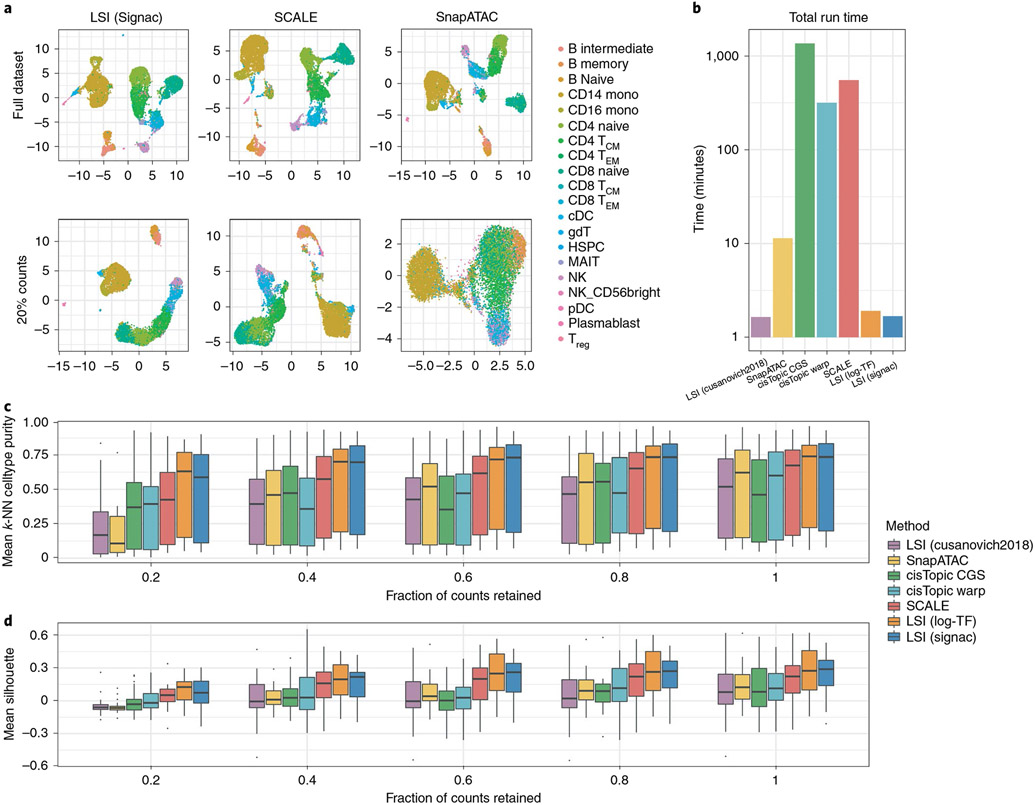
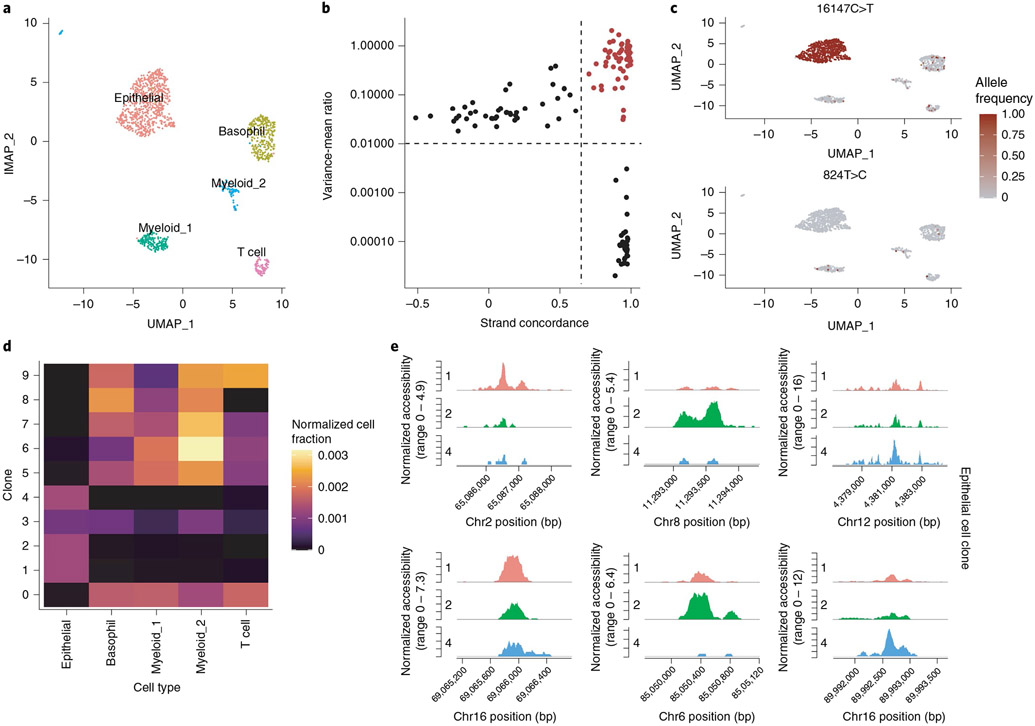
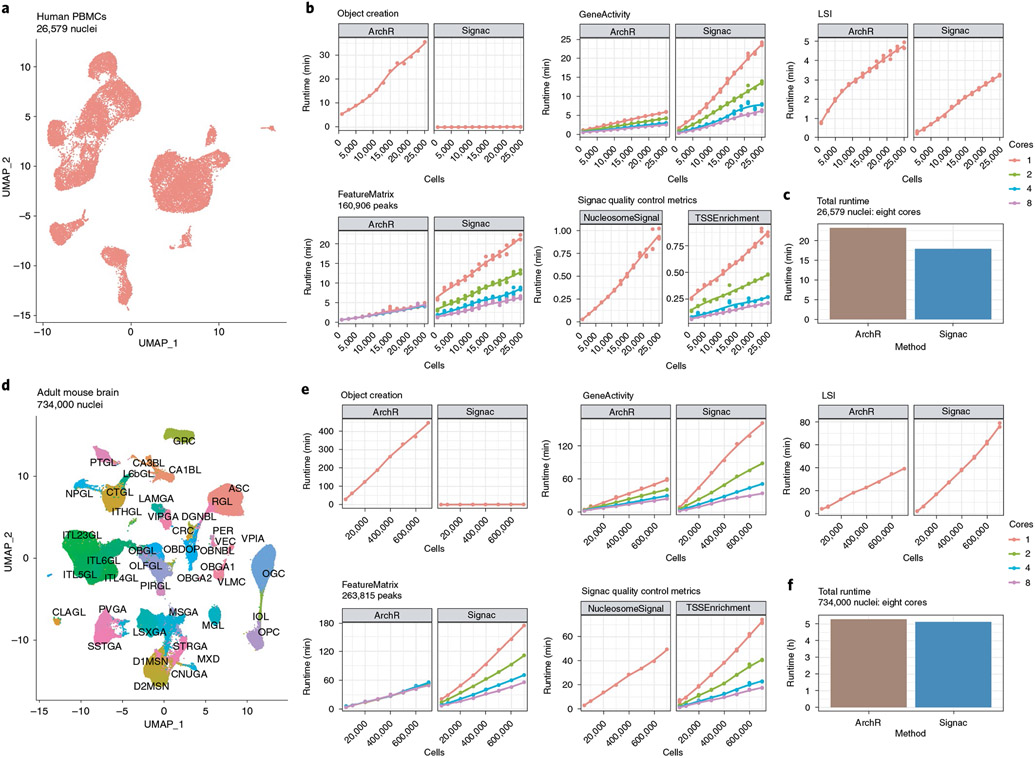
The recent development of experimental methods for measuring chromatin state at single-cell resolution has created a need for computational tools capable of analyzing these datasets. Here we developed Signac, a comprehensive toolkit for the analysis of single-cell chromatin data. Signac enables an end-to-end analysis of single-cell chromatin data, including peak calling, quantification, quality control, dimension reduction, clustering, integration with single-cell gene expression datasets, DNA motif analysis and interactive visualization. Through its seamless compatibility with the Seurat package, Signac facilitates the analysis of diverse multimodal single-cell chromatin data, including datasets that co-assay DNA accessibility with gene expression, protein abundance and mitochondrial genotype. We demonstrate scaling of the Signac framework to analyze datasets containing over 700,000 cells.


Figures

Fig. 1 ∣
Fig. 1 ∣. Single-cell chromatin analysis workflow with Signac.
a, Overview of key steps comprising analysis of single-cell chromatin data with Signac. All analysis tasks can be completed with one or multiple fragment files as input. b, Design of a custom Assay for single-cell chromatin data. We designed a specialized ChromatinAssay class with the capacity to store data required for analysis of single-cell chromatin datasets. c, ChromatinAssay objects can be stored side by side with standard Assay objects in a Seurat object to enable analysis of multimodal single-cell data.
Fig. 2 ∣
Fig. 2 ∣. Integrative single-cell analysis of gene expression and DNA accessibility in human PBMCs.
a, Nucleosome signal QC metric distribution and DNA fragment length distribution for the DNA accessibility assay. b, TSS enrichment score distribution and Tn5 insertion frequency at TSS sites for the DNA accessibility assay. c, UMAP representation of the multimodal human PBMC dataset, with cells annotated by predicted cell type. UMAP was constructed from the DNA accessibility assay. Treg, regulatory T cell; TEM, effector memory T cell; cDC, conventional dendritic cell; pDC, plasmacytoid dendritic cell; HSPC, hematopoietic stem and progenitor cell; MAIT, mucosal-associated invariant T cell. d, Multimodal label transfer accuracy. Multimodal single-cell data were split into DNA accessibility and gene expression assays and multimodal label transfer performed between pseudo-scRNA-seq and pseudo-scATAC-seq datasets. e, DNA sequence motifs for top overrepresented TF motifs between CD8+ effector and naive T cells. f, chromVAR deviations for top enriched DNA sequence motifs (EOMES, TBX21, TBX2) for CD8+ effector (CD8 TEM) and naive CD8+ (CD8 naive) T cells. g, RNA expression for EOMES, TBX21 and TBX2 genes in CD8+ effector and naive T cells. h, TF footprinting analysis for EOMES and TBX21 motifs sites. i, Distribution of peak-to-gene link P values for all reported links. P values were determined by a one-sided z-test without multiple testing correction. j, Distances from peak to linked gene TSSs, for positive- and negative-coefficient peak–gene links. k, Total number of positive-coefficient and negative-coefficient peak–gene links for each linked gene (top) and peak (bottom). l, Representative example peak–gene links for key immune genes.
Fig. 3 ∣
Fig. 3 ∣. Evaluation of dimension reduction methods for single-cell chromatin data.
a, UMAP representations of reduced-dimension single-cell DNA accessibility data for LSI (Signac), SCALE and SnapATAC for the full dataset and with the total number of counts per cell downsampled to 20% of the total counts. b, Runtimes for each of the dimension reduction methods profiled. CisTopic CGS, cisTopic collapsed Gibbs sampling; cisTopic Warp: cisTopic Warp-LDA. c, Mean k-NN cell type purity (k = 100) and (d) mean Silhouette score for each cell type in the dataset, for each dimension reduction method and downsampling level. For each box-plot, n = 20 points (cell types). For each box-plot, n = 6 points (cell types). Box-plot lower and upper hinges represent first and third quartiles. Upper/lower whiskers extend to the largest/smallest value no further than 1.5× the interquartile range. Data beyond the whiskers are plotted as single points.
Fig. 4 ∣
Fig. 4 ∣. Joint analysis of mitochondrial genotypes and DNA accessibility in single cells.
a, UMAP plot for cells from a tumor from a patient with CRC profiled by scATAC-seq, with the major cell types annotated. b, Variance-to-mean ratio versus strand concordance (Pearson correlation between strand coverage) for mitochondrial genome variants. High confidence, highly variable mitochondrial genome sites are shown in red. c, Per-cell allele frequencies (fraction heteroplasmy) for two representative mitochondrial genome variants used to identify cell clones. d, Fraction of cells belonging to each clone that were assigned to each cell type, normalized for the total number of cells belonging to each cell type. e, Differentially accessible regions of the nuclear genome between epithelial cell clones.
Fig. 5 ∣
Fig. 5 ∣. Scalable analysis of single-cell chromatin data.
a, UMAP representation of the full human PBMC scATAC-seq dataset of 26,579 nuclei. b, Runtimes for key analysis steps for ArchR and Signac, for each downsampled PBMC scATAC-seq dataset. c, Total runtime for an end-to-end analysis of the full PBMC scATAC-seq dataset for ArchR and Signac using eight cores. d, UMAP representation of the full BICCN adult mouse brain dataset of 734,000 nuclei. Cells are colored by their cell type label given by the original study authors. e, Runtimes for key analysis steps for ArchR and Signac, for each downsampled BICCN scATAC-seq dataset. f, Total runtime for an end-to-end analysis of the full BICCN scATAC-seq dataset for ArchR and Signac using eight cores.

References

    1. Ai S et al. Profiling chromatin states using single-cell itChIP-seq. Nat. Cell Biol 21, 1164–1172 (2019). - PubMed
    1. Buenrostro JD et al. Single-cell chromatin accessibility reveals principles of regulatory variation. Nature 523, 486–490 (2015). - PMC - PubMed
    1. Carter B et al. Mapping histone modifications in low cell number and single cells using antibody-guided chromatin tagmentation (ACT-seq). Nat. Commun 10, 3747 (2019). - PMC - PubMed
    1. Cusanovich DA et al. Multiplex single cell profiling of chromatin accessibility by combinatorial cellular indexing. Science 348, 910–914 (2015). - PMC - PubMed
    1. Kaya-Okur HS et al. CUT&Tag for efficient epigenomic profiling of small samples and single cells. Nat. Commun 10, 1930 (2019). - PMC - PubMed

Publication types