. 2021 Nov;18(11):1317-1321.
doi: 10.1038/s41592-021-01286-1. Epub 2021 Nov 1.

An analytical framework for interpretable and generalizable single-cell data analysis

Affiliations

An analytical framework for interpretable and generalizable single-cell data analysis

Jian Zhou et al. Nat Methods. 2021 Nov.

Erratum in

Abstract

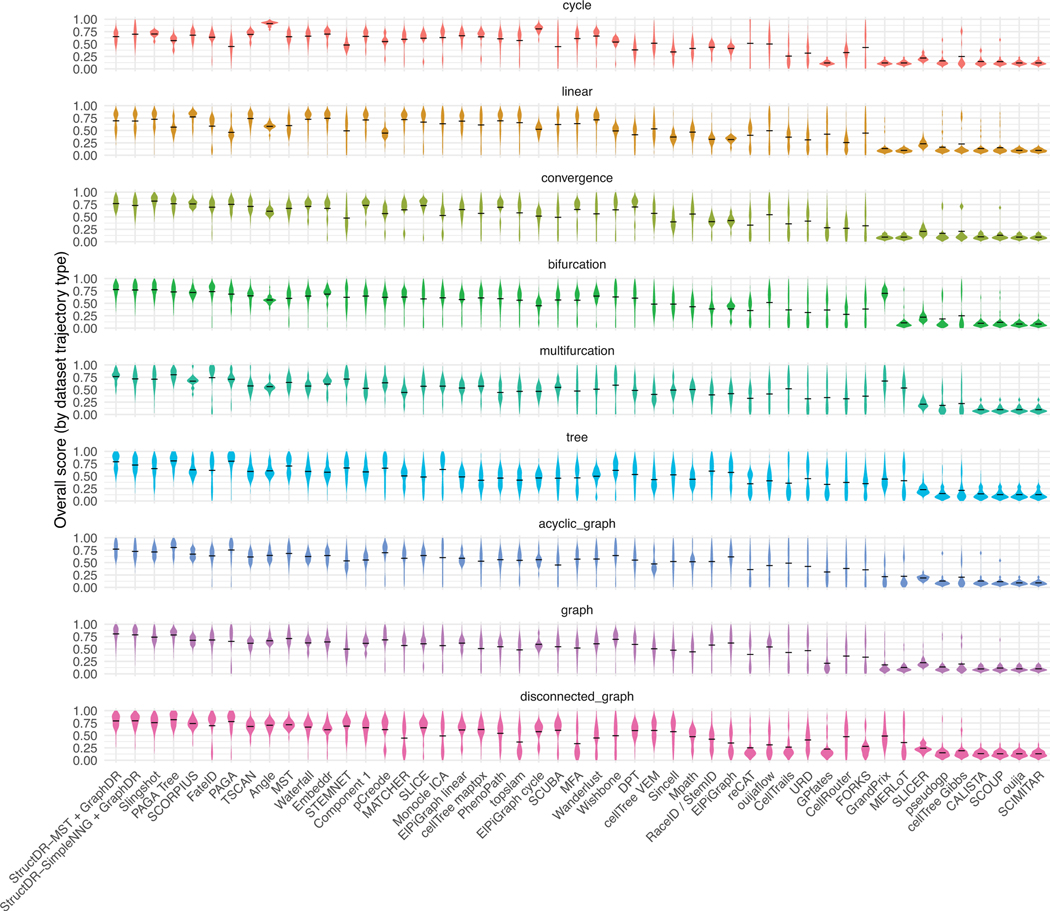
The scaling of single-cell data exploratory analysis with the rapidly growing diversity and quantity of single-cell omics datasets demands more interpretable and robust data representation that is generalizable across datasets. Here, we have developed a 'linearly interpretable' framework that combines the interpretability and transferability of linear methods with the representational power of non-linear methods. Within this framework we introduce a data representation and visualization method, GraphDR, and a structure discovery method, StructDR, that unifies cluster, trajectory and surface estimation and enables their confidence set inference.


Figures

Extended Data Fig. 1
Extended Data Fig. 1. Visualization of first two principal components in PCA, GraphDR, and tSNE visualizations.
We compared the PCA, GraphDR, and tSNE representations by the values of first two principal components (PCs, shown by color) on a developing mouse hippocampus dataset (a-b) (Hochgerner et al. 201811) and a mature mouse brain dataset (c-d) (Zeisel et al. 201818). The top weighted genes by absolute values for the first two PCs are also shown (b, d).
Extended Data Fig. 2
Extended Data Fig. 2. Dataset alignment with GraphDR further improves dataset comparison.
Comparison with applying GraphDR without (a, c) and with (b, d) graph-based dataset alignment on two hematopoietic datasets (Nestorowa et al. 201625 and Paul et al. 201526). The GraphDR visualizations are colored by cell types (a, b) and by datasets (c, d). The cell types are common myeloid progenitors (CMPs), granulocyte-monocyte progenitors (GMPs), lymphoid multipotent progenitors (LMPPs), long-term HSCs (LTHSC), megakaryocyte-erythrocyte progenitors (MEPs), multipotent progenitors (MPPs). Specifically, GraphDR with graph-based dataset alignment constructs a joint graph that also connects the nearest neighbors between datasets (see batch design in Extended Data Fig. 3).
Extended Data Fig. 3
Extended Data Fig. 3. Experimental design encoding through graph construction.
Experimental design information can be encoded through graph construction in GraphDR. Each arrow indicates that nearest-neighbor connections are established between the two groups, where two connected cells are in the two different groups. Self-loop indicates nearest-neighbor connections from cells within a group. Basic design constructs a nearest neighbor graph using all cells, which is suitable for single-batch experiments or experiments with minimal batch effects. Batch design addresses batch effects by introducing nearest-neighbor connections between all pairs of batches, in addition to with-in batch nearest-neighbor connections. Time-series design extends basic design by only allowing connections between the same and adjacent time points. Batch + time series design introduces nearest neighbor connections between two batches in the same or adjacent time points.
Extended Data Fig. 4
Extended Data Fig. 4. Visualization of zebrafish whole embryo single-cell developmental landscape with GraphDR.
Application of GraphDR to a single-cell dataset (Farrell et al. 201823) with a time-series design. a. Single-cell visualization by GraphDR, colored by developmental stages. b. Comparative visualization of developmental stages. This shows the “cross-section” view by visualizing the second and third dimensions. c-d. Single-cell visualization by GraphDR, colored by cell origins.
Extended Data Fig. 5
Extended Data Fig. 5. Visualization of Xenopus tropicalis whole embryo single-cell developmental landscape with GraphDR.
This is an example of applying GraphDR to a single-cell dataset with a batch+time-series design (Briggs et al. 201824). a. Single-cell visualization by GraphDR, colored by developmental stages. b. Comparative visualization of developmental stages. This shows the “cross-section” view by visualizing the second and third dimensions. c-d. Single-cell visualization by GraphDR, colored by cell origins.
Extended Data Fig. 6
Extended Data Fig. 6. Schematic overview of StructDR density ridge estimation procedures with the SCMS algorithm.
(a-b) StructDR starts from performing kernel density estimation with Gaussian kernel on the input cells. (c) Based on the estimated density function, and a selected density ridge dimensionality d (d=1 in this example), the SCMS update can be derived for any position in the space from the gradient and Hessian of the log density function. For any data point or position of interest, iteratively updating the position with the SCMS update will project the data point or position to density ridges of chosen dimensionality. (d). Optional step: construct graph connecting points on the density ridges with one of two optional methods (Methods). The backbone of the graph can be specified based on a betweenness centrality threshold.
Extended Data Fig. 7
Extended Data Fig. 7. Overview of the unified framework of cluster, trajectory, and surface analysis with StructDR.
(a) StructDR uses the SCMS update for the estimation of clusters, trajectories, and surfaces, which can all be derived based on gradient and Hessian of log density function. (b) Examples of projection paths by SCMS updates for zero, one, and two-dimensional density ridges. (c). Comparisons of SCMS algorithms for 0, 1, 2, or k-dimensional density ridges. The SCMS update can identify any k-dimensional density ridges, by projecting a gradient-based update onto subspace spanned by the k+1 th to last eigenvector of the Hessian of log density function.
Extended Data Fig. 8
Extended Data Fig. 8. Performance score distributions on the 339-dataset benchmark shown by dataset type.
Per-dataset performance scores are computed based on Saelens et al. 2019. The performance score distributions are shown with violin plots, separated into panels by dataset types. The performance of applying StructDR + GraphDR with two graph construction algorithms, MST and SimpleNNG, are shown along with the performance of other algorithms benchmarked in Saelens et al. 2019.
Extended Data Fig. 9
Extended Data Fig. 9. Trajectory identification with zero, one, and two-dimensional density ridges example on a developmental hippocampus single-cell dataset.
The circle symbols indicate zero-dimensional density ridge positions (local maxima of density function). The red dots indicate one-dimensional density ridge positions (trajectory). The black dots indicate two-dimensional density ridge positions.
Extended Data Fig. 10
Extended Data Fig. 10. Simulation studies of confidence sets construction with nonparametric ridge estimation.
100 simulation datasets were generated. For each dataset the confidence sets for each estimated trajectory were estimated with 20 bootstraps. x-axis shows the expected coverage probabilities of the constructed confidence sets. y-axis shows the observed proportion that the true trajectory position is covered by the confidence set.
Figure 1.
Figure 1.. A linearly interpretable data representation method that captures the structure of single-cell data while preserving interpretability and transferability.
a. Schematic overview of the linearly interpretable data representation method GraphDR for single-cell omics data representation and visualization. GraphDR approximately preserves the structure and interpretability of a corresponding linear transform. b. Visualization of two example datasets of developmental trajectory (top) and mature cell types (bottom) using GraphDR and representative linear and nonlinear methods, PCA and t-SNE. GraphDR is applied without rotation relative to PCA (Methods). c. Comparison of single-cell data dimensionality reduction methods in representing cell type identity and preserving gene expression space. Y-axis shows the accuracy of recovering cell type information from its nearest neighbor in the representation. X-axis shows preservation of the input linear space measured in correlation of pairwise distance. Both two-dimensional (triangles) and three-dimensional (solid dot) representations are compared. d. Cell type identity representation accuracies in multiple numbers of dimensions for single-cell data dimensionality reduction methods. e-f. Linearly interpretable transform facilitates comparison across datasets, balancing advantages of linear and nonlinear transform. Two planarian single-cell datasets (e. left panel and f. top panel: Fincher et al. 2018; e. right panel and f. bottom panel: Plass et al. 2018) were processed with a representative linear transform PCA, a nonlinear transform t-SNE, and GraphDR.
Figure 2.
Figure 2.. Density-based generalized trajectory estimation and inference.
a. Schematic overview of the StructDR framework. Left panel: zero-, one-, and two-dimensional density ridges and examples of corresponding biological structures. Mid panel: an example of trajectory estimation (1-dimensional density ridge) based on myoblast single-cell RNA-seq data. The original cell positions are shown in black dots; the projected positions are shown in blue; and the projection lines are shown in dotted lines. Gray shades show confidence sets of trajectory positions. Right panel: the top plot shows an annotated example of confidence set estimation. The bottom plot depicts the elements of the subspace constrained mean-shift algorithm; the arrows indicate gradient vectors of the probability density function; the bars indicate the directions of first eigenvectors of the Hessians of the log probability density function; the kernel density estimator-based density function is shown with the contour plot; the estimated trajectory positions are shown in blue dots. b. Performance of StructDR+GraphDR and StructDR+PCA tested on a published large-scale benchmark of 339 datasets. The performance scores are computed based on Saelens et al. 2019. StructDR is applied with 1D density ridge estimation and automated graph construction for cells projected onto the density ridge. c. Density ridge identification with adaptive dimensionality example on a hippocampus developmental trajectory single-cell dataset. Cells projected to one-dimensional (black dots) and two-dimensional density ridges (blue dots) are shown, where the dimensionality of density ridge is adaptively determined based on the data. Insets show the gene expression levels of the indicated genes in sub-regions of the representation.

References

    1. Van Der Maaten L. & Hinton G. Visualizing data using t-SNE. J. Mach. Learn. Res. (2008).
    1. McInnes L, Healy J, Saul N. & Großberger L. UMAP: Uniform Manifold Approximation and Projection. J. Open Source Softw. (2018) doi:10.21105/joss.00861. - DOI
    1. Haghverdi L, Buettner F. & Theis FJ Diffusion maps for high-dimensional single-cell analysis of differentiation data. Bioinformatics (2015) doi:10.1093/bioinformatics/btv325. - DOI - PubMed
    1. Moon KR et al. Visualizing structure and transitions in high-dimensional biological data. Nat. Biotechnol. (2019) doi:10.1038/s41587-019-0336-3. - DOI - PMC - PubMed
    1. Weinreb C, Wolock S. & Klein AM SPRING: A kinetic interface for visualizing high dimensional single-cell expression data. Bioinformatics (2018) doi:10.1093/bioinformatics/btx792. - DOI - PMC - PubMed

Publication types