. 2022 Mar;40(3):422-431.
doi: 10.1038/s41587-021-01058-4. Epub 2021 Nov 1.

Population genomic analysis of Aegilops tauschii identifies targets for bread wheat improvement

Kumar Gaurav #  1 Sanu Arora #  1 Paula Silva #  2   3 Javier Sánchez-Martín #  4 Richard Horsnell #  5 Liangliang Gao  2 Gurcharn S Brar  6   7 Victoria Widrig  4 W John Raupp  2 Narinder Singh  2   8 Shuangye Wu  2 Sandip M Kale  9 Catherine Chinoy  1 Paul Nicholson  1 Jesús Quiroz-Chávez  1 James Simmonds  1 Sadiye Hayta  1 Mark A Smedley  1 Wendy Harwood  1 Suzannah Pearce  1 David Gilbert  1 Ngonidzashe Kangara  1 Catherine Gardener  1 Macarena Forner-Martínez  1 Jiaqian Liu  1   10 Guotai Yu  1   11 Scott A Boden  1   12 Attilio Pascucci  1   13 Sreya Ghosh  1 Amber N Hafeez  1 Tom O'Hara  1 Joshua Waites  1 Jitender Cheema  1 Burkhard Steuernagel  1 Mehran Patpour  14 Annemarie Fejer Justesen  14 Shuyu Liu  15 Jackie C Rudd  15 Raz Avni  16 Amir Sharon  16 Barbara Steiner  17 Rizky Pasthika Kirana  17   18 Hermann Buerstmayr  17 Ali A Mehrabi  19 Firuza Y Nasyrova  20 Noam Chayut  21 Oadi Matny  22 Brian J Steffenson  22 Nitika Sandhu  23 Parveen Chhuneja  23 Evans Lagudah  24 Ahmed F Elkot  25 Simon Tyrrell  26 Xingdong Bian  26 Robert P Davey  26 Martin Simonsen  27 Leif Schauser  27 Vijay K Tiwari  28 H Randy Kutcher  6 Pierre Hucl  6 Aili Li  29 Deng-Cai Liu  30 Long Mao  29 Steven Xu  31 Gina Brown-Guedira  32 Justin Faris  31 Jan Dvorak  33 Ming-Cheng Luo  33 Ksenia Krasileva  34 Thomas Lux  35 Susanne Artmeier  35 Klaus F X Mayer  35   36 Cristobal Uauy  1 Martin Mascher  9   37 Alison R Bentley  38   39 Beat Keller  40 Jesse Poland  41   42 Brande B H Wulff  43   44
Affiliations

Population genomic analysis of Aegilops tauschii identifies targets for bread wheat improvement

Kumar Gaurav et al. Nat Biotechnol. 2022 Mar.

Abstract

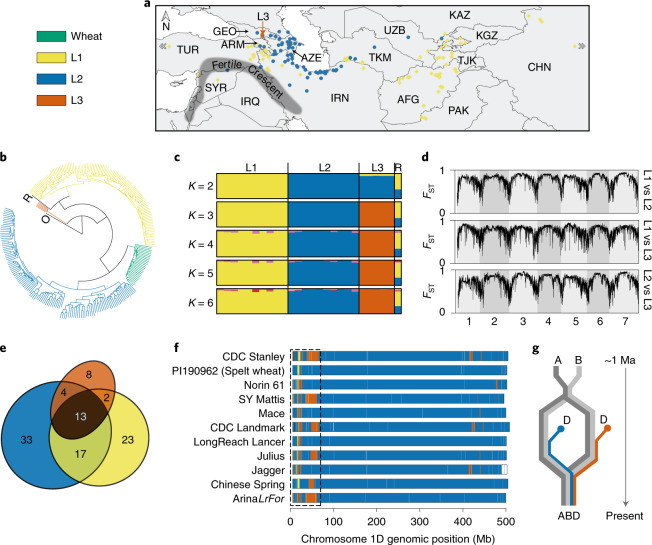
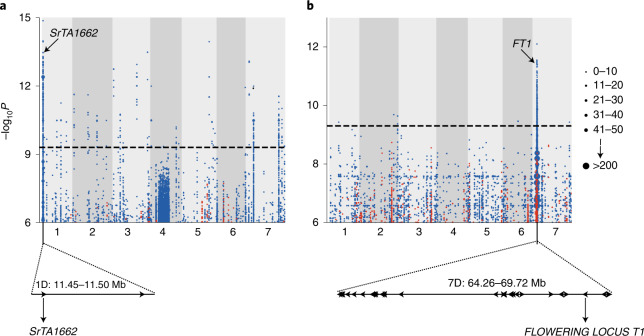
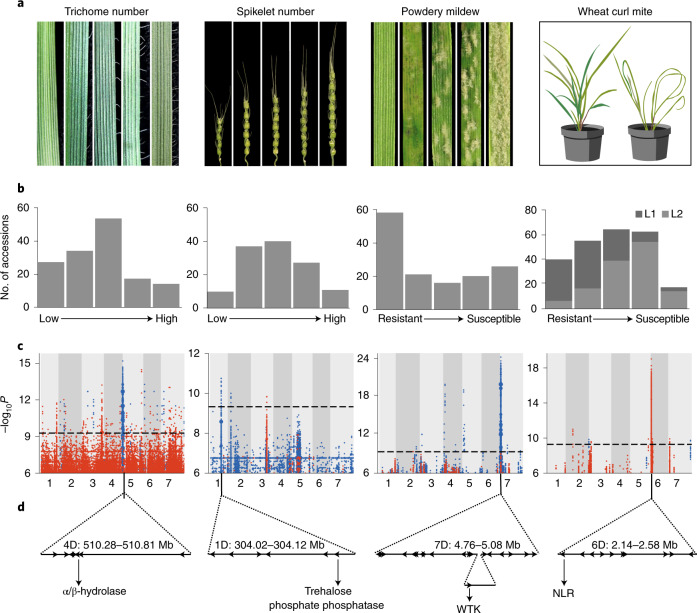
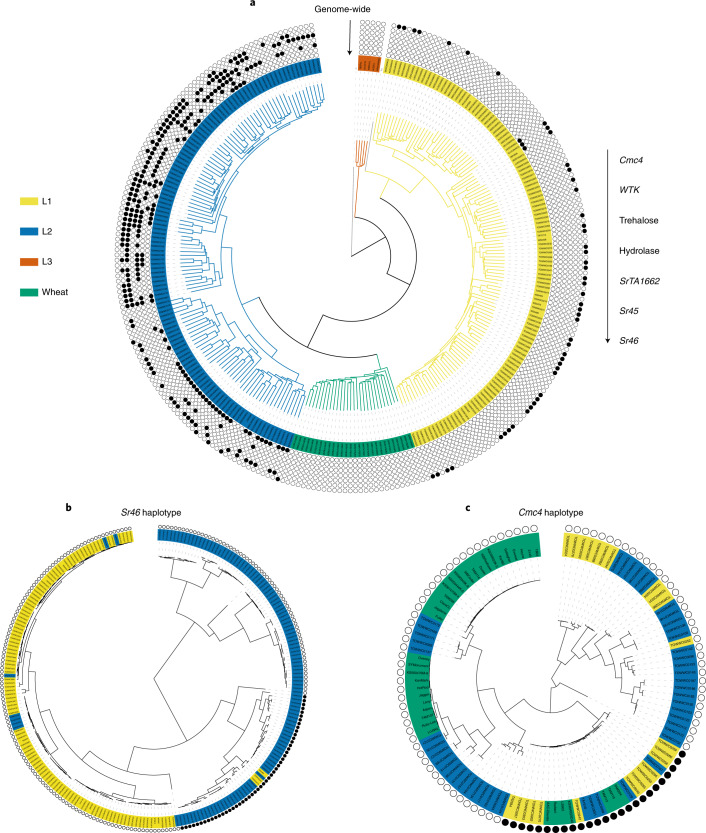
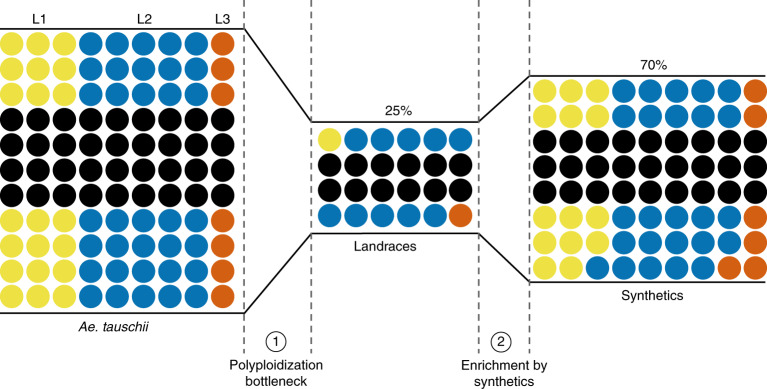
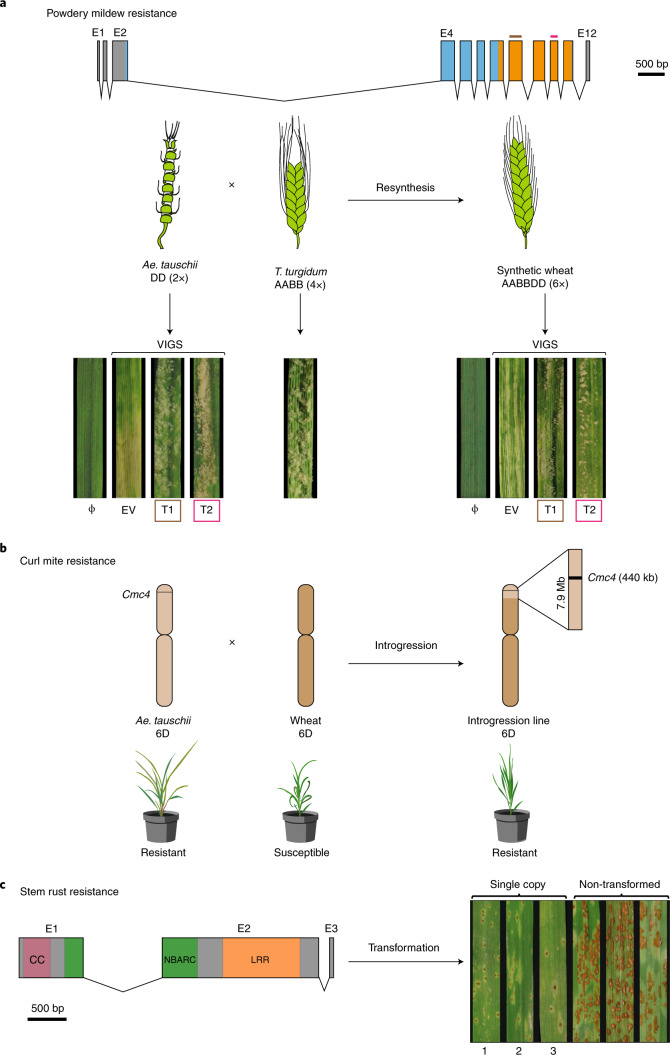
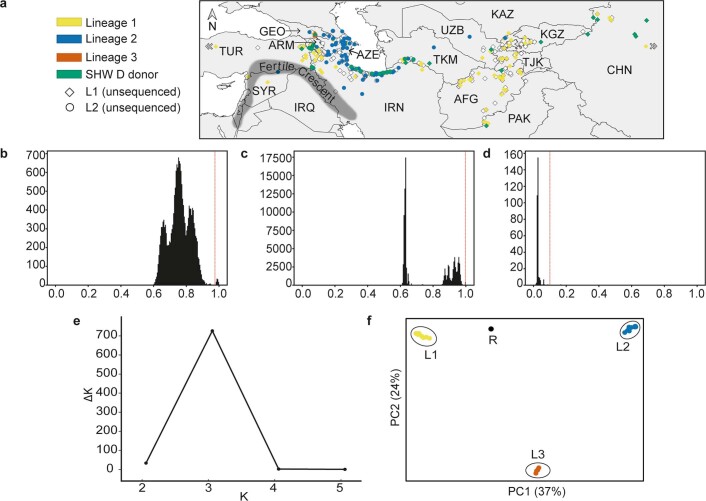
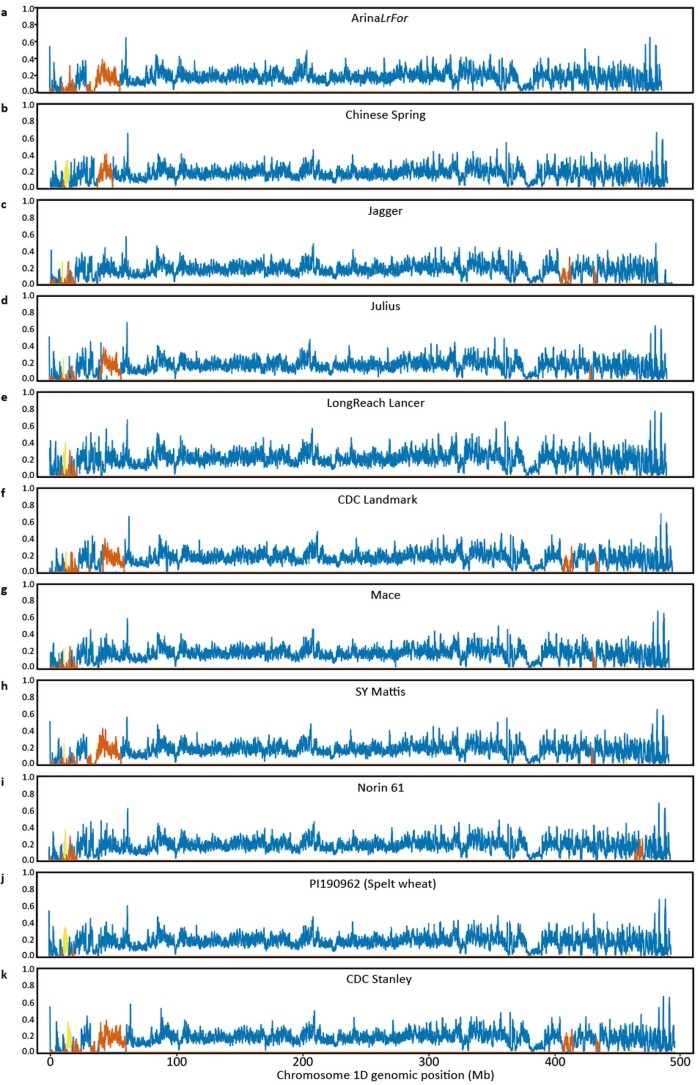
Aegilops tauschii, the diploid wild progenitor of the D subgenome of bread wheat, is a reservoir of genetic diversity for improving bread wheat performance and environmental resilience. Here we sequenced 242 Ae. tauschii accessions and compared them to the wheat D subgenome to characterize genomic diversity. We found that a rare lineage of Ae. tauschii geographically restricted to present-day Georgia contributed to the wheat D subgenome in the independent hybridizations that gave rise to modern bread wheat. Through k-mer-based association mapping, we identified discrete genomic regions with candidate genes for disease and pest resistance and demonstrated their functional transfer into wheat by transgenesis and wide crossing, including the generation of a library of hexaploids incorporating diverse Ae. tauschii genomes. Exploiting the genomic diversity of the Ae. tauschii ancestral diploid genome permits rapid trait discovery and functional genetic validation in a hexaploid background amenable to breeding.


Conflict of interest statement

K.G. and B.B.H.W. are inventors on UK patent application PC931335GB, and S. Arora, B. Steuernagel and B.B.H.W. are inventors on PCT/US2019/013430; these patents are based on part of the work presented here. The remaining authors declare no competing interests.

Figures

Fig. 1
Fig. 1. Characterization of a third lineage of Ae. tauschii and its contribution to the wheat D subgenome.
The color code for all panels is shown for wheat and Ae. tauschii lineages (L1, L2, L3) in the top left corner. a, Distribution of the 242 Ae. tauschii samples used in this study. The five L3 accessions are indicated by an orange vertical arrow. Country abbreviations are provided in Extended Data Fig. 1a. b, Phylogeny showing the D subgenome of 28 wheat landraces in relation to Ae. tauschii, a tetraploid (AABB genome) outgroup (O) and an Ae. tauschii RIL (labeled R) derived from L1 and L2. c, STRUCTURE analysis of the randomly selected ten accessions from each of L1 and L2 along with the five accessions of L3 and the RIL. K denotes the number of subpopulations considered. d, Genome-wide fixation index (FST) estimates of the Ae. tauschii lineages. e, Venn diagram showing the percentage of lineage-specific and shared k-mers between the lineages. f,g, Chromosome 1D of wheat cultivars/accessions colored according to their Ae. tauschii lineage-specific origin (f). The pattern of lineage-specific contribution to the wheat D subgenome, highlighted for one region by a dashed rectangle, suggests that at least two polyploidization events with distinct Ae. tauschii lineages, as shown in g, followed by intraspecific crossing gave rise to extant hexaploid bread wheat. Ma, million years ago.
Fig. 2
Fig. 2. Genetic identification of candidate genes for stem rust resistance and flowering time by k-mer-based association mapping.
a, k-mers significantly associated with resistance to Puccinia graminis f. sp. tritici race QTHJC mapped to scaffolds of a de novo assembly of Ae. tauschii accession TOWWC0112 anchored to chromosomes 1 to 7 of the D subgenome of Chinese Spring. Points on the y axis show k-mers significantly associated with resistance (blue) and susceptibility (red). b, k-mers significantly associated with flowering time mapped to Ae. tauschii reference genome AL8/78 with early (red) or late (blue) flowering time association relative to the population mean across the diversity panel. Candidate genes for both phenotypes are highlighted. Point size is proportional to the number of k-mers (see inset). The association score is defined as the –log10 of the P value obtained using the likelihood ratio test for nested models. The threshold of significant association scores is adjusted for multiple comparisons using the Bonferroni method.
Fig. 3
Fig. 3. Genome-wide association mapping in Ae. tauschii for morphology, disease and pest resistance traits.
a, Representation of the scale of phenotypic variation observed. b, Frequency distribution of the different phenotypic scales corresponding to a. L1 and L2 are shown in dark and light gray, respectively. c, k-mer–based association mapping to a de novo assembly of accession TOWWC0112 anchored to the AL8/78 reference genome (trichome number, spikelet number) or accession TOWWC0106 anchored to AL8/78 (response to powdery mildew) or directly mapped to AL8/78 (response to wheat curl mite). k-mer color coding, association score, threshold and dot size are as in Fig. 2. d, Identification of genes under the peak in the GWAS plot with promising candidate(s) indicated. The WTK gene resides within a 60-kb insertion relative to the AL8/78 reference genome.
Fig. 4
Fig. 4. Comparison of genome-wide phylogeny with phylogenies of haplotypes surrounding specific genes.
a, Genome-wide k-mer-based phylogeny of Ae. tauschii and hexaploid wheat landraces with designation of the presence of candidate and cloned genes/alleles for disease and pest resistance and morphological traits. The presence and absence of allele-specific polymorphisms is indicated by circles filled with black or white, respectively, for all but outgroup and RIL (gray edges). b, Phylogeny of Ae. tauschii L1 and L2 accessions based on SNPs restricted to the 200-kb region surrounding Sr46. c, Phylogeny based on SNPs of the 440-kb region in LD with Cmc4. Only the most resistant and susceptible Ae. tauschii accessions were included, along with resistant and susceptible modern elite wheat cultivars (different from the landraces shown in a).
Fig. 5
Fig. 5. Restricted gene flow from Ae. tauschii to wheat and the capture of Ae. tauschii diversity in a panel of synthetic hexaploid wheats.
Genetic diversity private to Ae. tauschii L1, L2 and L3 is color coded blue, red and orange, respectively, whereas black dots represent k-mer sequences (51-mers) common to more than one lineage. The number of dots is proportional to the number of k-mers. The polyploidization bottleneck (1) incorporated 25% of the variant k-mers found in Ae. tauschii into wheat landraces. The addition of 32 synthetic hexaploid wheats (2) restored this to 70%.
Fig. 6
Fig. 6. Functional transfer of disease and pest resistance from Ae. tauschii into wheat.
a, WTK4 gene structure represented by rectangles (exons E1 to E12) joined by lines (introns). Kinase domains are shown in blue and orange. Exons used for designing VIGS target 1 (T1) and target 2 (T2) are shown in brown and red, respectively. Below, schematic of the cross between Ae. tauschii accession Ent-079 (contains WTK4) and T. turgidum durum line Hoh-501 (lacks WTK4) that generated the synthetic hexaploid wheat line NIAB-144. Leaf segments from plants subjected to VIGS with empty vector (EV), T1, T2 or non-virus control (Φ) and super-infected with B. graminis f. sp. tritici isolate Bgt96224 avirulent to WTK4. b, Introgression of the Cmc4 locus from Ae. tauschii accession TA1618 into wheat. The 440-kb Cmc4 LD block (black) resides within a 7.9-Mb introgressed segment on chromosome 6D (light brown) in wheat cultivar TAM 115. Below, drawings of wheat curl mite-induced phenotypes. c, Structure of the SrTA1662 candidate gene. The predicted 970-amino acid protein has domains with homology to coiled-coil (CC), nucleotide-binding (NB-ARC) and leucine-rich repeats (LRR). Right, transformation with an SrTA1662 genomic construct into cv. Fielder and response to P. graminis f. sp. tritici isolate UK-01 (avirulent to SrTA1662) of single-copy hemizygous transformants (1, DPRM0059; 2, DPRM0051; 3, DPRM0071) and non-transgenic controls.
Extended Data Fig. 1
Extended Data Fig. 1. Configuration and genetic structure of the Aegilops tauschii diversity panel used in this study.
a, Geographical distribution of 242 Ae. tauschii accessions. Filled squares and circles represent accessions sequenced as part of this study, while accessions represented by unfilled squares and circles were not sequenced. Accessions highlighted in green were used as D genome donors to generate synthetic hexaploid wheat (SHW) lines. Three accessions outside of the map, one from Turkey and two from China, are indicated by white arrow heads. AFG, Afghanistan; ARM, Armenia; AZE, Azerbaijan; CHN, China; GEO, Georgia; IRN, Iran; IRQ, Iraq; KAZ, Kazakhstan; KGZ, Kyrgyzstan; PAK, Pakistan; SYR, Syria; TJK, Tajikistan; TUR, Turkey; TKM, Turkmenistan; UZB, Uzbekistan. The Fertile Crescent follows the shaded area in Fig. 1 of Harlan and Zohary (1966) and is bound by the Mediterranean in the west, by chains of large and high mountain ranges in the north and east (the Amanos in northwestern Syria, the Taurus in southern Turkey, Ararat in north-eastern Turkey and the Zagros in western Iran), and in the south by the Syrio-Arabian desert, with its western extension (for example, Paran desert) in the Sinai Peninsula. b, Identification of non-redundant Ae. tauschii accessions using KASP markers on 195 accessions and: c, 100,000 random SNPs obtained from whole genome shotgun sequencing of 306 accessions. The vertical red line in both histogram similarity plots indicates the redundancy cut-off at which the peak of the high similarity values is clearly separated from the rest. d, Identification of Ae. tauschii accessions with minimal residual heterogeneity. The histogram of heterozygosity scores was generated using all the bi-allelic SNPs obtained from whole genome shotgun sequencing of 305 accessions (excluding TOWWC0193). The vertical red line indicates the cut-off at which the cluster of the low heterozygosity values is clearly separated. e, ΔK plot for a STRUCTURE run with 10 randomly selected accessions each of L1 and L2 along with the five accessions of the putative L3 and the control L1-L2 RIL. f, Principal Component Analysis with the same set of accessions as used in panel a. The recombinant inbred control line is indicated by R.
Extended Data Fig. 2
Extended Data Fig. 2. Fraction of lineage-specific k-mers in non-overlapping 100 kb windows of Chromosome 1D for the 11 wheat genome assemblies.
For the nine modern cultivars, only those k-mers were considered which were also present in the short-read sequences of 28 hexaploid wheat landraces. Chromosomes are colored according to their Ae. tauschii lineage-specific origin as displayed in Fig. 1.
Extended Data Fig. 3
Extended Data Fig. 3. Lineage-specific origin of extant wheat D-subgenomes.
Chromosomes 2D-7D of 11 wheat cultivars colored according to their Ae. tauschii lineage-specific origin as in Fig. 1f.
Extended Data Fig. 4
Extended Data Fig. 4. Optimization of k-mer GWAS with the positive controls Sr45 and Sr46.
Blue/red dots on the y-axis represent one or more k-mers significantly associated with resistance/susceptibility, respectively, to Puccinia graminis f. sp. tritici isolate 04KEN156/04 (race TTKSK) across the diversity panel. Definition of association score, threshold, and dot size (which is proportional to the number of k-mers having the specific value on the y-axis), is as in Fig. 2. a, Significantly associated k-mers mapped to AL8/78 which is susceptible to TTKSK. The peaks marked Sr45 and Sr46 contain the non-functional (not providing resistance to TTKSK) alleles of Sr45 and Sr46. The x-axis represents the seven chromosomes of Ae. tauschii reference accession, AL8/78. Each dot column represents a 10 kb interval. b, Significantly associated k-mers mapped to the unordered de novo assembly of TOWWC0112 (N50 1.1 kb), an Ae. tauschii accession resistant to TTKSK. Each dot-column on the x-axis represents an unordered contig from the de novo assembly. c, Significantly associated k-mers mapped to the same assembly of TOWWC0112 as in (b), but now each contig has been ordered by anchoring to the reference genome of AL8/78 (x-axis). d, Association mapping with an improved TOWWC0112 assembly (N50 196 kb) anchored to the AL8/78 reference genome (x-axis).
Extended Data Fig. 5
Extended Data Fig. 5. Impact of sequencing coverage on the power to detect the positive controls, Sr45 and Sr46.
Sequencing coverage was artificially reduced by sub-sampling the original 10-fold coverage sequencing reads and mapping associated k-mers to AL8/78. Definition of association score, threshold, and dot size is as in Fig. 2. a, Plot obtained with 7.5-fold coverage (compare with 10-fold coverage in Extended Data Fig. 7a). b, Plot obtained with 5-fold coverage. c, Plot obtained with 3-fold coverage. d, Plot obtained with 1-fold coverage.
Extended Data Fig. 6
Extended Data Fig. 6. k-mers significantly associated with FLOWERING LOCUS T1 and SrTA1662 identified by GWAS.
Definition of association score, threshold, and dot size is as in Fig. 2. a, Resistance to Puccinia graminis f. sp. tritici isolate UK-01 maps to the SrTA1662 locus. The peak indicated by the arrow contains the region delimited by the SrTA1662 LD block obtained with P. graminis f. sp. tritici race QTHJC. b, Biological replicate 2 and c, biological replicate 3 for flowering time identify FLOWERING LOCUS T1. The associated k-mers were mapped to the Aegilops tauschii AL8/78 reference genome where they define a peak similar to that in Fig. 2b.
Extended Data Fig. 7
Extended Data Fig. 7. Wheat curl mite (WCM) symptoms in Aegilops tauschii and introgression of WCM resistance into wheat.
a, Phenotype scale used to characterize Ae. tauschii response to WCM infestation. Symptoms used were leaf trapping and leaf curliness. The visual scale ranged from 0 to 4, with 0 equivalent to no symptoms and 1 to 4 denoting increasing levels of curliness or trapped leaves indicative of susceptibility. b, Delineation of Ae. tauschii Lineage 1 accession TA2397 carrying wheat curl mite resistance introgressed into wheat line KS96WGRC40. The retained polymorphic markers were obtained by pairwise comparisons of the Ae. tauschii donor with the corresponding wheat line. KS96WGRC40 is the original line where Cmc4 was mapped. c, The donor of resistance in wheat line TAM 112 is the Lineage 2 accession TA1618. Wheat lines TAM 115 and TAM 204 are both resistant through TAM 112. The black vertical line indicates the Cmc4 position. The three grey dashed vertical lines denote the size of the introgressed fragments, 7.9 Mb, 11.9 Mb, and 41.5 Mb, in the wheat lines TAM 115, TAM 112 and TAM 204, and KS96WGRC40, respectively. SNP density is based on number of SNPs within 1 Mb bins.
Extended Data Fig. 8
Extended Data Fig. 8. Genome-wide decay of linkage disequilibrium (LD) in Aegilops tauschii.
Genomic regions (R1, R2a, C, R2b, R3) in L2 (top) and L1 (bottom) were determined based on the distribution of the recombination rate in T. aestivum cv. Chinese Spring. The distance at which r2 for a region drops below 0.1 is highlighted.
Extended Data Fig. 9
Extended Data Fig. 9. Analysis of powdery mildew resistance in Aegilops tauschii and durum donors and their derived synthetic hexaploid wheat lines.
a, Top, disease reactions to Blumeria graminis f. sp. tritici Bgt96224 are displayed for the Ae. tauchii accessions Ent-079, Ent-080, Ent-085 and Ent-102. Bottom, disease reactions to Bgt96224 are displayed for the corresponding synthetic hexaploid lines (NIAB_144, derived from Ent-079; NIAB_088 derived from Ent-080; NIAB_149 derived from Ent-085; and NIAB_090 derived from Ent-102) using the tetraploid durum wheat donor line Hoh-501, which is highly susceptible to Bgt96224. Each Ae. tauschii and its corresponding synthetic hexaploid line was not inoculated with BSMV (Ø) or with a BSMV construct as empty vector (EV) or targeting for silencing the WTK4 exon 8 (target 1, T1) or exon 10 (target 2, T2), respectively, and then super-infected with Bgt96224. b, Alternative splicing of WTK4. Alternative splicing variants (SV1-7) revealed by sequencing 51 WTK4 cDNAs. At the top, in black, is shown the splicing variant SV01, which encodes the complete WTK4 protein. Below SV01, six aberrant alternative splicing variants (SV02 to SV07) are shown in in grey. The number of clones identified for each SV is identified in parenthesis. Diamond arrowed red lines point to the first stops codons at the protein level.
Extended Data Fig. 10
Extended Data Fig. 10. The Aegilops tauschii stem rust resistance gene SrTA1662 maintains race specificity as a transgene in wheat.
The SrTA1662 gene was transformed into the stem rust susceptible wheat cultivar Fielder. Shown are T2 generation lines selected to be homozygous for the transgene or to be non-transgenic segregants. a, Inoculation with isolate IT200a/18 (race TKKTF). b, Inoculation with isolate IT16a/18 (race TTRTF). c, Inoculation with isolate ET11a/18 (TKTTF). d, Inoculation with isolate KE184a/18 (Kenya). Numbering refers to 1 = DPRM0050 (null of DPRM0051), 2 = DPRM0051, 3 = DPRM0059, 4 = DPRM0062 (null of DPRM0059), 5 = DPRM0071, 6 = DPRM0072 (= null of DPRM0071) (see Supplementary Table E).

References

    1. Dubcovsky J, Dvorak J. Genome plasticity a key factor in the success of polyploid wheat under domestication. Science. 2007;316:1862–1866. - PMC - PubMed
    1. Pont C, et al. Tracing the ancestry of modern bread wheats. Nat. Genet. 2019;51:905–911. - PubMed
    1. Marcussen T, et al. Ancient hybridizations among the ancestral genomes of bread wheat. Science. 2014;345:1250092. - PubMed
    1. Huang S, et al. Genes encoding plastid acetyl-CoA carboxylase and 3-phosphoglycerate kinase of the Triticum/Aegilops complex and the evolutionary history of polyploid wheat. Proc. Natl Acad. Sci. USA. 2002;99:8133–8138. - PMC - PubMed
    1. Zohary, D., Hopf, M. & Weiss, E. Domestication of Plants in the Old World: The Origin and Spread of Domesticated Plants in Southwest Asia, Europe, and the Mediterranean Basin 4th edn (Oxford Scholarship Online, 2012).

Publication types