. 2021 Nov;5(11):1320-1335.
doi: 10.1038/s41551-021-00805-x. Epub 2021 Nov 1.

An organoid-based screen for epigenetic inhibitors that stimulate antigen presentation and potentiate T-cell-mediated cytotoxicity

Affiliations

An organoid-based screen for epigenetic inhibitors that stimulate antigen presentation and potentiate T-cell-mediated cytotoxicity

Zhuolong Zhou et al. Nat Biomed Eng. 2021 Nov.

Erratum in

Abstract

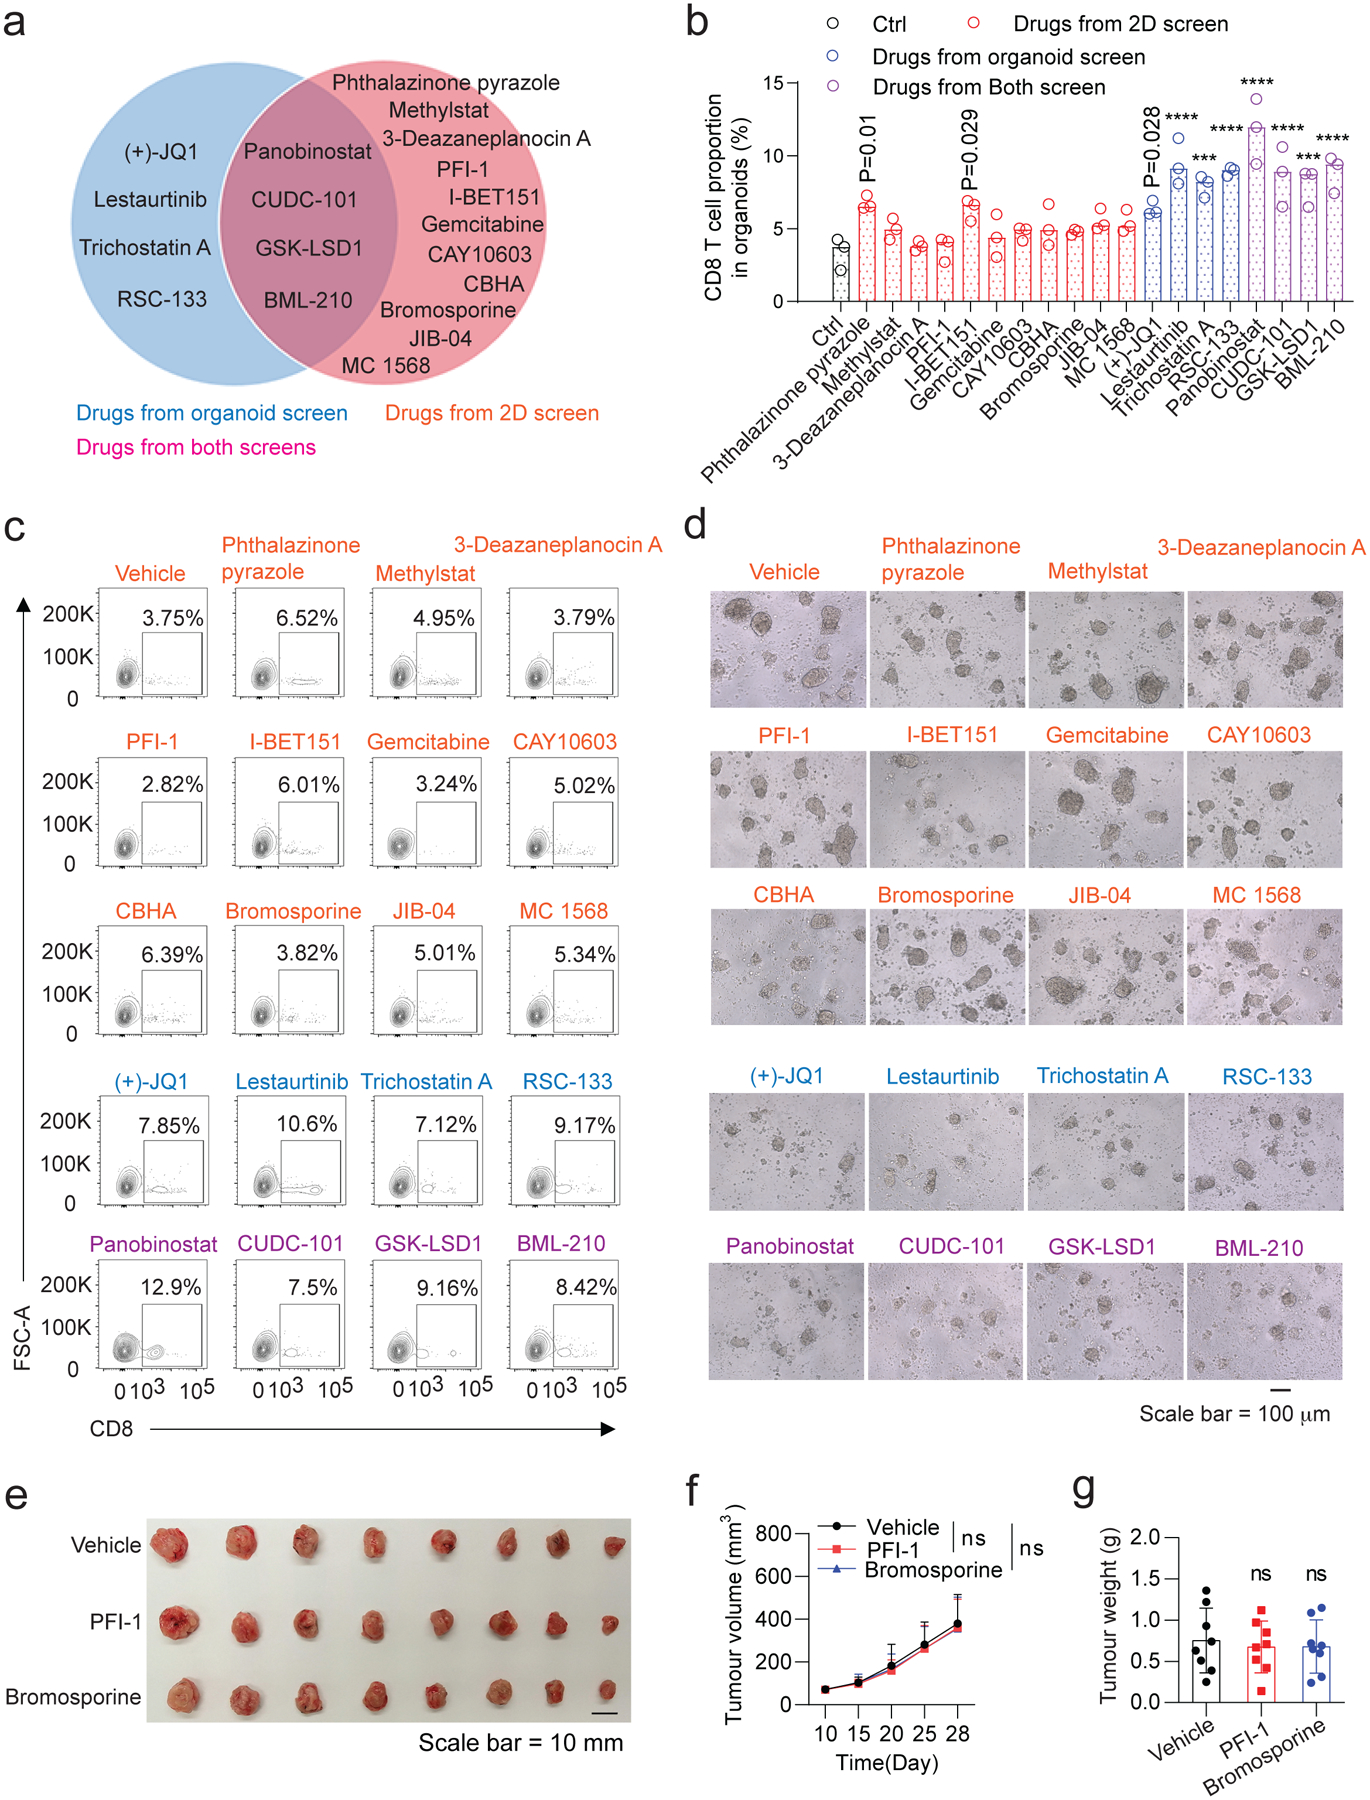
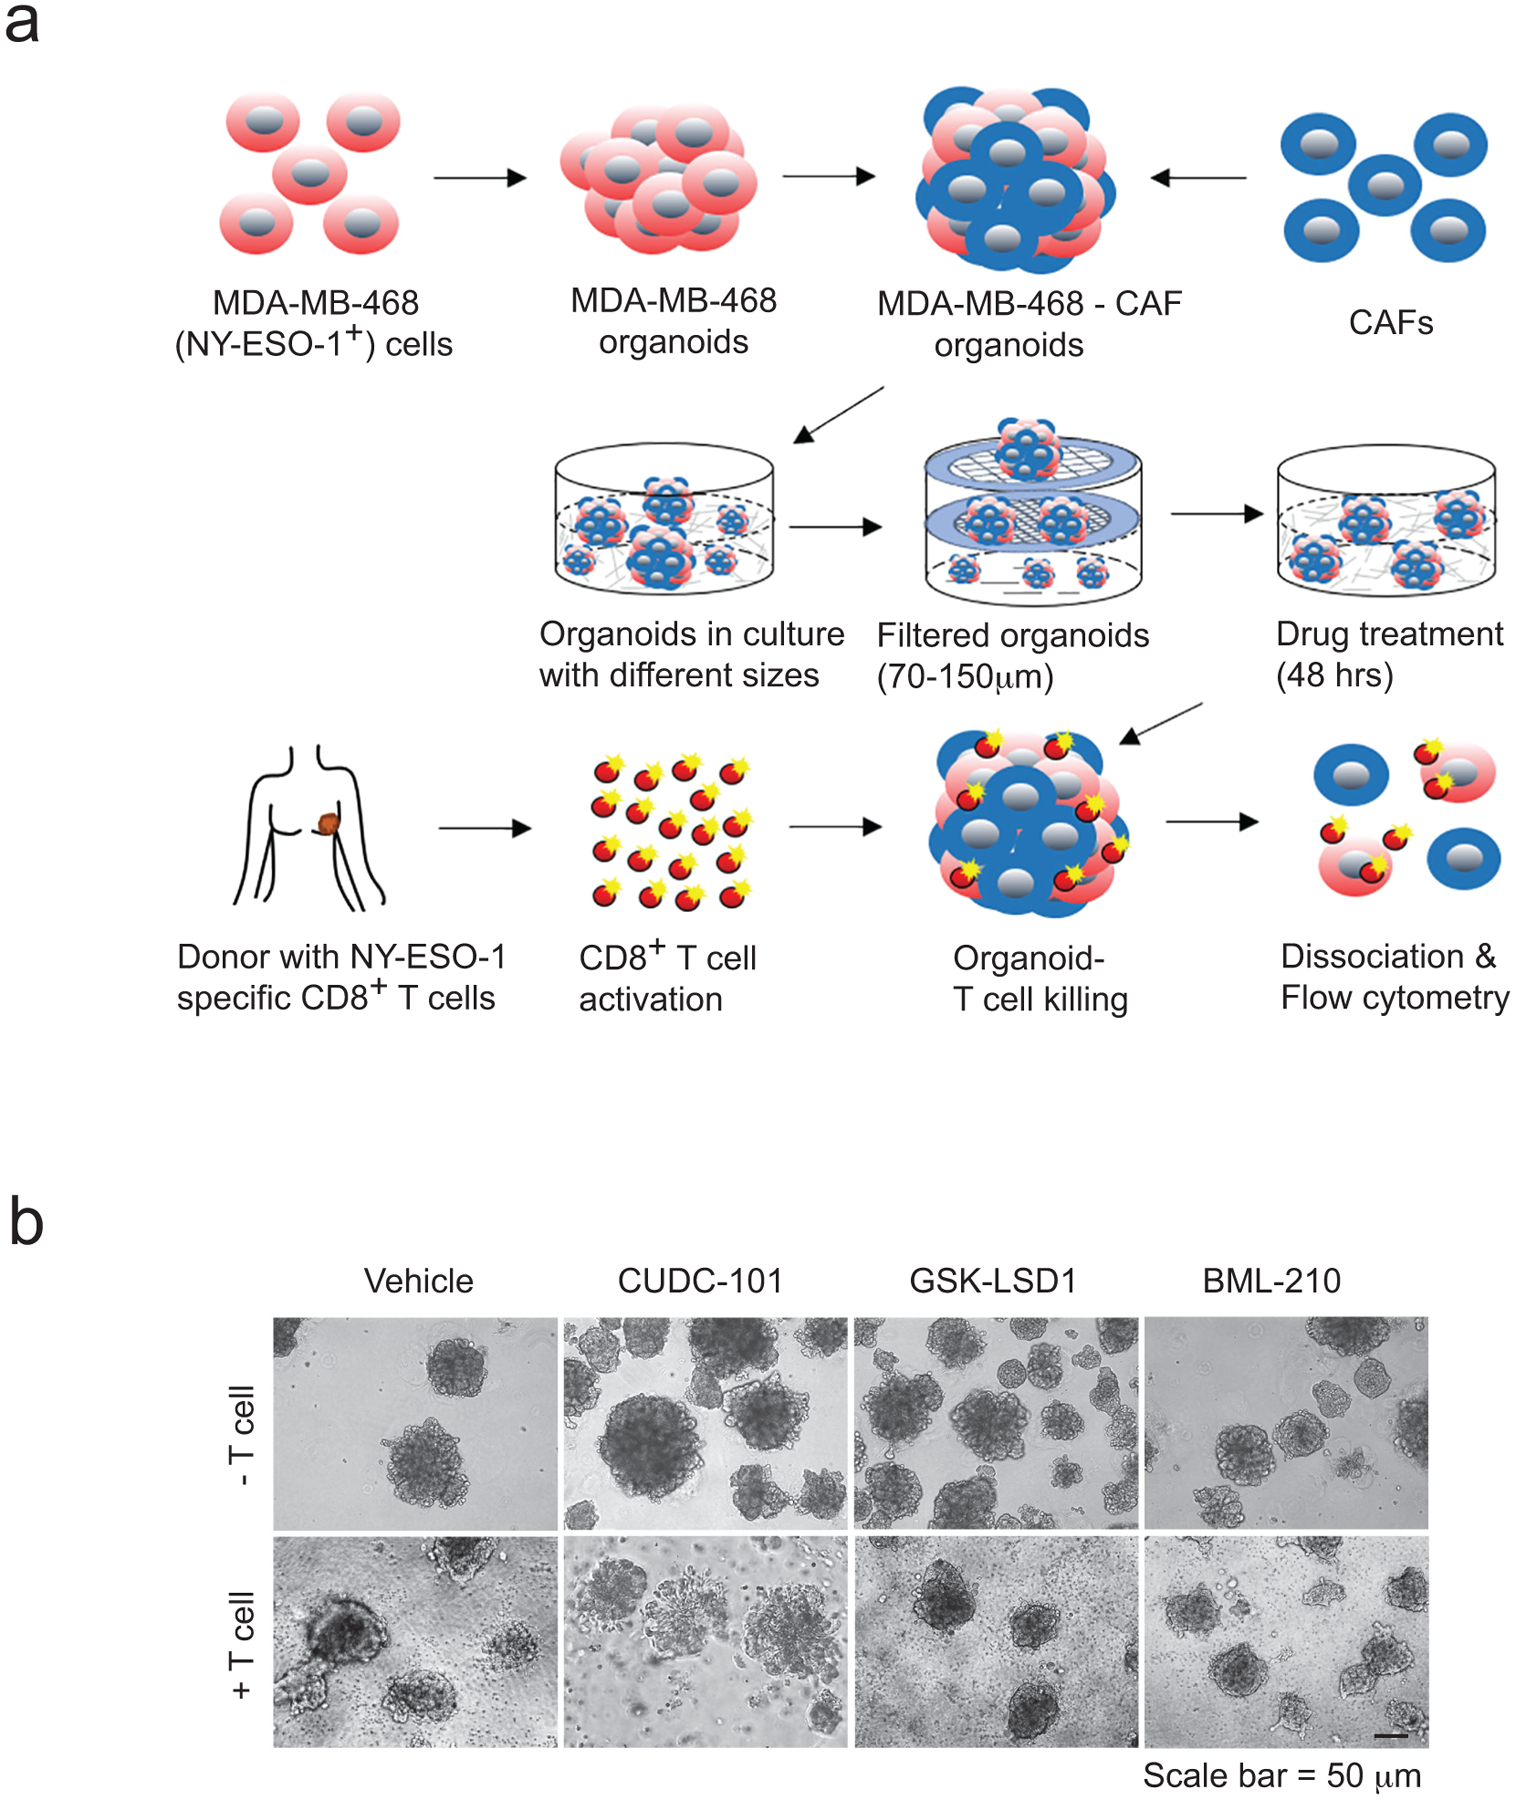
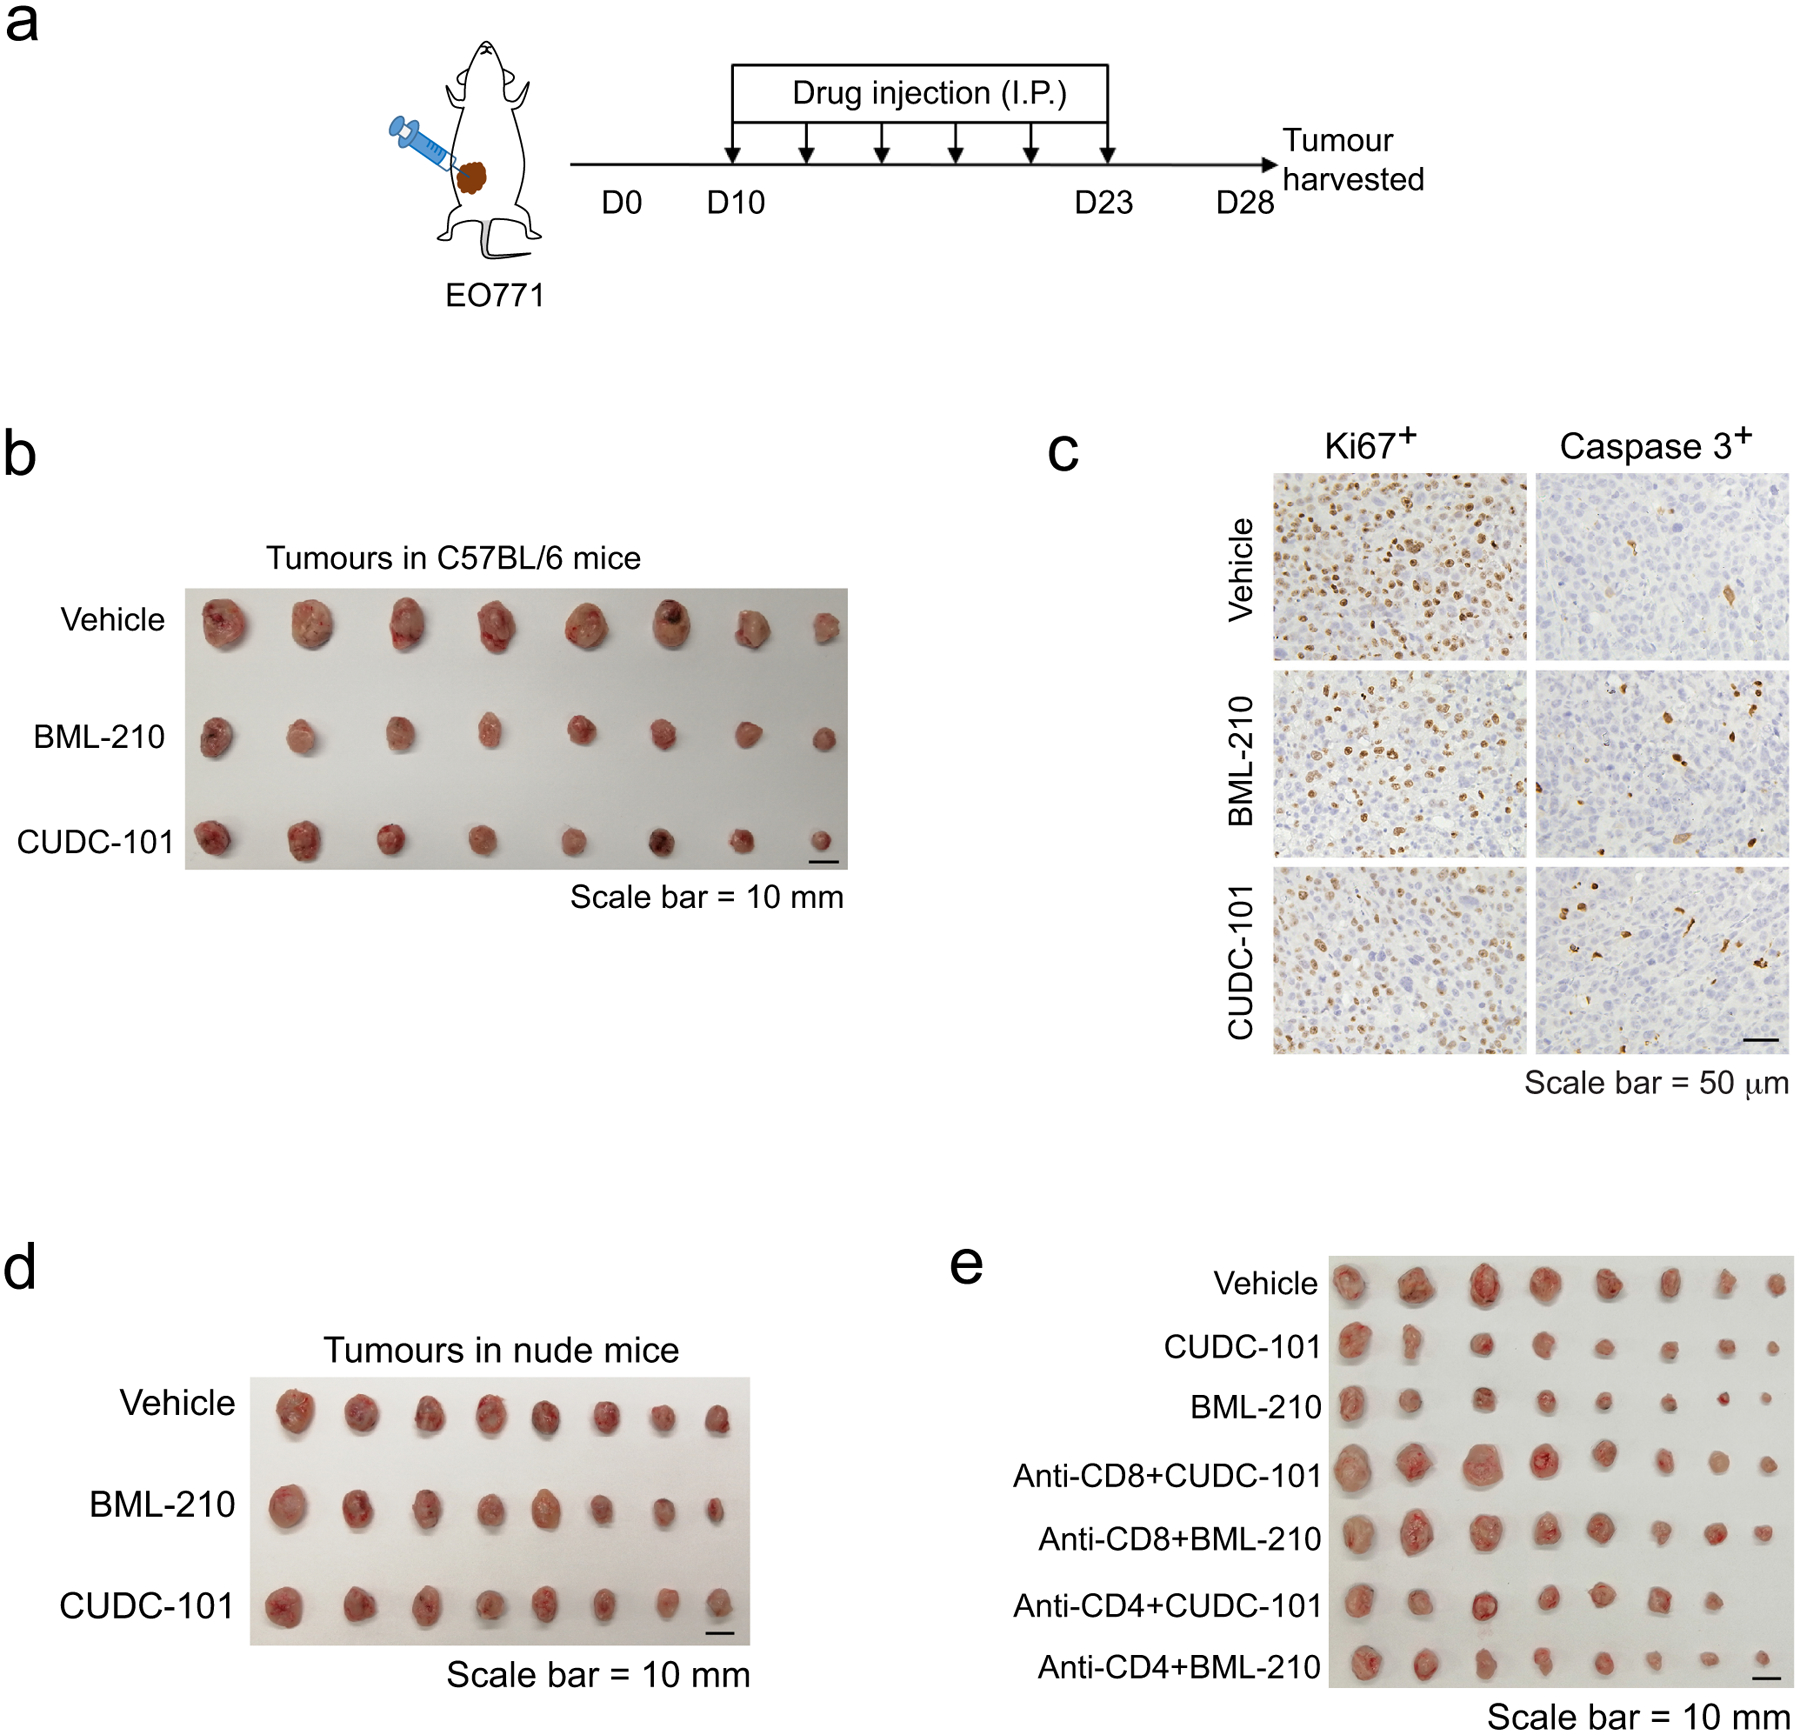
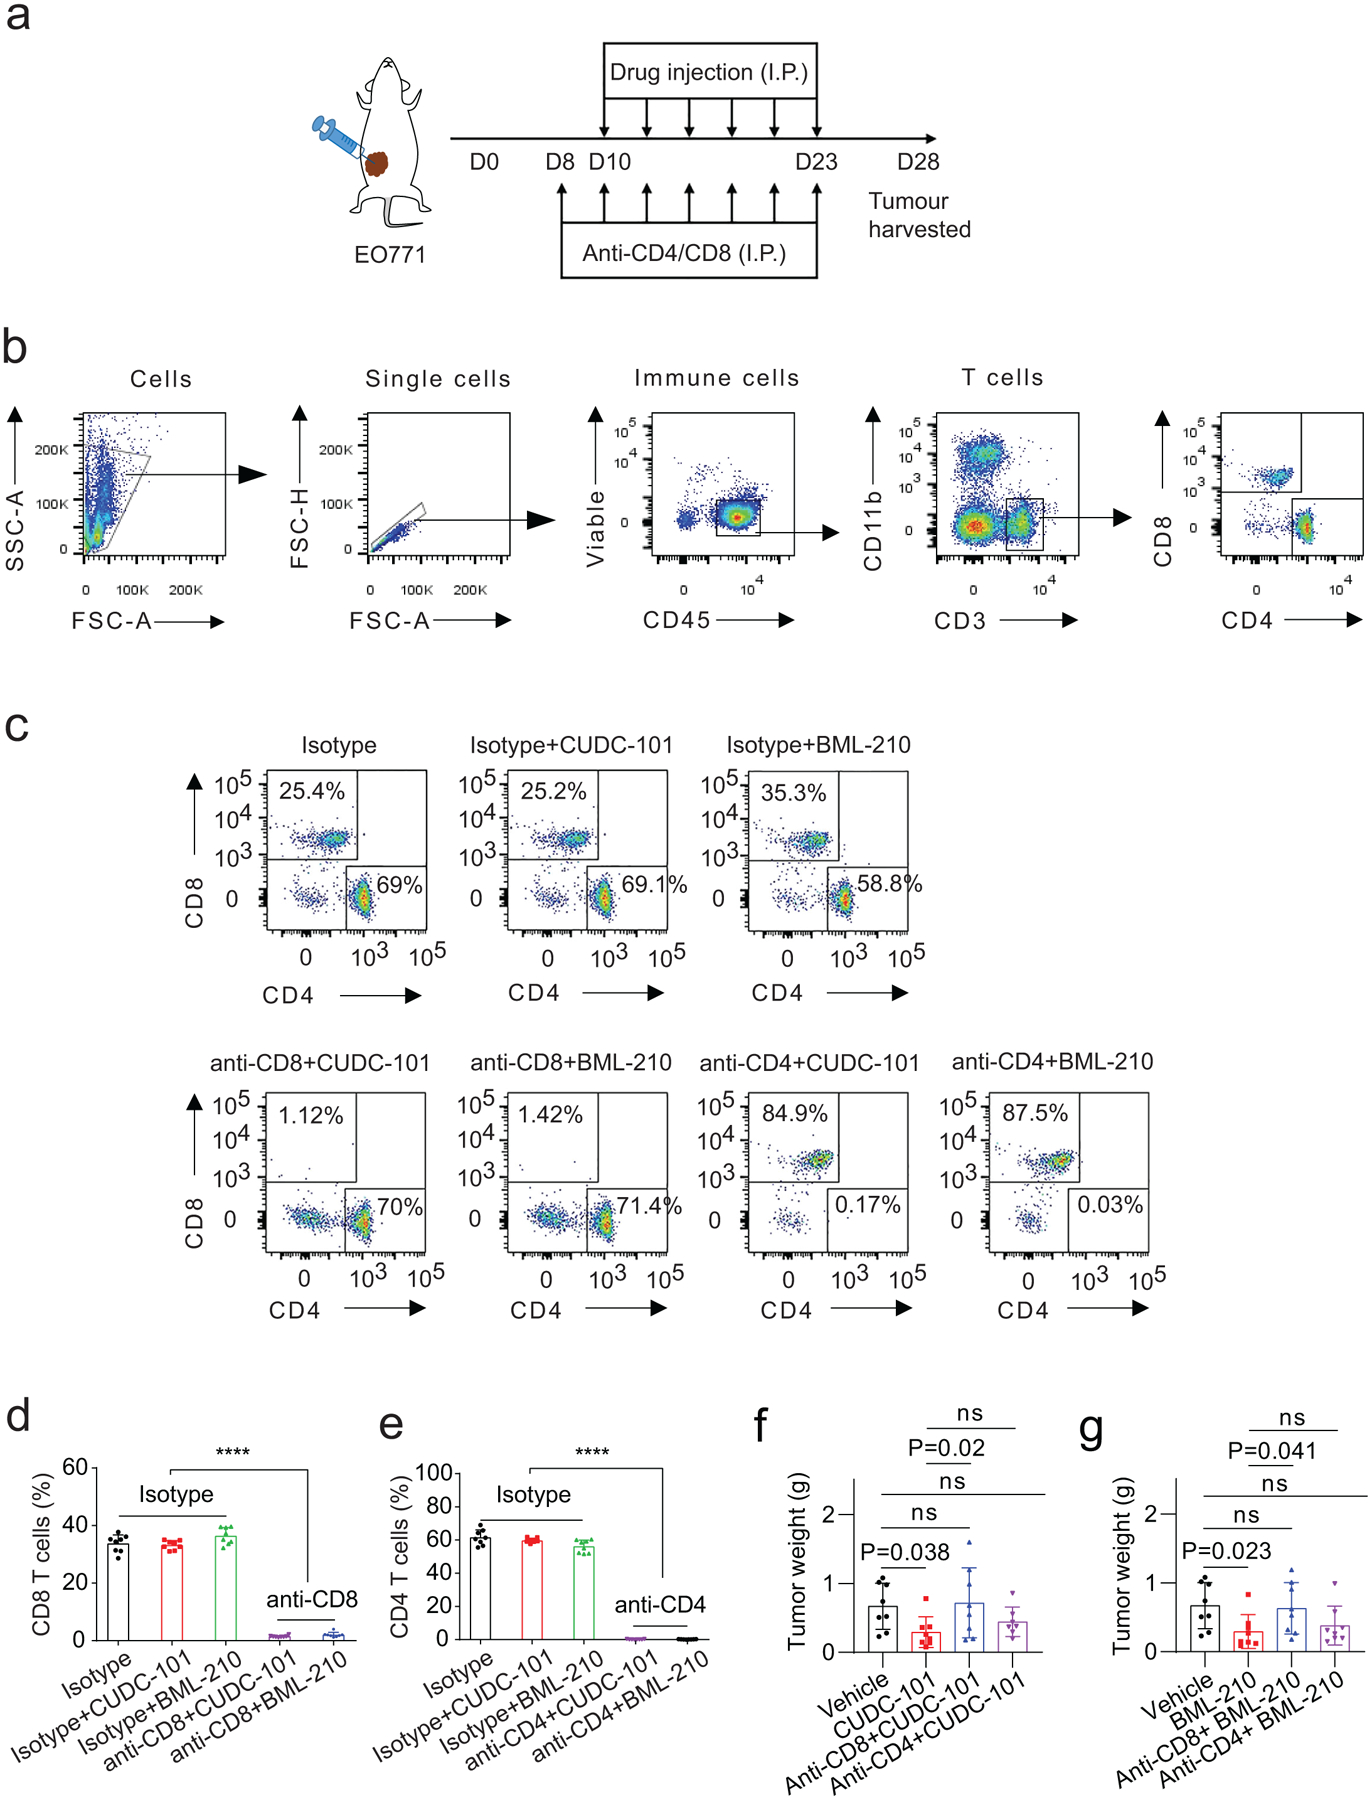
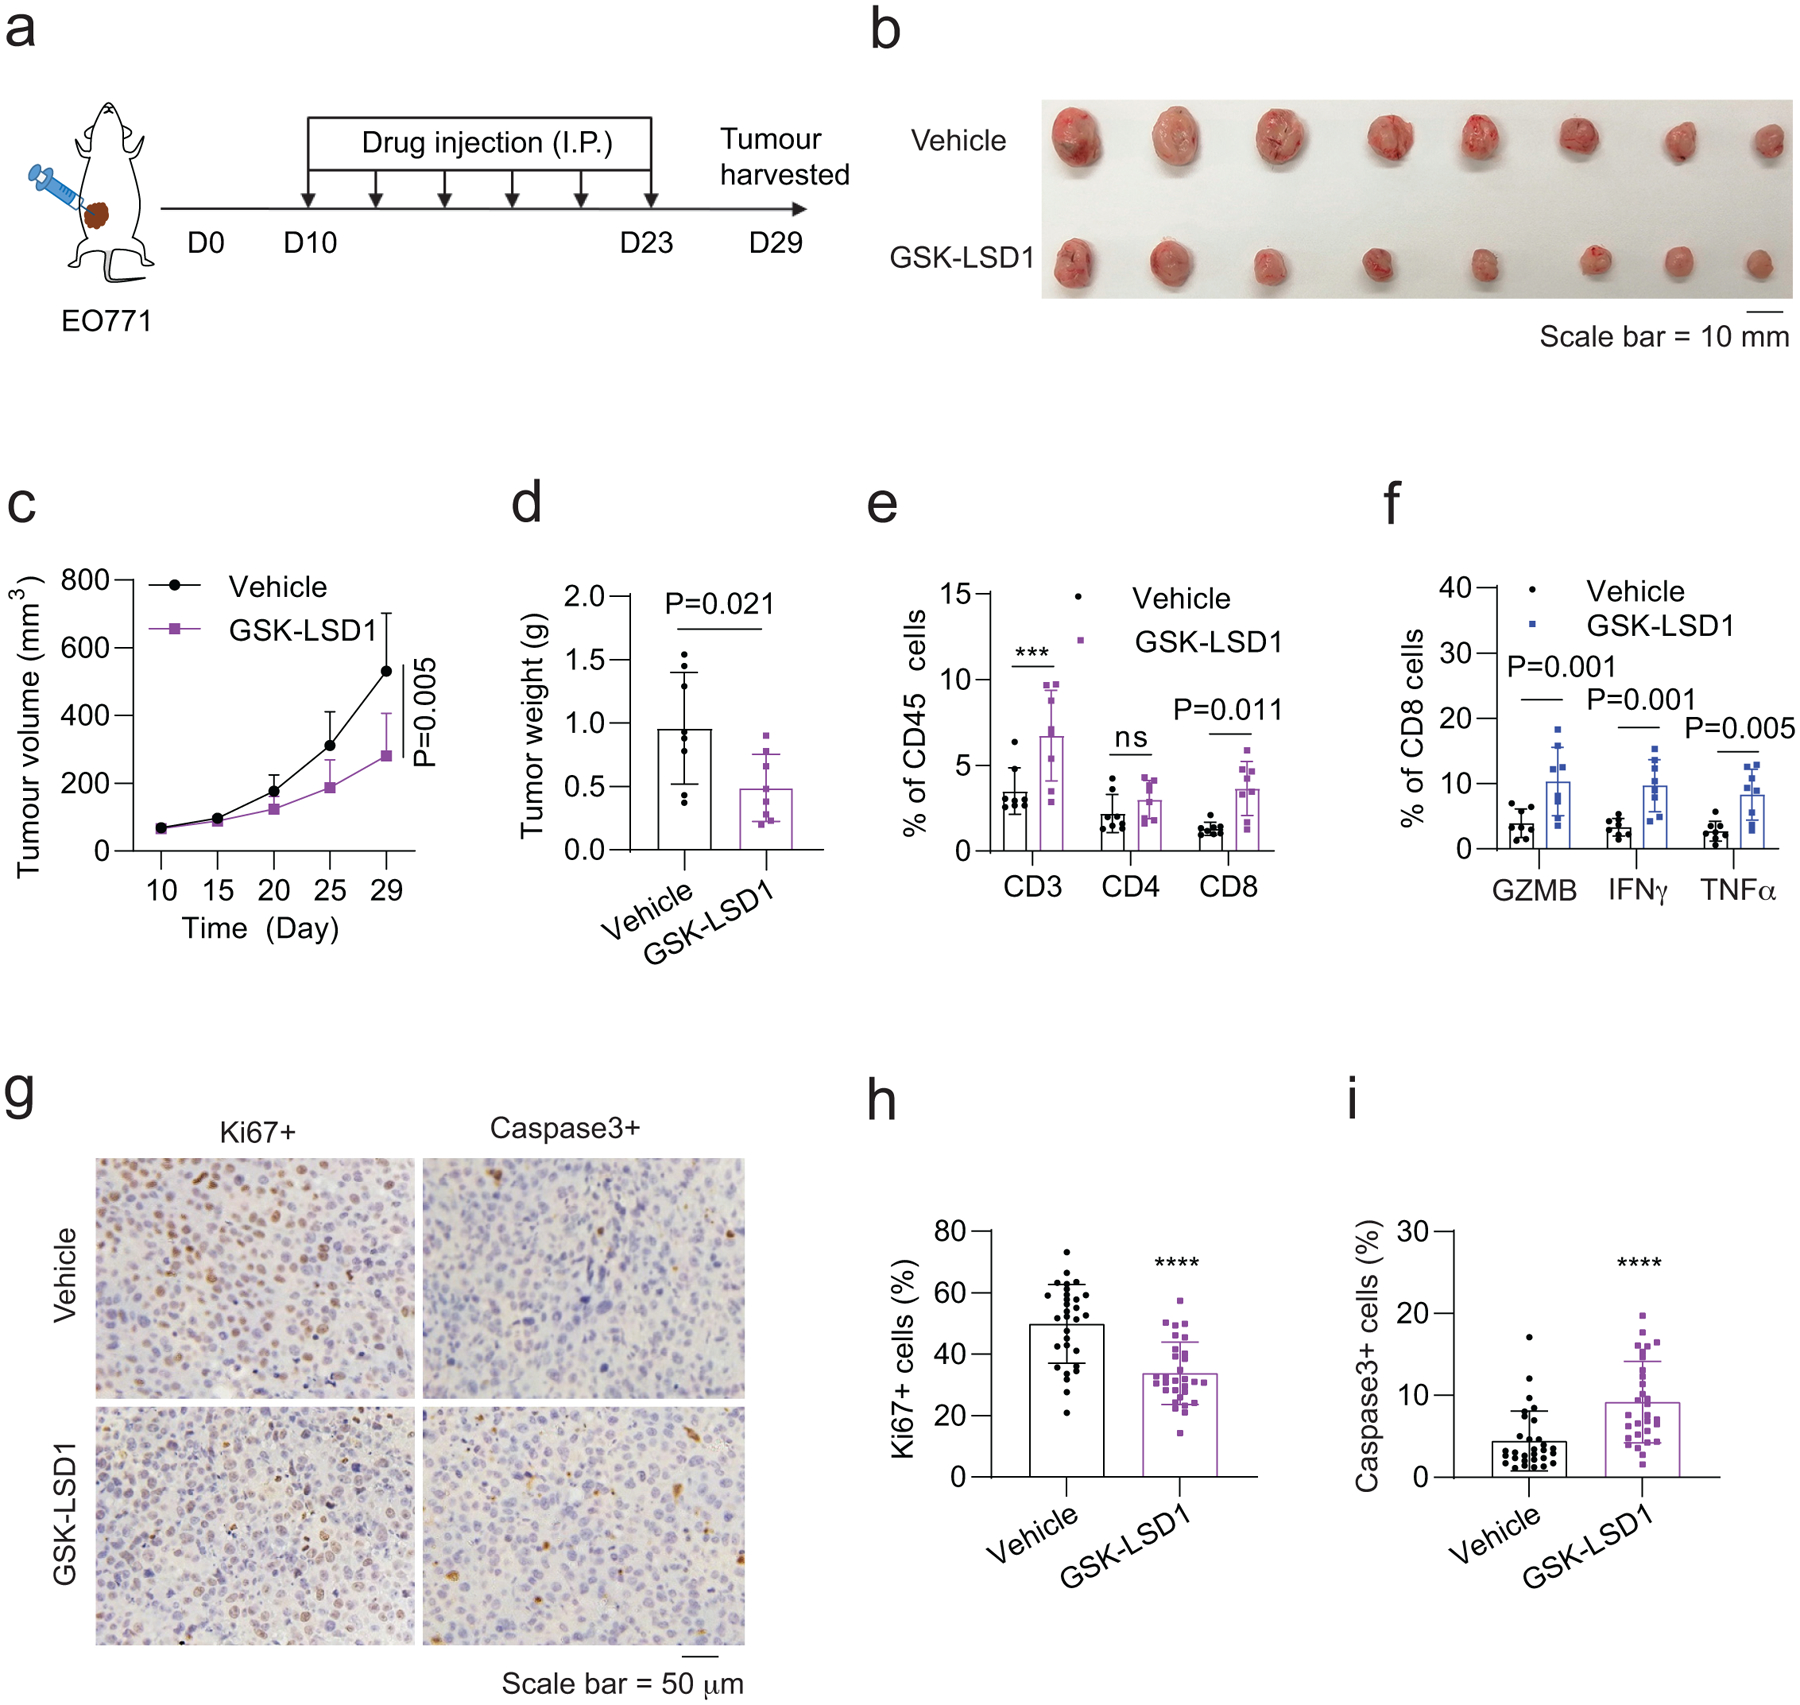
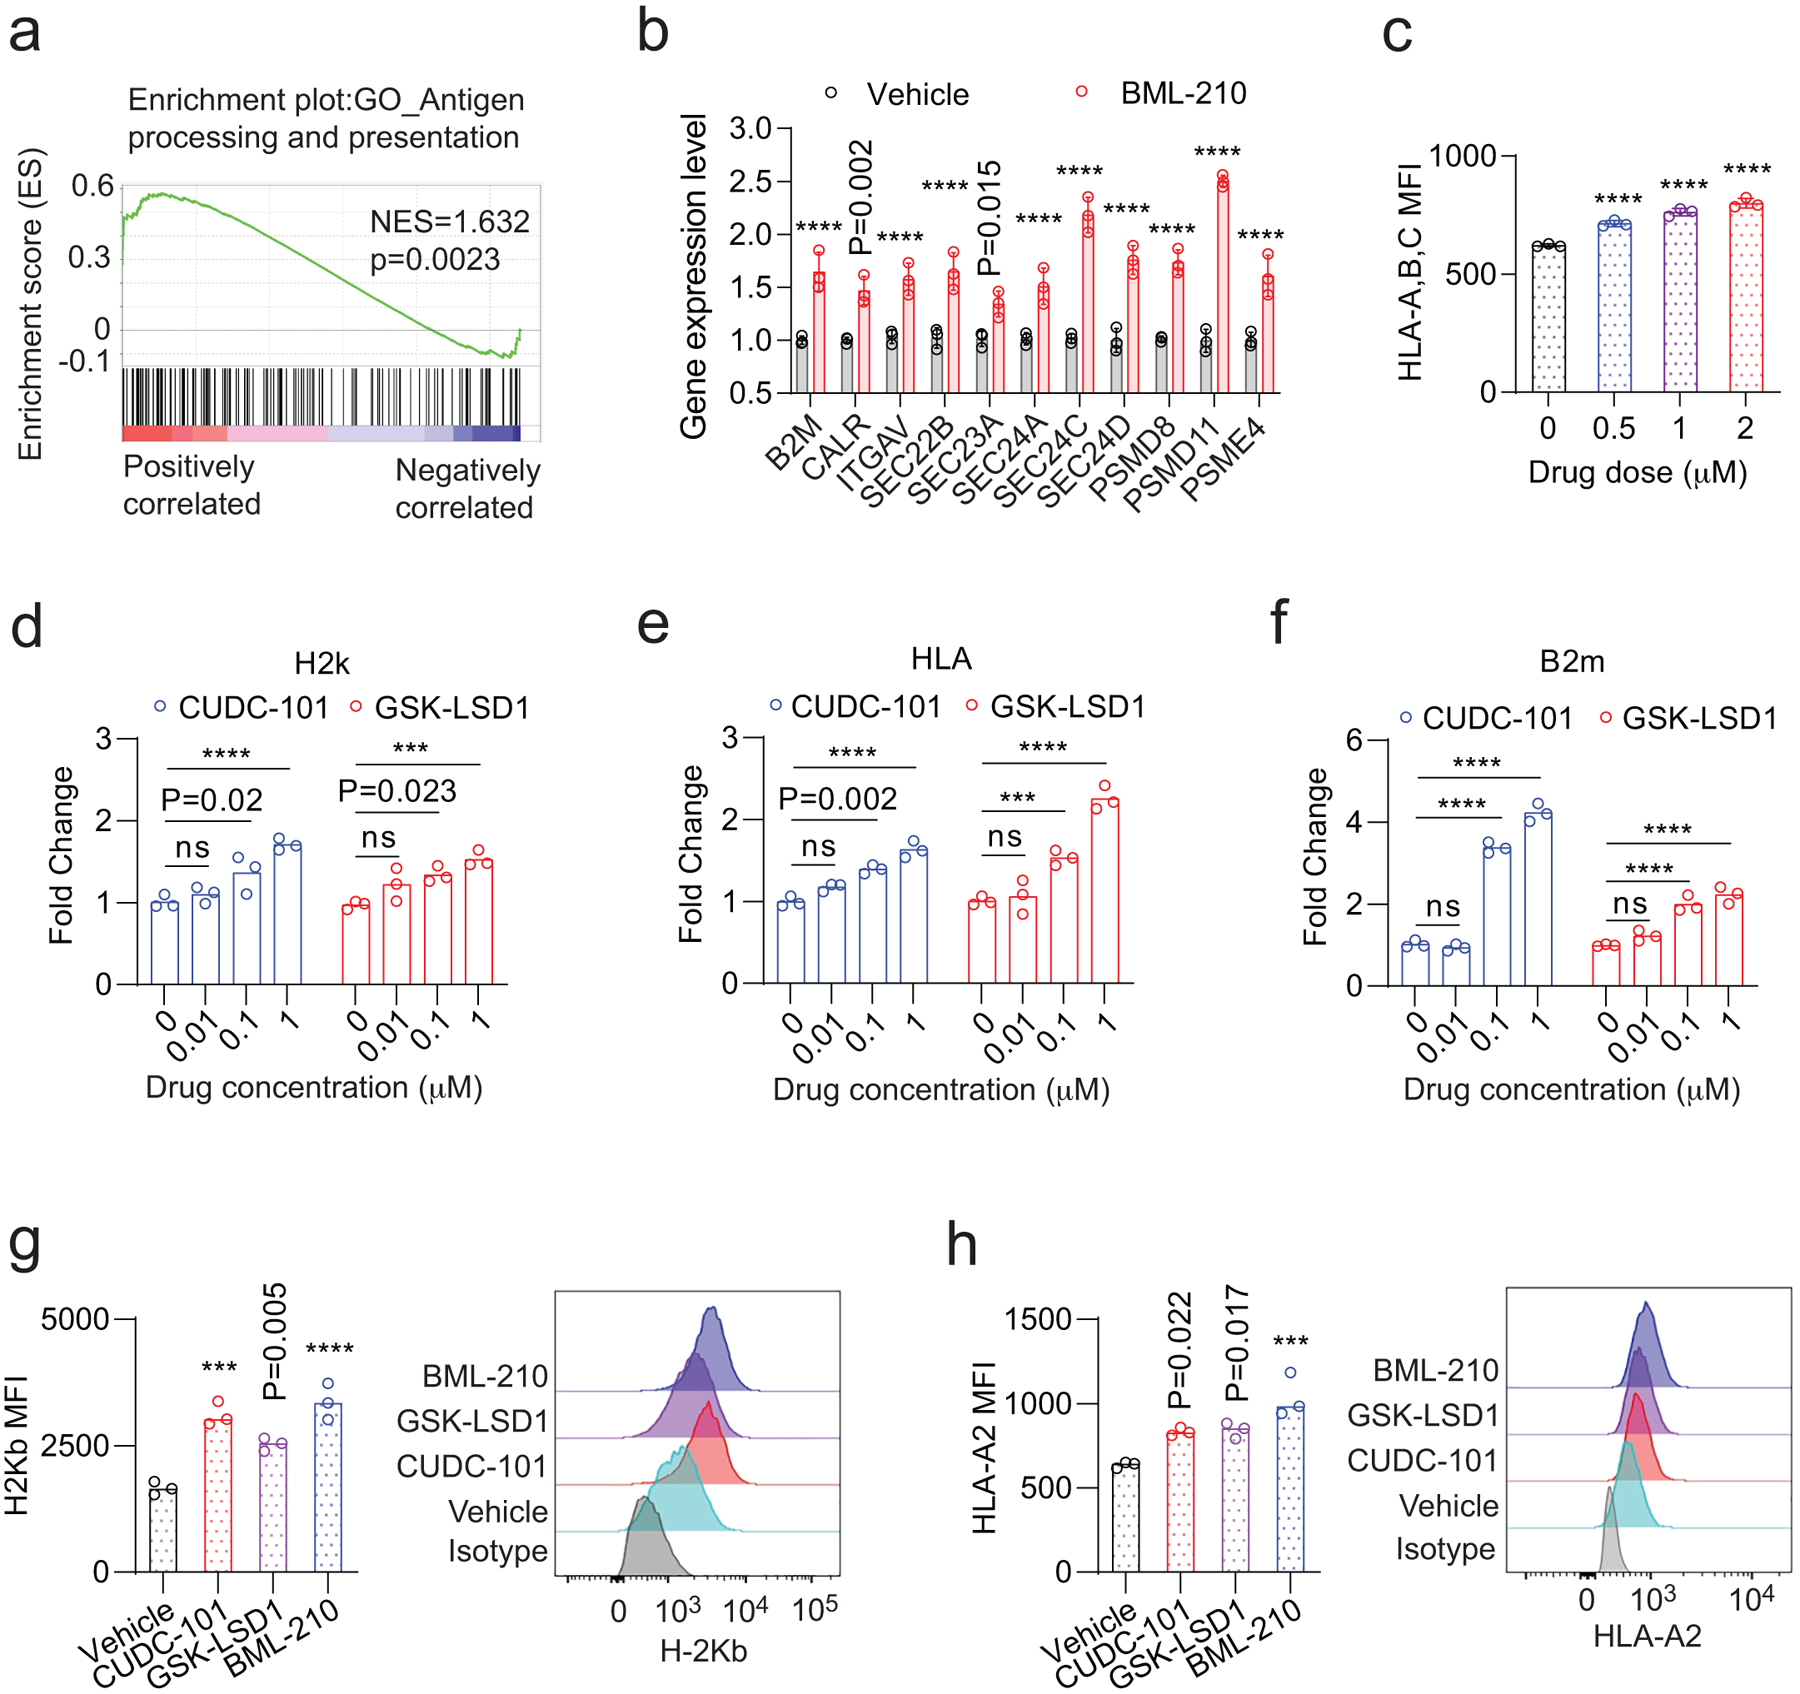
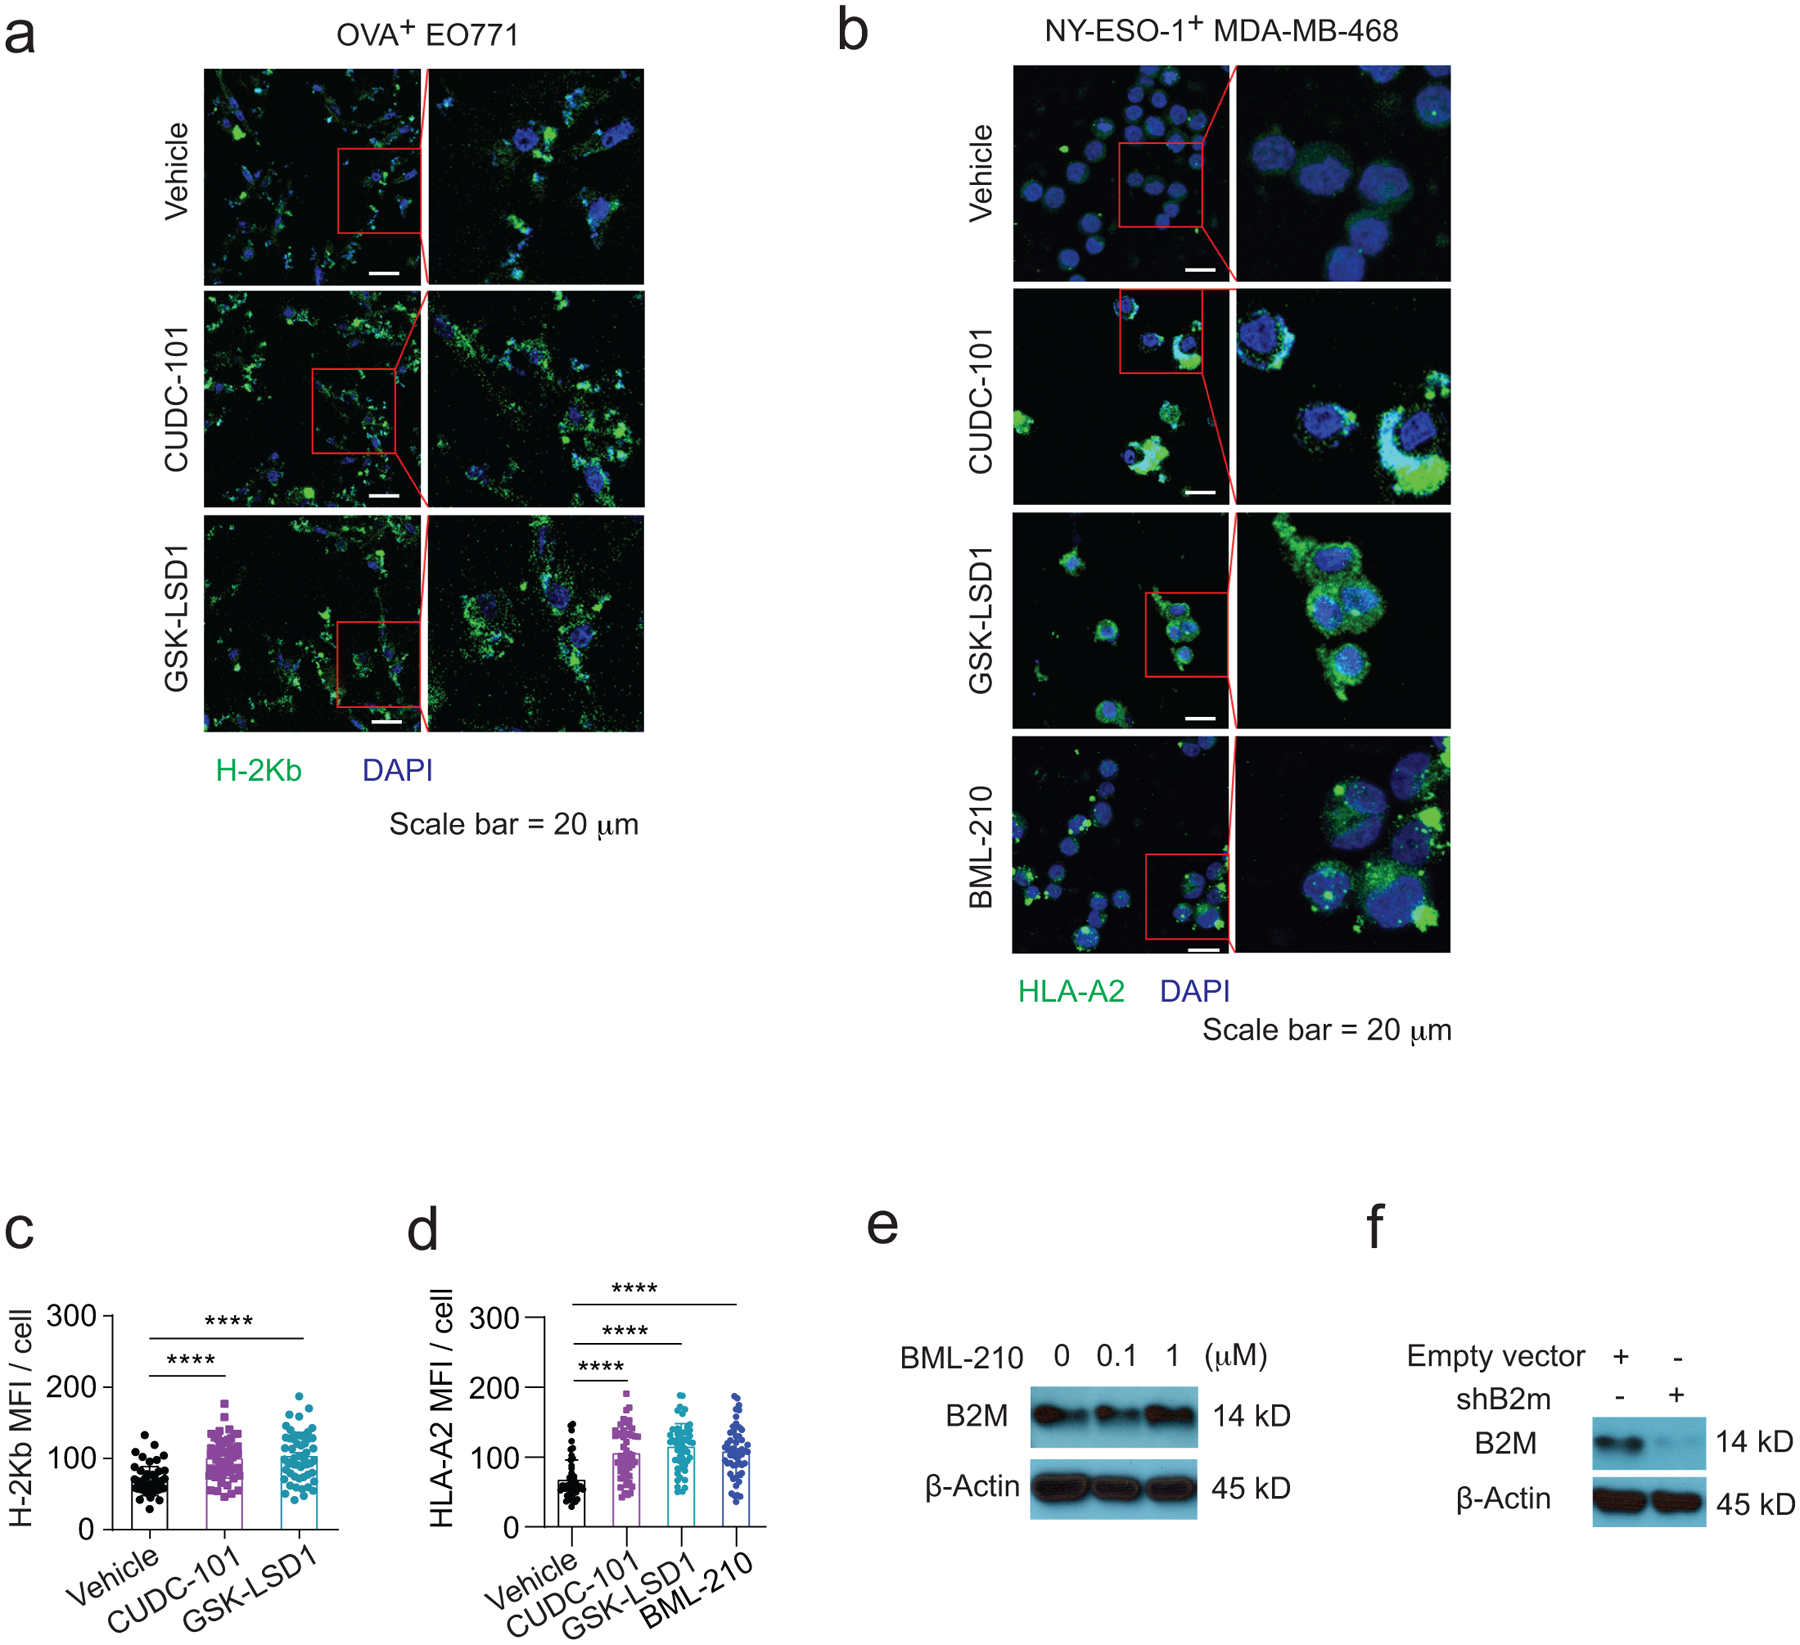
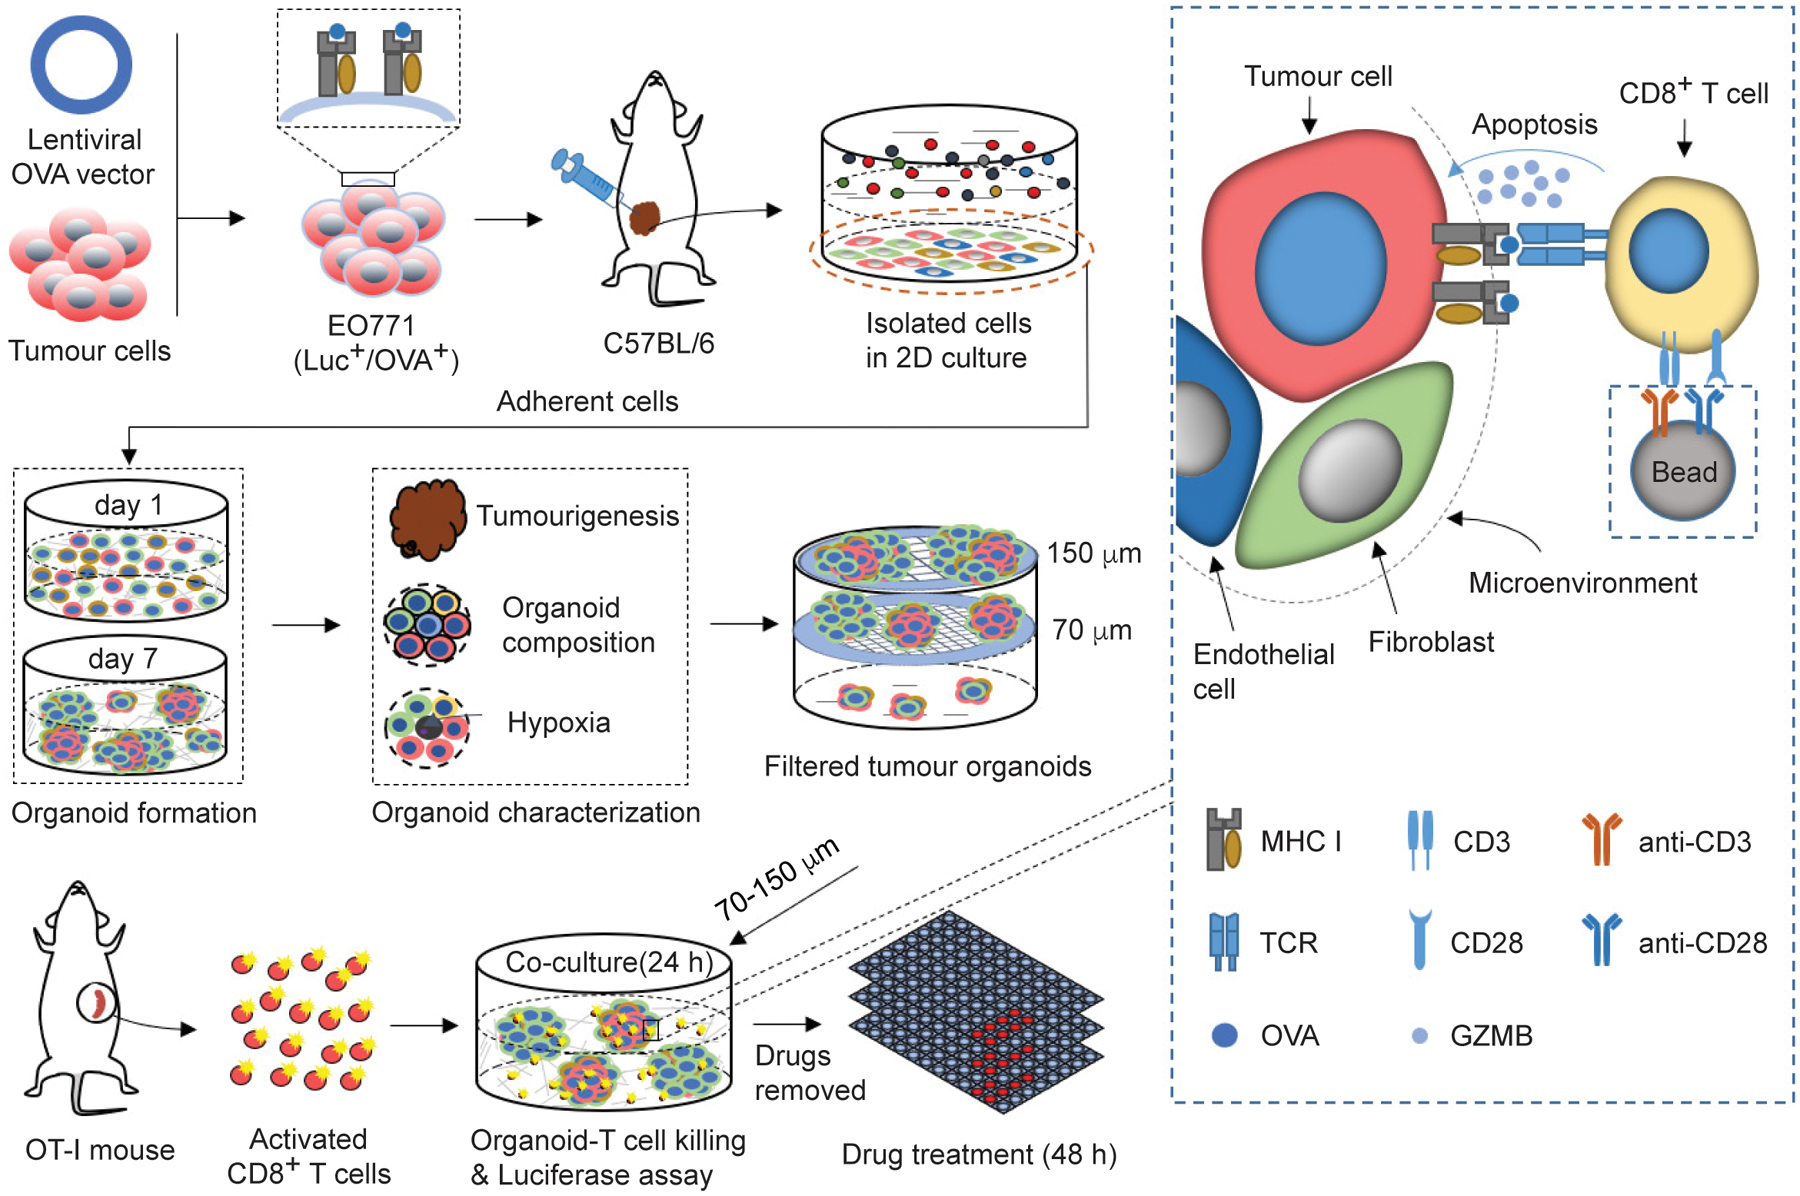
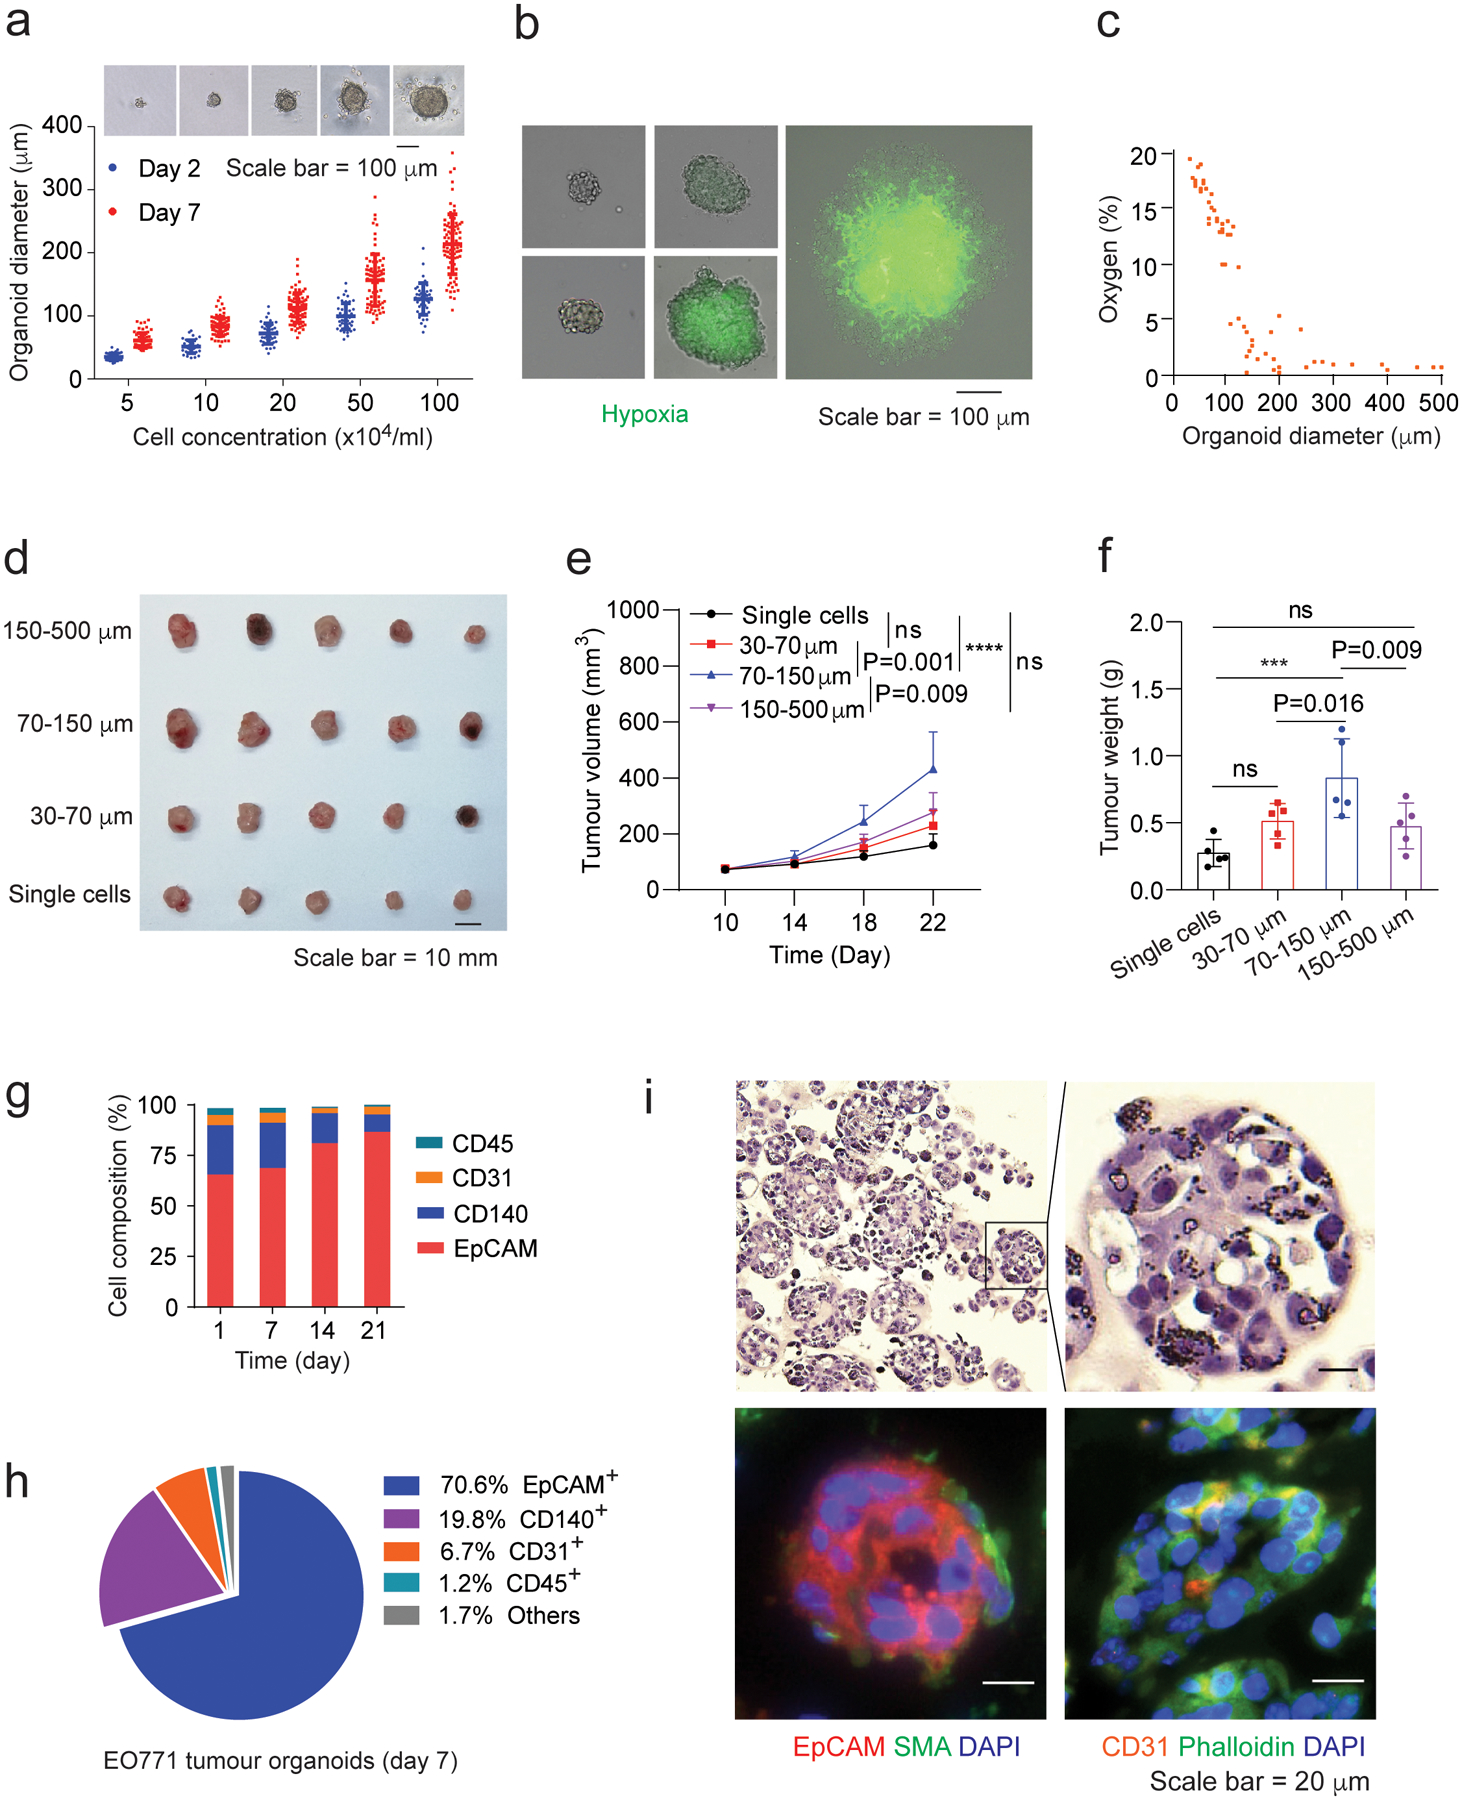
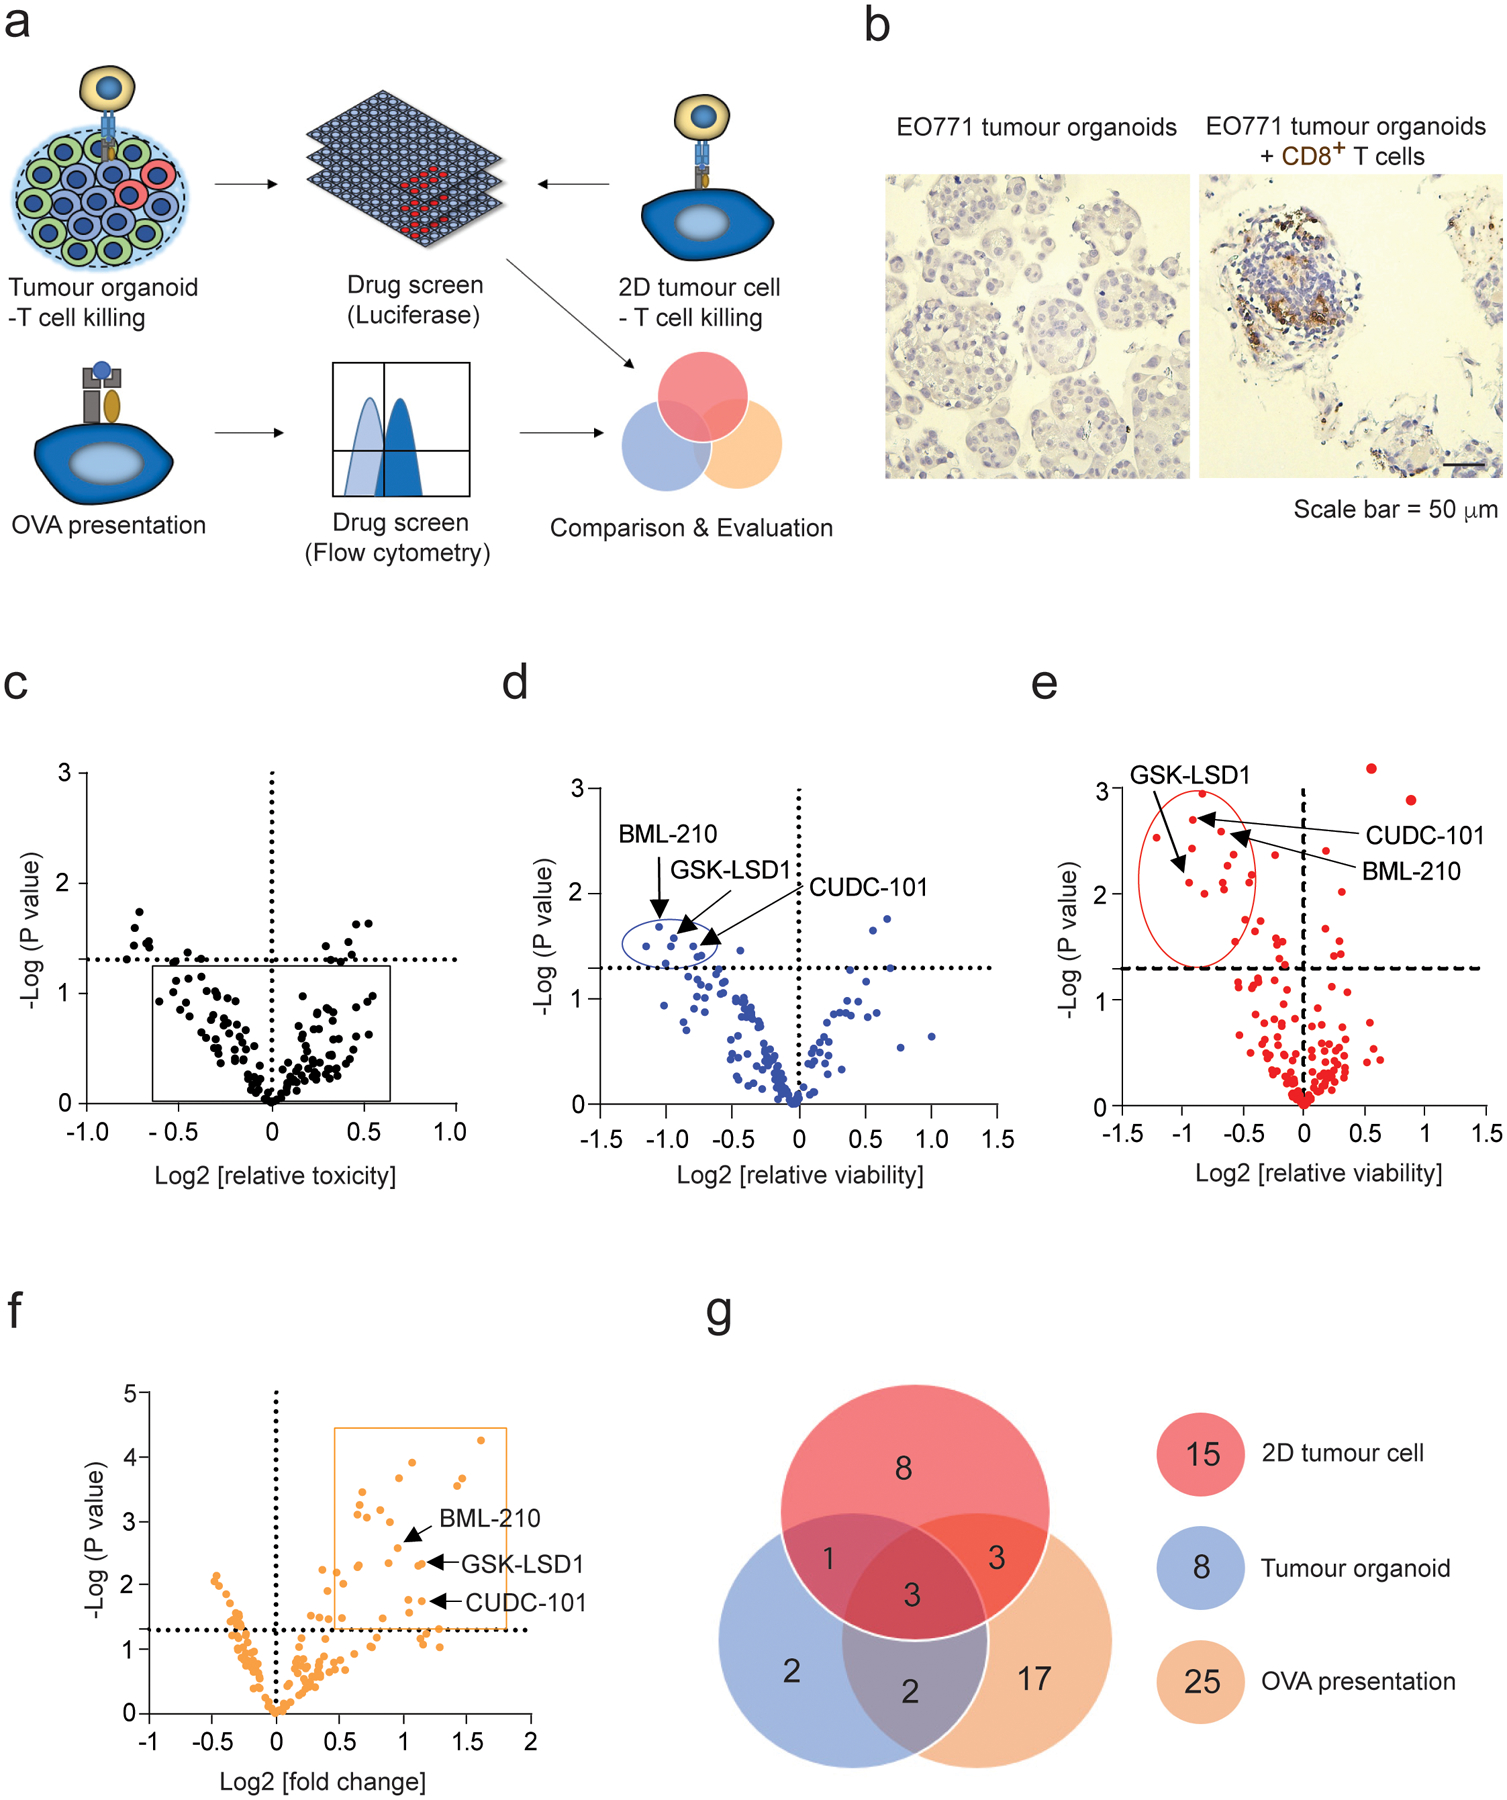
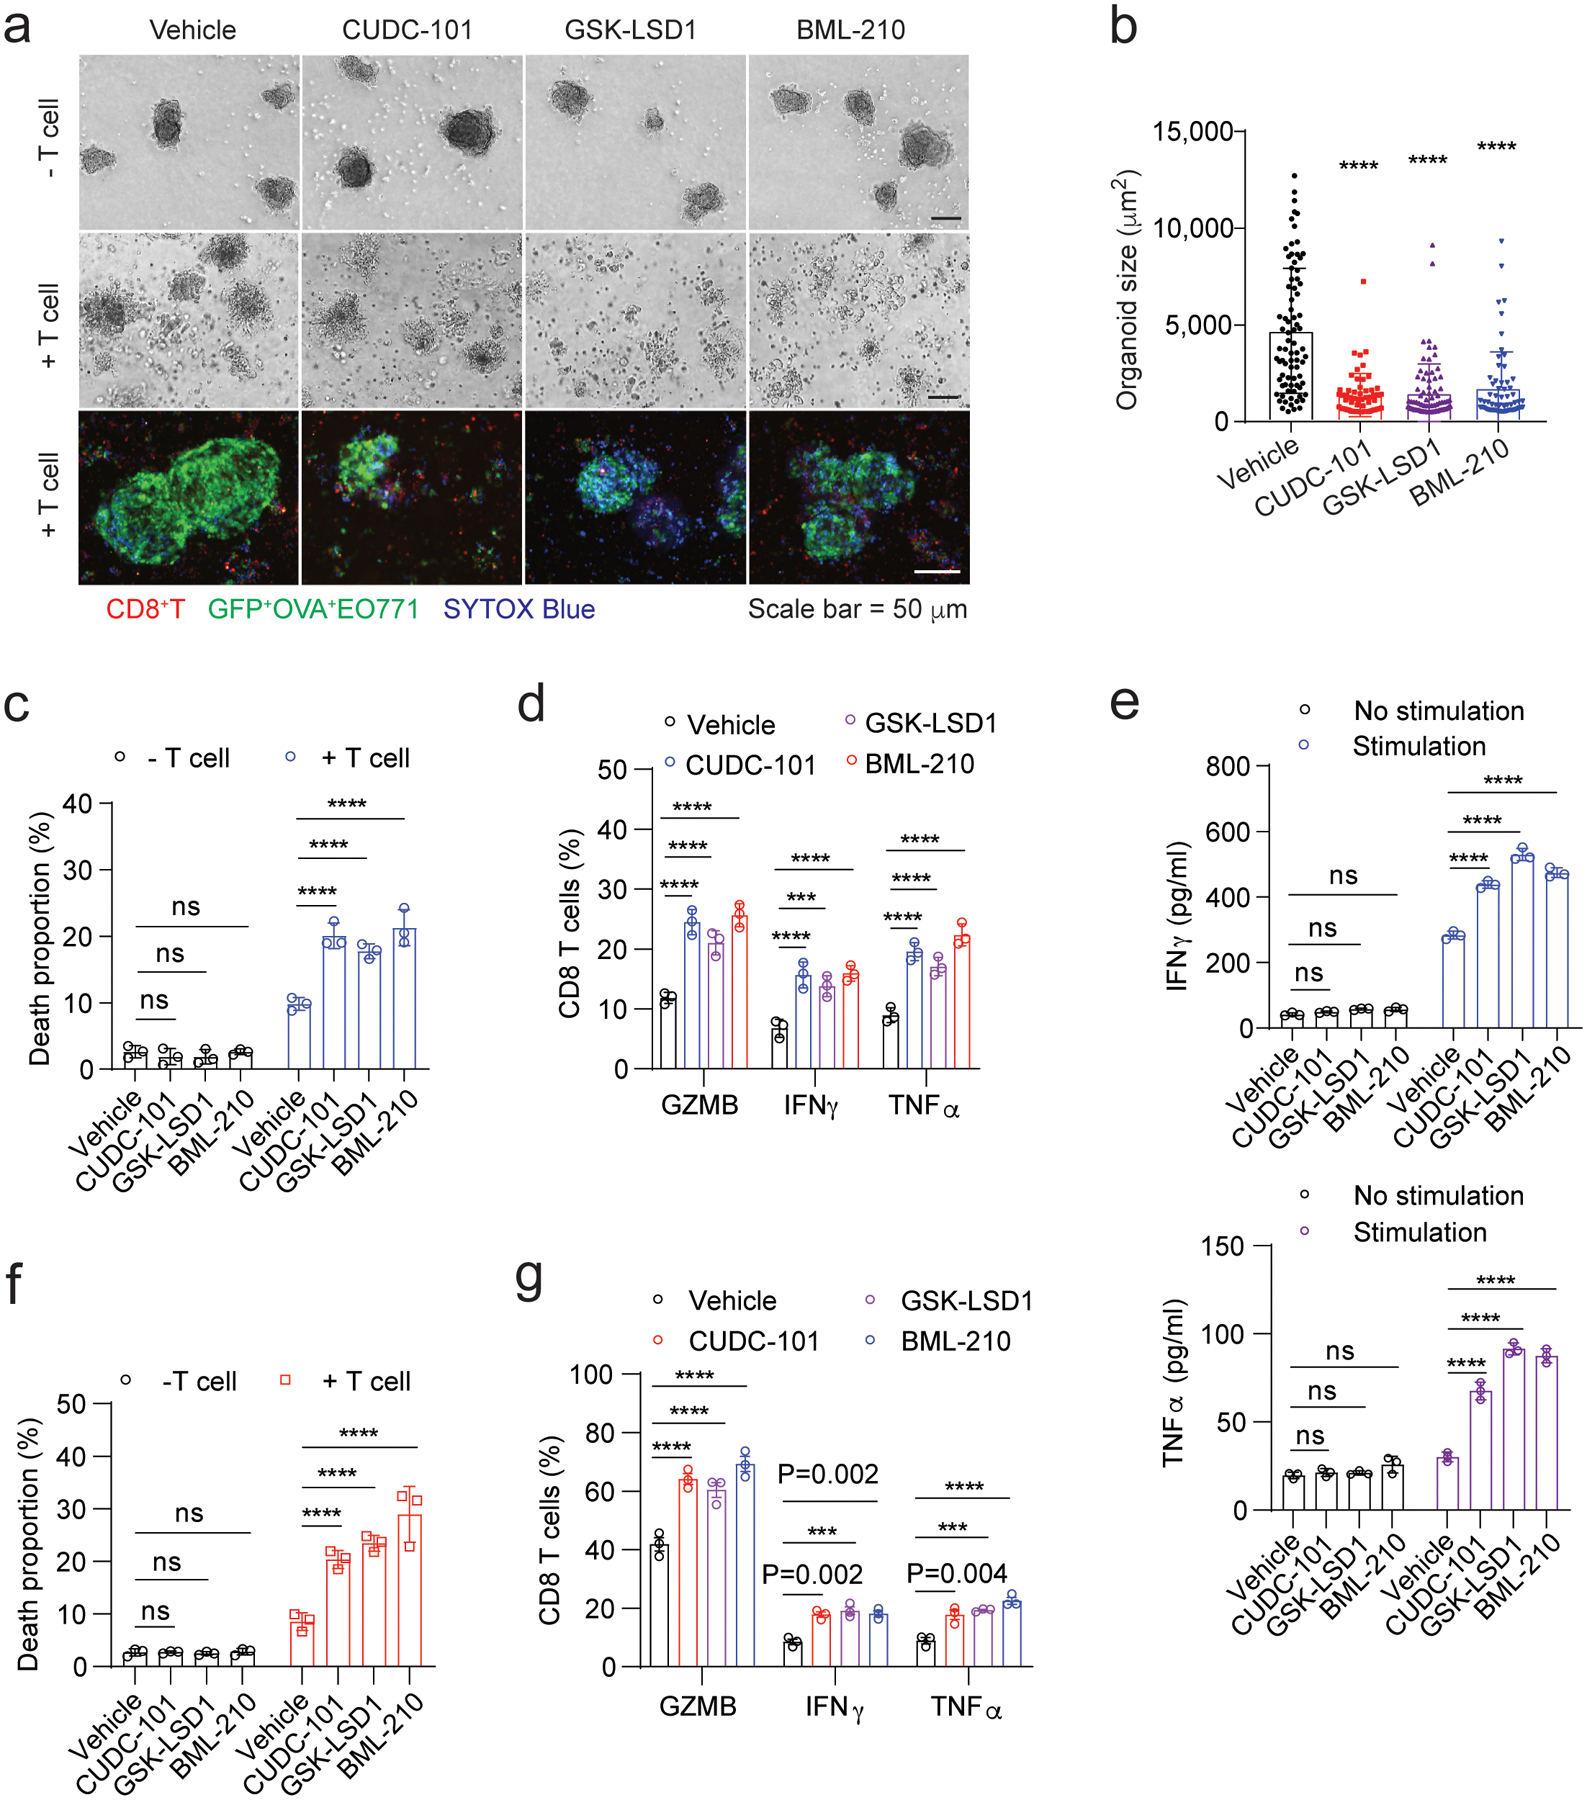
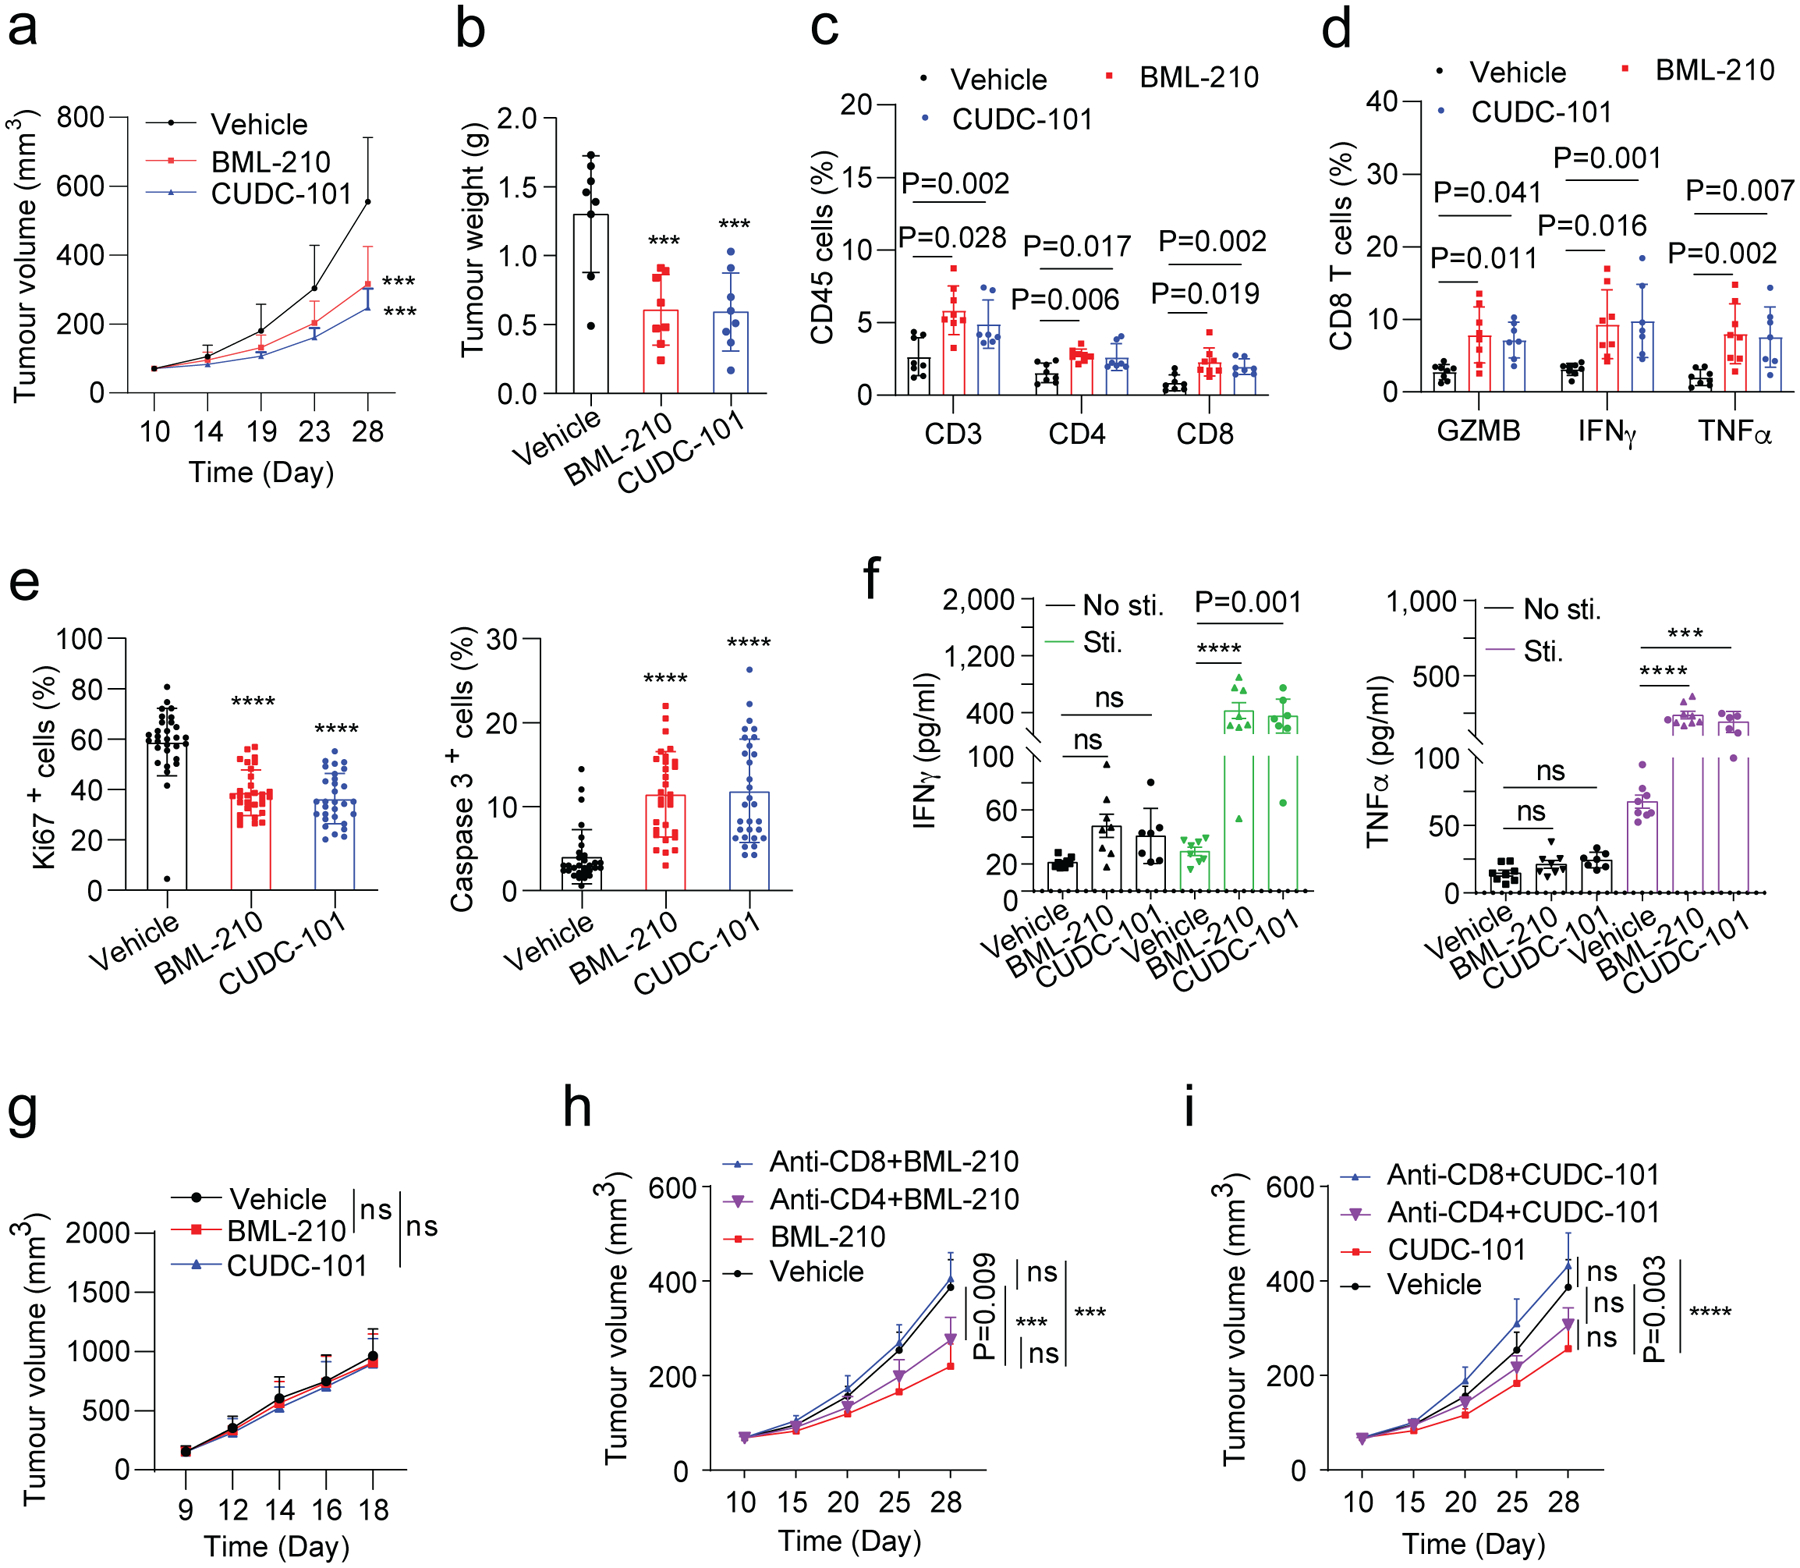
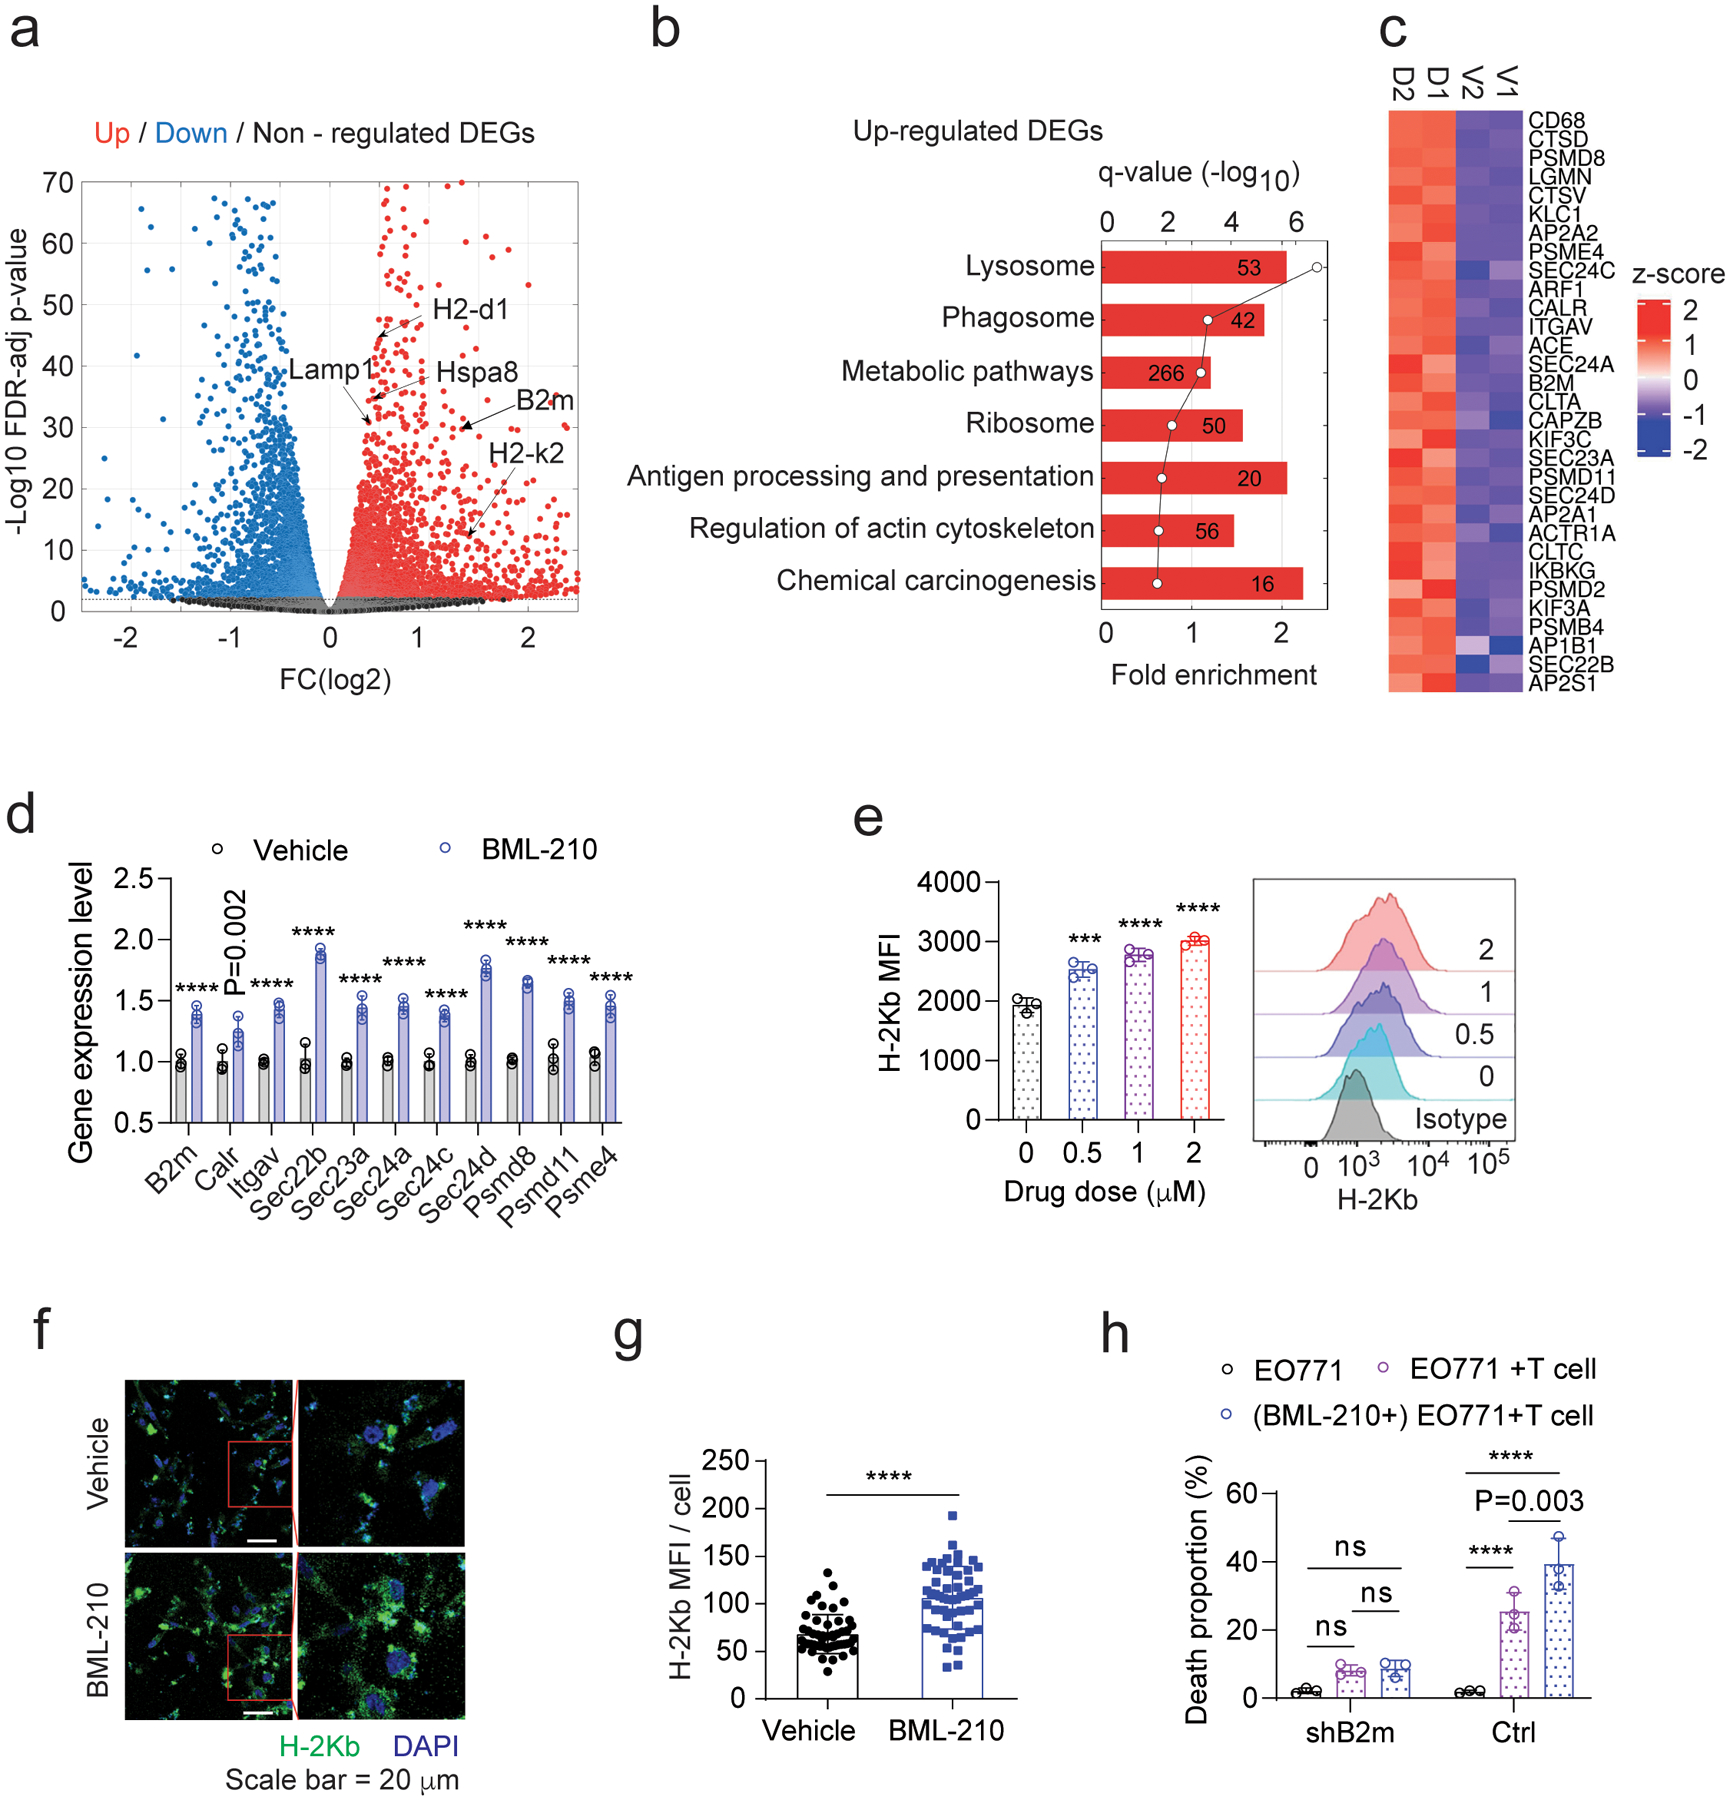
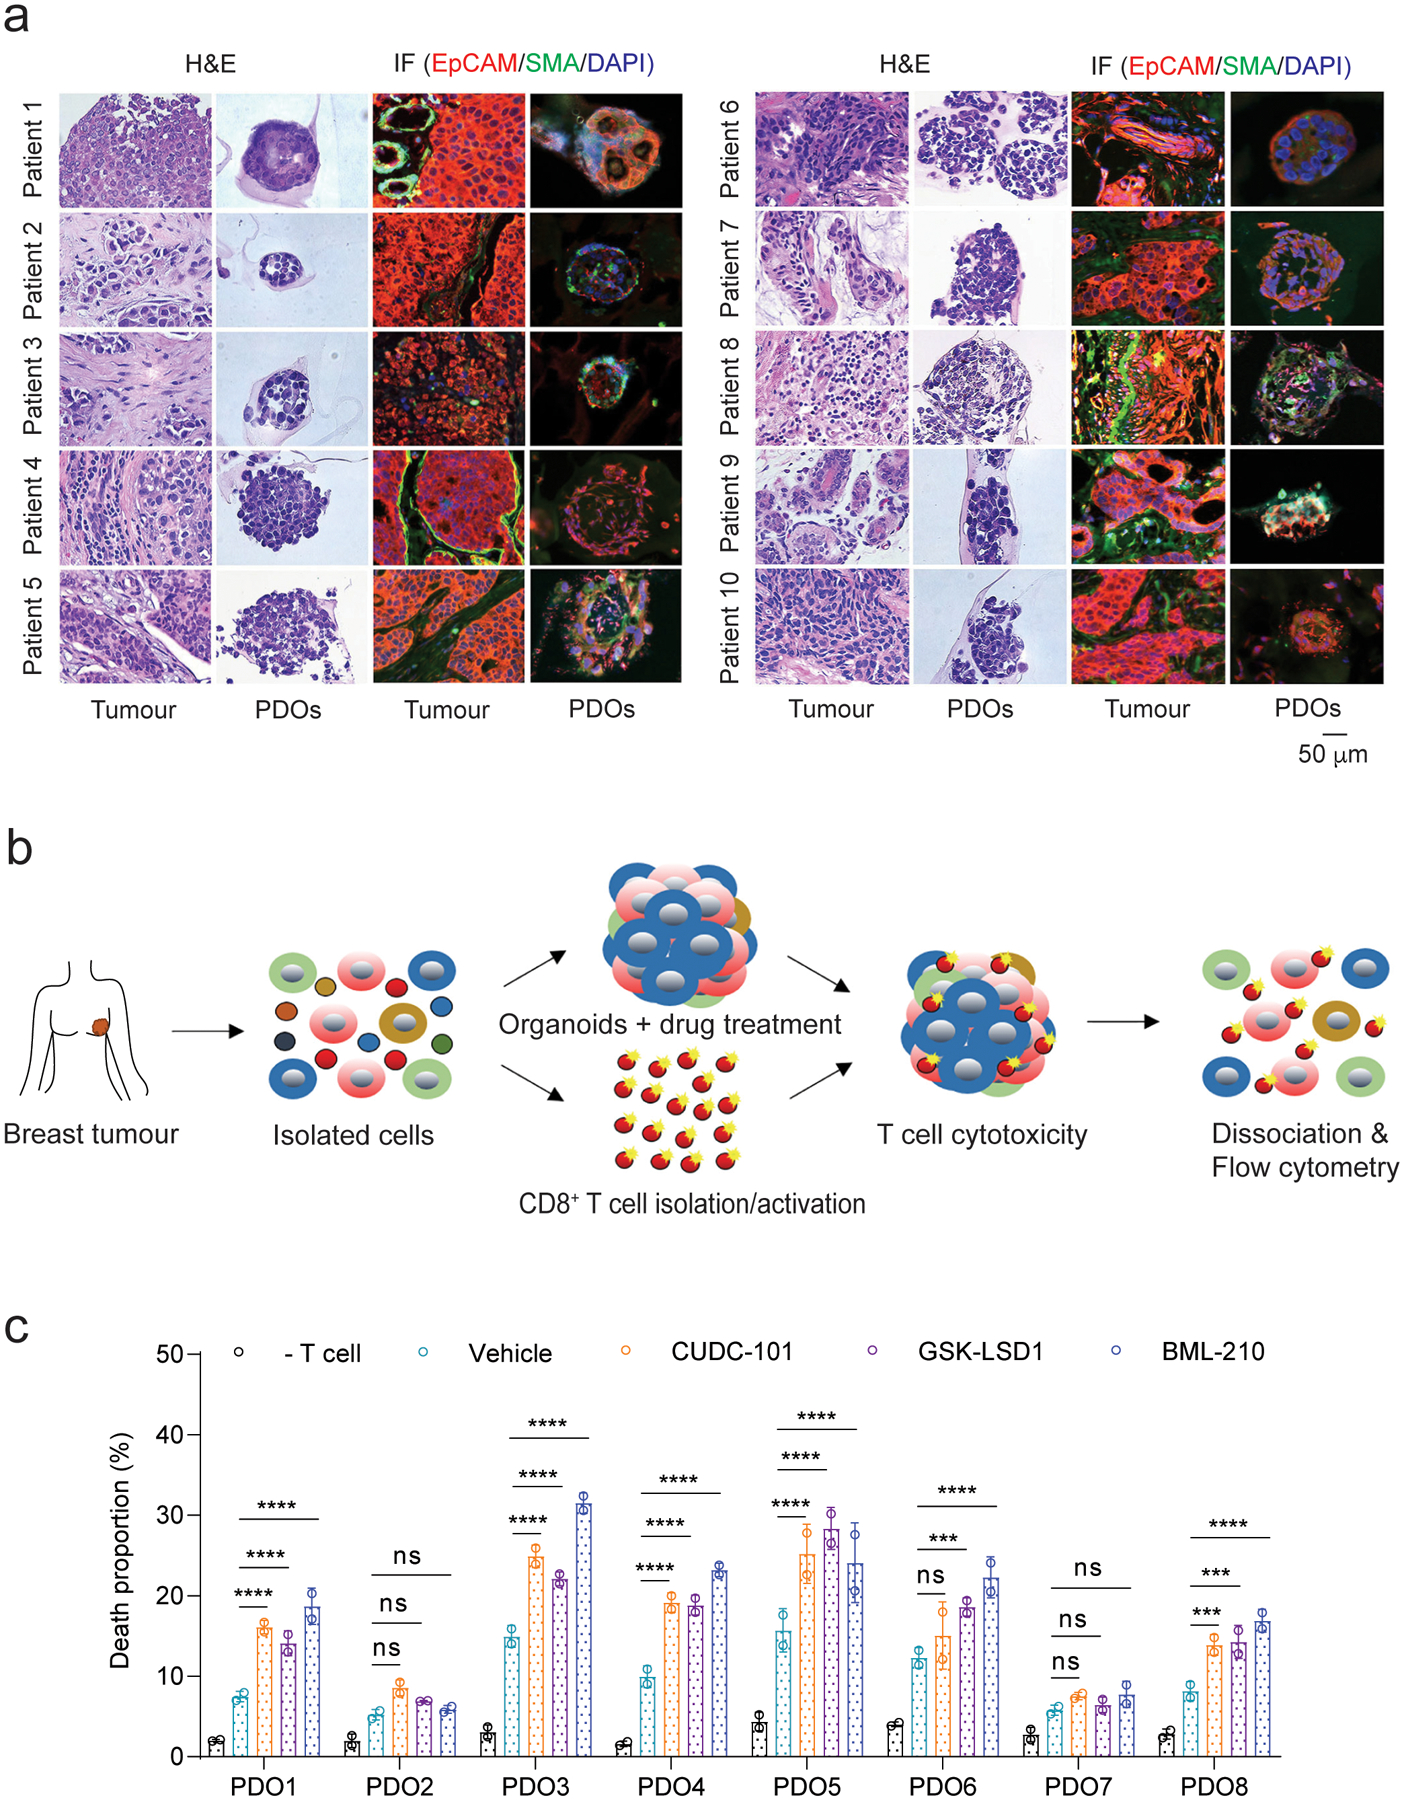
In breast cancer, genetic heterogeneity, the lack of actionable targets and immune evasion all contribute to the limited clinical response rates to immune checkpoint blockade therapy. Here, we report a high-throughput screen based on the functional interaction of mouse- or patient-derived breast tumour organoids and tumour-specific cytotoxic T cells for the identification of epigenetic inhibitors that promote antigen presentation and potentiate T-cell-mediated cytotoxicity. We show that the epigenetic inhibitors GSK-LSD1, CUDC-101 and BML-210, identified by the screen, display antitumour activities in orthotopic mammary tumours in mice, that they upregulate antigen presentation mediated by the major histocompatibility complex class I on breast tumour cells and that treatment with BML-210 substantially sensitized breast tumours to the inhibitor of the checkpoint programmed death-1. Standardized measurements of tumour-cell killing activity facilitated by tumour-organoid-T-cell screens may help with the identification of candidate immunotherapeutics for a range of cancers.


Conflict of interest statement

Competing interests

XL and XZ are submitting a patent for the organoid-based screen method and identified drugs in this study.

Figures

ED Fig. 1
ED Fig. 1. Functional evaluation of the compounds screened from the 2D and tumour-organoid systems.
a, Pie chart of the positive compounds screened from the 2D and tumour organoid systems. b, Effect of the above compounds (a) on T cell infiltration in tumour organoids. The CD8+ T cells (from OT-I mouse) were co-cultured with the compound-treated GFP+Luc+OVA+ EO771 tumour organoids for 48h. The tumour organoids with T cells infiltrated or attached were dissociated to single cells and stained with APC/Cy7-conjugated anti-mouse CD8 and SYTOX Blue reagent for 15 min. The T cell proportions from the tumour organoids were analyzed by flow cytometry. Data from 3 biologically parallel experiments were analyzed using One-way ANOVA and presented as mean ± SD. ***, p < 0.001; ****, p < 0.0001. c, Representative flow cytometry data showing the CD8+ T cell proportion in the GFP+Luc+OVA+ EO771 tumour organoids. A total of 20,000 events per cell sample were collected for data analysis. d, Representative optical images of CD8+ T cells co-cultured with the GFP+Luc+OVA+ EO771 tumour organoids. e-g, Gross dissected mammary tumour images (e), tumour growth (f) and weight (g) of the EO771 tumours from the tumour-bearing C57BL/6 mice treated with vehicle control, PFI-1 (20 mg kg−1), or Bromosporine (20 mg kg−1). Tumours were harvested at day 28 post injection. For statistical analysis of data, one-way ANOVA test was used in (f,g). Data are presented as mean ± SD. ns, no significance
ED Fig. 2
ED Fig. 2. Validation of antitumour activity of the three drug candidates in human tumour organoids.
a, Schematic illustration of the drug-validation test using NY-ESO-1+ MDA-MB-468 organoids co-cultured with NY-ESO-1-specific CD8+ T cells. Human breast cancer-associated fibroblasts (CAFs) were used with MDA-MB-468 cells to generate tumour organoids. b, Optical images showing the co-culture of the CD8+ T cells and MDA-MB-468 tumour organoids treated with control or drug candidates.
ED Fig. 3
ED Fig. 3. Antitumour activity of drug candidates in mouse breast tumour models.
a, Drug-treatment scheme of mouse breast tumour models. b, Gross dissected mammary tumour images of the EO771 tumours from the tumour-bearing C57BL/6 mice treated with vehicle control, BML-210 (20 mg kg−1), or CUDC-101 (20 mg kg−1). c, IHC staining images of Ki67+ and cleaved Caspase 3+ cells in the tumour tissues. d, Gross dissected mammary tumour images of the EO771 tumours from the tumour-bearing nude mice treated with vehicle control, BML-210 (20 mg kg−1), or CUDC-101 (20 mg kg−1). Tumours from nude mice were harvested at day 18 post injection. e, Gross mammary tumour images of the EO771 tumours from the tumour-bearing C57BL/6 mice treated with isotype control, CUDC-101 (20 mg kg−1), BML-210 (20 mg kg−1), anti-CD8 (10 mg kg−1) + CUDC-101 (20 mg kg−1), anti-CD8 (10 mg kg−1) + BML-210 (20 mg kg−1), anti-CD4 (10 mg kg−1) + CUDC-101 (20 mg kg−1) or anti-CD4 (10 mg kg−1) + BML-210 (20 mg kg−1). Tumours from tumour-bearing C57BL/6 mice were harvested at day 28 post injection.
ED Fig. 4
ED Fig. 4. Antitumour activity of BML-210 and CUDC-101 in mouse breast tumour models with CD4+ or CD8+ T-cell depletion.
a, Drug-treatment scheme of mouse breast tumour models. b, Flow cytometry gating strategy for analysis of CD4+ and CD8+ T cells from EO771 tumours in C57BL/6 mice. c, Typical graphs showing the proportion of CD4+ and CD8+ T cells in total T cells (CD3+) from EO771 tumours treated with vehicle control or indicated compound, and with CD4 or CD8 depletion. d,e, Proportions of CD8+ (d) and CD4+ (e) T cells in total T cells from EO771 tumours with CD4 or CD8 depletion. f,g, Weight of the EO771 tumours from the tumour-bearing C57BL/6 mice treated with control, CUDC-101 (20 mg kg−1), BML-210 (20 mg kg−1), anti-CD8 (10 mg kg−1) + CUDC-101 (20 mg kg−1), anti-CD8 (10 mg kg−1) + BML-210 (20 mg kg−1), anti-CD4 (10 mg kg−1) + CUDC-101 (20 mg kg−1) or anti-CD4 (10 mg kg−1) + BML-210 (20 mg kg−1). Tumours from tumour-bearing C57BL/6 mice were harvested at day 28 post injection. For statistical analysis of data, two-way ANOVA test was used in (d,e). One-way ANOVA test was used in (f,g). Data are presented as mean ± SD. ****, p < 0.0001; ns, no significance.
ED Fig. 5
ED Fig. 5. Antitumour activity of GSK-LSD1 in mouse breast tumour models.
a, Drug-treatment scheme of mouse breast tumour models. b-d, Gross dissected mammary tumour images (b), tumour growth (c) and weight (d) of the EO771 tumours from the tumour-bearing C57BL/6 mice treated with vehicle control, GSK-LSD1 (20 mg kg−1). e, Proportions of total T, CD4+ T, and CD8+ T cells in total immune (CD45+) cells in the EO771 tumours treated with control, GSK-LSD1. f, Percentage of active cells in total CD8+ T cells, indicated by GZMB+, IFNγ+, TNFα+ in flow cytometry analysis. g, IHC staining images of Ki67+ and cleaved Caspase 3+ cells in the tumour tissues. h,i, Quantitative results for (g). For statistical analysis of data, Two-sided Student’s t-test was used in (c,d,h,i) and two-way ANOVA test was used in (e,f). Data are presented as mean ± SD. ***, p < 0.001; ****, p < 0.0001; ns, no significance.
ED Fig. 6
ED Fig. 6. Drug candidates promotes the expression of genes in the antigen presentation of breast tumour cells
a, Gene-set enrichment plot of the antigen processing and presentation pathway in EO771 cells treated with BML-210 in comparison with the cells treated with vehicle control. b, Validation of up-regulated genes from Fig.6c in human MDA-MB-468 cells treated with vehicle control or BML-210 (1.0 μM) by quantitative RT-PCR. c, Levels of HLA-A,B,C on the NY-ESO-1+ MDA-MB-468 cells treated with control or BML-201, determined by MFI in flow cytometry analysis. d, H-2k expression levels in the OVA+ EO771 cells treated with CUDC-101 or GSK-LSD1 were determined by qRT-PCR. e, HLA gene expression levels in NY-ESO-1+ MDA-MB-468 cells treated with CUDC-101 or GSK-LSD1 were determined by qRT-PCR. f, B2M expression levels in the OVA+ EO771 cells treated with CUDC-101 or GSK-LSD1 were determined by qRT-PCR. g,h, The effect of drug treatment on the H-2Kb and HLA-A2 antigen presentation on OVA+ EO771 cells and NY-ESO-1+ MDA-MB-468 cells, respectively. Data (b,d-f) from 3 biologically parallel experiments were analyzed using Two-way ANOVA. Data (c,g,h) from 3 biologically parallel experiments were analyzed using One-way ANOVA. ***, p < 0.001; ****, p < 0.0001; ns, no significance.
ED Fig. 7
ED Fig. 7. BML-210 promotes the expression of genes in the antigen presentation of breast tumour cells
a,b, Confocal images showing H-2Kb and HLA-A2 on OVA+ EO771 cells (a) and NY-ESO-1+ MDA-MB-468 cells (b), respectively. The immunofluorescence images were analyzed by ImageJ. c, Quantitative analysis of confocal images in (a) for assessing H-2Kb antigen presentation. d, Quantitative analysis of confocal images in (b) for assessing HLA-A2 antigen presentation. e, Western blot showing B2M protein expression levels in OVA+ EO771 cells treated with BML-210 drug with 0, 0.1, 1 μM for 48h. f, Western blot showing B2M knockdown in OVA+ EO771 cells. One-way ANOVA test was conducted for statistical analysis in (c,d). Data are presented as mean ± SD. ****, p < 0.0001.
Fig. 1 |
Fig. 1 |. A tumour-organoid-based approach for screening immunotherapy drugs.
The drug screen approach is composed of breast tumour organoids and tumour-specific CD8+ T cells. A lentiviral vector expressing OVA was transduced to the Luc+ EO771 cells. The resulting OVA+ cells were orthotopically transplanted to C57BL/6 mice to generate syngeneic mammary tumours. The tumours were harvested and dissociated to single cells for 2D culture and only the adherent cells were collected to generate tumour organoids. 2 ml of tumour organoid culture medium (2 × 10⁵ cells/ml) was seeded into 6-well culture plate with ultra-low attachment surface. After 7-day culture, tumour organoids were filtered by cell strainers with nylon mesh between 70 and 150 μm. The tumour organoids with diameter between 70 and 150 μm were treated with drugs for 48 h in the matrigel-free medium. The treated tumour organoids were then co-cultured with the pre-activated and OVA-specific CD8+ T cells from OT-I mice in the breast organoid culture medium containing 10 ng ml−1 IL2 without matrigel for 24 h. The luciferase released from the EO771 cells was measured using a Dual-luciferase report assay system (Promega) on a BioTek Cytation5 imaging reader, to assess the T cell-mediated cytotoxicity effect.
Fig. 2 |
Fig. 2 |. Characterization and optimization of mouse breast tumour organoids.
a,Organoid diameter versus cell seeding concentration at day 2 and day 7 of organoid culture. Optical images show tumour organoids at day 7. Optical images were analyzed using ImageJ to determine the organoid size. b, Hypoxia characterization of the EO771 tumour organoids under optical and fluorescence light. Image-iT Green Hypoxia reagent was used to show hypoxia in tumour organoids. The merged images with optical light and fluorescence were captured under a Leica DM4B microscope with two channels (optical light and 488 nm excitation). c, Oxygen levels in tumour organoids determined by hypoxia-caused fluorescence intensity from Supplementary Fig. 2b according to the protocol of the Image-iT Green Hypoxia reagent. d, Breast tumours derived from transplanted tumour organoids with indicated sizes. Tumour organoids containing 2 × 10⁵ tumour cells were injected into each mouse and the resulting tumours were harvested 22 days post injection. e,f, Growth (e) and weight (f) of the tumour organoid-derived breast tumours. g, Cellular composition of the EO771 tumour organoids with indicated culture times. 20,000 events per cell sample were collected. The data were analyzed from 3 biologically parallel experiments. h, The typical cellular composition of the EO771 tumour organoids at day 7 of culture. i, H&E staining (upper panels) and immunofluorescent staining (bottom panels) of the EO771 tumour organoids. One-way ANOVA test was used for statistical analysis(e,f). Data are presented as mean ± SD. ***, p < 0.001; ****, p < 0.0001; ns, no significance.
Fig. 3 |
Fig. 3 |. Screening of epigenetic inhibitors that enhance T-cell-mediated tumour-cell killing.
a, Schematic illustration of epigenetic drug screening based on 3D tumour organoid culture, 2D tumour cell culture, and antigen presentation on the 2D cultured tumour cells. b, Immunohistochemical (IHC) staining of CD8+ T cells in the EO771 organoids co-cultured with and without CD8+ T cells. CD8+ T cells are stained in brown colour. c, Volcano plot analysis of epigenetic inhibitors’ toxicity for the tumour cells in EO771 (Luc+OVA+) tumour organoids at the concentration of 1.0 μM. The compounds without substantial toxicity effect in the absence of CD8+ T cells were shown in the square. d, Volcano plot analysis showing the effect of epigenetic inhibitors on the CD8+ T cell-mediated cytotoxicity in the co-culture with the EO771 tumour organoids. The EO771 tumour organoids were treated with epigenetic inhibitors for 48 h and then co-cultured with CD8+ T cells for 24 h. Compounds shown in the circle significantly promoted T cell-mediated cytotoxicity (log2[relative viability] < −0.5; p < 0.05). Relative viability = (tumour cell viability of treated group)/(tumour cell viability of control group). e, Volcano plot analysis showing the effect of epigenetic inhibitors on the CD8+ T cell-mediated cytotoxicity for the EO771 (Luc+OVA+) cells in 2D culture. Compounds shown in the circle significantly promoted T cell cytotoxicity (log2[relative viability] < −0.5; p <0.05).The cytotoxicity in (d) and (e) was quantified using luciferase assay. f, Volcano plot analysis showing the effect of epigenetic inhibitors on OVA antigen presentation of the EO771 (Luc+OVA+) cells. Compounds shown in the rectangle significantly promoted OVA antigen expression (log2[OVA presentation/control] > 0.5; p < 0.05). 10,000 events per cell sample in flow cytometry were collected for data analysis. The mean fluorescence intensity (MFI) from the cells stained with APC-conjugated OVA peptide SIINFEKL antibody represents the OVA expression levels. g, Pie chart of positive compounds screened from the three screening methods. One-way ANOVA test was conducted in c-f. p value < 0.05 in the volcano plots was considered as significant difference. The data for the drug screen represent 3 biologically parallel experiments.
Fig. 4 |
Fig. 4 |. Validation of antitumour activity of the three drug candidates in mouse and human tumour organoids
a, The cytotoxicity of OVA-specific CD8+ T cells on the OVA+ EO771 tumour organoids treated with control or drug candidates. The upper and middle panels are optical images. In the bottom confocal images, SYTOX Blue reagent staining dead cells are shown in blue colour. EO771 (GFP+Luc+OVA+) cells are shown in green colour and CD8+ T cells are shown in red colour. b, Size of OVA+ EO771 tumour organoids treated with control or drug candidates in the co-culture with OVA-specific CD8+ T cells. Optical images were analyzed using ImageJ to determine the organoid size. c, Death proportion of the OVA+ EO771 tumour cells in the tumour organoids treated with control or drug candidate, which was measured by flow cytometry. Typical dead cell gating and analysis are shown in Supplementary Fig. 3a,b. d, The percentages of OVA-specific CD8+ T cells positive for GZMB, IFNγ and TNF-α in the co-culture with tumour organoids treated with control or drug candidates. e, Levels of IFNγ and TNF-α secreted from the OVA-specific CD8+ T cells from the co-culture with the tumour organoids as indicated. The secretion of IFNγ and TNF-α was stimulated with PMA and ionomycin. f, Death proportion of NY-ESO-1+ MDA-MB-468 cells treated with control or drug candidates in the co-culture with the NY-ESO-1-specific CD8+ T cells. Typical dead cell gating and analysis are shown in Supplementary Fig. 3d,e. g, The percentages of the NY-ESO-1+ CD8+ T cells positive for GZMB, IFNγ and TNF-α in the co-culture with the MDA-MF-468 tumour organoids treated with control or drug candidates. For statistical analysis of data, one-way ANOVA test was used in (b) and two-way ANOVA test was used in (c-g). Data (c-g) are presented as mean ± SD and are representative of 3 biologically parallel experiments. ***, p < 0.001; ****, p < 0.0001; ns, no significance.
Fig. 5 |
Fig. 5 |. Antitumour activity of drug candidates in mouse breast tumour models.
a,b, Gross dissected mammary tumour growth (a) and weight (b) of the EO771 tumours from the tumour-bearing C57BL/6 mice treated with vehicle control, BML-210 (20 mg kg−1), or CUDC-101 (20 mg kg−1). c, Proportions of total T, CD4+ T, and CD8+ T cells in total immune (CD45+) cells in the EO771 tumours from mice treated with control, BML-210 or CUDC-101. d, Percentage of active cells in total CD8+ T cells, indicated by GZMB+, IFNγ+, TNFα+ in flow cytometry analysis. e, Quantitative results for tumour cell proliferation (Ki67+) and apoptosis (Caspase 3+) in the tumours analyzed by IHC staining images (Extended Data Fig.3c). f, Levels of secreted IFNγ and TNF-α from CD8+ T cells isolated from the tumour tissues with and without PMA and ionomycin stimulation. g, Gross dissected mammary tumour growth of the EO771 tumours from the tumour-bearing immunodeficient nude mice treated with vehicle control, BML-210 (20 mg kg−1), or CUDC-101 (20 mg kg−1). Tumours from immunodeficient mice were harvested at day 18 post injection. h,i, Gross mammary tumour growth of the EO771 tumours from the tumour-bearing C57BL/6 mice treated with isotype control, CUDC-101 (20 mg kg−1), BML-210 (20 mg kg−1), anti-CD8 (10 mg kg−1) + CUDC-101 (20 mg kg−1), anti-CD8 (10 mg kg−1) + BML-210 (20 mg kg−1), anti-CD4 (10 mg kg−1) + CUDC-101 (20 mg kg−1) or anti-CD4 (10 mg kg−1) + BML-210 (20 mg kg−1). Tumours from tumour-bearing C57BL/6 mice were harvested at day 28 post injection. For statistical analysis of data, one-way ANOVA test was used in (a,b,e,g-i), and two-way ANOVA test was used in (c,d,f). Data are presented as mean ± SD. ***, p < 0.001; ****, p < 0.0001; ns, no significance.
Fig. 6 |
Fig. 6 |. BML-210 treatment upregulates tumour-antigen processing and presentation.
a, Volcano plot analysis of total RNA-seq data shows differentially expressed genes (DEGs) in EO771 cells treated with vehicle control or BML-210 (1.0 μM). A FDR cut-off of 0.01 was used to determine significantly differential expressed genes. b, Gene pathway analysis of up-regulated DEGs in the EO771 cells treated with BML-210. c, Heatmap shows the BML-210-induced up-regulation of DEGs enriched in antigen processing and presentation. V1 and V2 refer to the vehicle control groups (vehicle 1 and vehicle 2); D1 and D2 refer to the BML-210 drug treatment groups 1 and 2. d, Validation of up-regulated genes from (c) in mouse EO771 cells treated with control or BML-210 (1.0 μM) by quantitative RT-PCR. e, Levels of H-2Kb on the OVA+ EO771 cells treated with control or BML-210, which were determined by mean fluorescence intensity (MFI) in flow cytometry analysis. f, Confocal images showing H-2Kb (green) presented on the OVA+ EO771 cells treated with control or BML-210. Blue colour in the images refers to DAPI-stained cell nuclei. g, Quantitative analysis of images in (f) for assessing H-2Kb antigen presentation. h, Death proportions of the OVA+ EO771 tumour cells with and without B2M knockdown in the tumour organoids were measured by flow cytometry analysis. The SYTOX Blue reagent was used to determine the cell death proportion. One-way ANOVA test was conducted for statistical analysis in (e). Two-way ANOVA test was conducted for statistical analysis in (d,h). Two-sided Student’s t-test was performed for statistical analysis in (g). Data (d,e,h) from three biologically parallel experiments are presented as mean ± SD. ***, p < 0.001; ****, p < 0.0001; ns, no significance.
Fig. 7 |
Fig. 7 |. BML-210 treatment enhances antitumour responses in combination with PD-1 blockade.
a, Analysis of immune profile and microenvironment of the mouse EO771 tumours in C57BL/6 mice treated with control or BML-210 using a CyTOF panel containing 27 markers (Supplementary Table 2). tSNE representation of the immune cell subtypes and percentages of distinct immune cell populations in the tumours are shown. b,c, tSNE representation and quantitative analysis of CD8+ T cells (b) and PMN-MDSCs (CD11b+Ly6G+Ly6ClowF4/80) (c) in the EO771 tumours with control or BML-210 treatment. The colour scale is specific for each channel. The dot plot is spectrum coloured for the indicated channel; the minimum and maximum values for the expression intensity are determined upon global expression using Cytobank. d-f, Gross dissected mammary tumour images (d), tumour growth (e) and weight (f) of the EO771 tumours from the tumour-bearing C57BL/6 mice treated with vehicle control, BML-210 (20 mg kg−1), PD-1 antibody (200 μg per mouse), or BML-210 and PD-1 antibody combo. g,h, Histograms and quantitative results of CD8+ T cells and cleaved Caspase 3+ cells in the tumour tissues with indicated treatment. Each individual symbol in (g) and (h) represents the percentage of the positive cells from the total cells in an independent field. A total of 20 images in each group were analyzed to quantify the cell proportion. Two-sided Student’s t-test was performed for statistical analysis in (b,c). One-way ANOVA test was conducted for statistical analysis in (e,f,h). All the data are presented as mean ± SD. ***, p < 0.001; ****, p < 0.0001; ns, no significance.
Fig.8 |
Fig.8 |. Treatment of BML-210, CUDC-101 or GSK-LSD1 promotes the cytotoxicity of autologous CD8+ T cells in patient-derived organoids (PDOs).
a, Characterization of PDOs from six breast cancer patients using H&E staining and immunofluorescence analysis. EpCAM+ and α-SMA+ cells represent breast cancer epithelial cells and cancer-associated fibroblast cells, respectively. b, Schematic illustration of the co-culture of PDOs and autologous tumour-infiltrating CD8+ T cells. c, Death proportions of tumour cells in the PDOs treated with control, BML-201, CUDC-210 or GSK-LSD1 after co-culture with autologous CD8+ T cells. Two-way ANOVA test was used for statistical analysis and data from two biologically parallel experiments are presented as mean ± SD. ***, p < 0.001; ****, p < 0.0001; ns, no significance.

References

    1. Gatti-Mays ME et al. If we build it they will come: targeting the immune response to breast cancer. NPJ Breast Cancer 5, 37 (2019). - PMC - PubMed
    1. Dijkstra KK et al. Generation of Tumor-Reactive T Cells by Co-culture of Peripheral Blood Lymphocytes and Tumor Organoids. Cell 174, 1586–1598 e1512 (2018). - PMC - PubMed
    1. Sachs N et al. A Living Biobank of Breast Cancer Organoids Captures Disease Heterogeneity. Cell 172, 373–386 e310 (2018). - PubMed
    1. Stevanovic S et al. Landscape of immunogenic tumor antigens in successful immunotherapy of virally induced epithelial cancer. Science 356, 200–205 (2017). - PMC - PubMed
    1. Schmid P et al. Atezolizumab and Nab-Paclitaxel in Advanced Triple-Negative Breast Cancer. N Engl J Med 379, 2108–2121 (2018). - PubMed

Publication types