

Glomerular endothelial cell senescence drives age-related kidney disease through PAI-1
- PMID: 34725920
- PMCID: PMC8573606
- DOI: 10.15252/emmm.202114146
Glomerular endothelial cell senescence drives age-related kidney disease through PAI-1
Abstract
The mechanisms underlying the development of glomerular lesions during aging are largely unknown. It has been suggested that senescence might play a role, but the pathophysiological link between senescence and lesion development remains unexplained. Here, we uncovered an unexpected role for glomerular endothelial cells during aging. In fact, we discovered a detrimental cross-talk between senescent endothelial cells and podocytes, through PAI-1. In vivo, selective inactivation of PAI-1 in endothelial cells protected glomeruli from lesion development and podocyte loss in aged mice. In vitro, blocking PAI-1 in supernatants from senescent endothelial cells prevented podocyte apoptosis. Consistently, depletion of senescent cells prevented podocyte loss in old p16 INK-ATTAC transgenic mice. Importantly, these experimental findings are relevant to humans. We showed that glomerular PAI-1 expression was predictive of poor outcomes in transplanted kidneys from elderly donors. In addition, we observed that in elderly patients, urinary PAI-1 was associated with age-related chronic kidney disease. Altogether, these results uncover a novel mechanism of kidney disease and identify PAI-1 as a promising biomarker of kidney dysfunction in allografts from elderly donors.
Keywords: PAI-1; aging nephropathy; endothelial-podocyte cross-talk; kidney transplantation; senescence.
© 2021 The Authors Published under the terms of the CC BY 4.0 license.
Conflict of interest statement
B.G.C. and D.J.B. are shareholders and coinventors on patent applications licensed to or filed by Unity Biotechnology, a company developing senolytic medicines, including small molecules that selectively eliminate senescent cells. Research in the Baker laboratory has been reviewed by the Mayo Clinic Conflict of Interest Review Board and is being conducted in compliance with Mayo Clinic conflict of interest policies. All other authors declare that they have no conflict of interest.
Figures
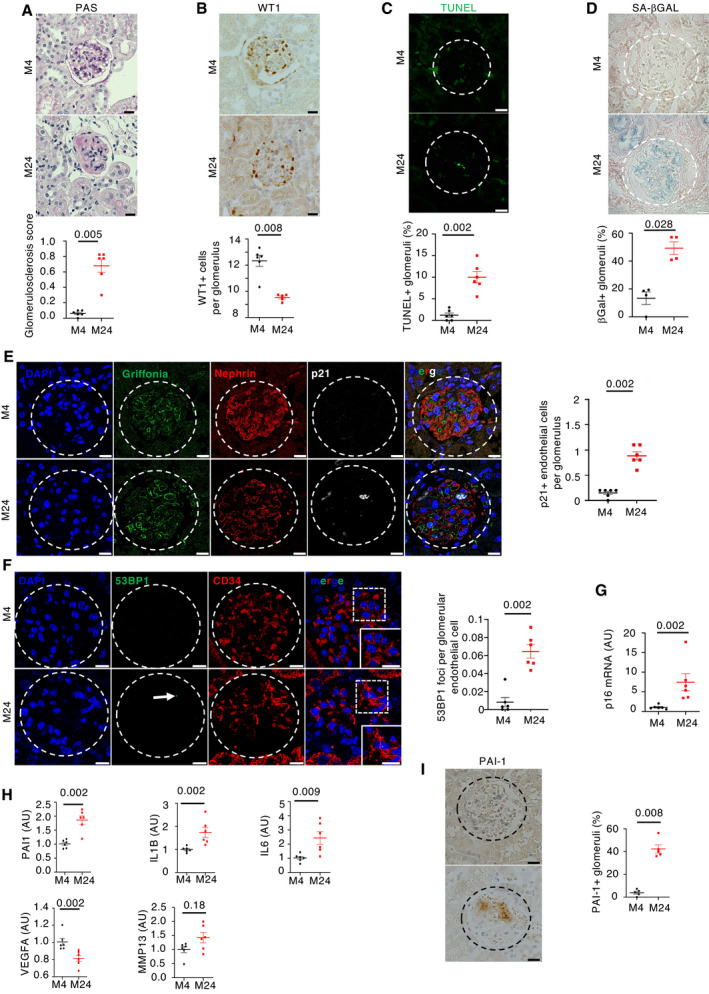
Morphology (PAS staining, upper panels) and quantification of glomerular lesions (lower panel) of kidneys from young and aged mice. Original magnification ×400. Scale bar = 20 μm. n = 6 for young and old mice.
WT1 immunohistochemistry (upper panels) and quantification of WT1‐positive glomerular cells (lower panel) in kidneys from young and aged mice. Original magnification ×400. Scale bar = 20 μm. n = 6 for young and old mice.
TUNEL assay (upper panels) and quantification of TUNEL‐positive tubular cells (upper panel) in glomeruli from young and aged mice. Panels are representative images of 6 young and old mice. Scale bar = 20 μm.
Senescence‐associated β‐galactosidase staining (upper panels) and quantification of β‐galactosidase‐positive glomeruli (lower panel) in kidneys from young and aged mice. Original magnification ×400. Scale bar = 20 μm. Panels are representative images of four young and old mice.
p21/griffonia simplicifolia/nephrin coimmunostaining in kidneys from young and aged mice (left panels) and quantification (right panel) of p21‐positive endothelial cells per glomeruli. Original magnification ×630. Scale bar = 10 μm. Panels are representative images of 6 young and old mice.
53BP1/CD34 coimmunostaining in kidneys from young and aged mice (left panels) and quantification (right panels) of 53BP1 foci per glomerular endothelial cell. Original magnification ×630. Scale bar = 10 μm. Panels are representative images of 6 young and old mice.
p16 mRNA expression in whole kidney from young and old mice. n = 6 for young and old mice.
mRNA expression of SASP components in kidneys from young and aged mice. n = 6 for young and old mice.
PAI‐1 immunohistochemistry (left panels) and quantification of PAI‐1‐positive glomeruli (right panel) in kidneys from young and aged mice. Original magnification ×400. Scale bar = 20 μm. n = 5 for young and old mice.
- A, B
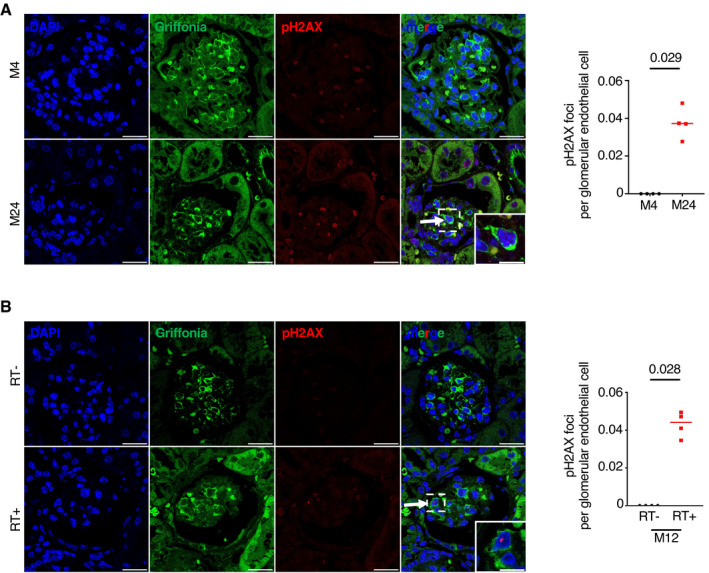
pH2AX/griffonia simplicifolia coimmunostaining (left panels) and quantification (right panel) in kidneys from (A) young and aged mice and (B) 12‐month‐old irradiated and non‐irradiated mice. Quantification represents the number of pH2AX foci per glomerular endothelial cell. Original magnification ×630. Scale bar = 10 μm. Panels are representative images of four mice in each group. Data are means ± SEM. Statistical analysis: Student's t‐test.
- A, B
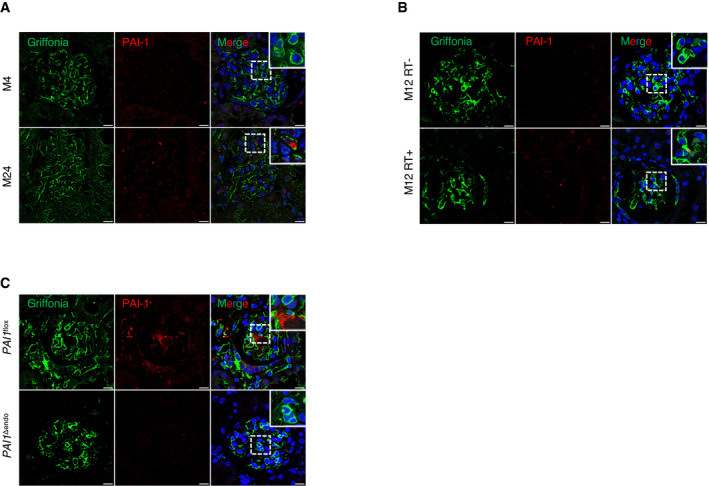
PAI‐1/griffonia simplicifolia coimmunostaining in kidneys from (A) young and aged mice and (B) 12‐month‐old irradiated and non‐irradiated mice.
- C
PAI‐1/griffonia simplicifolia coimmunostaining in kidneys from 22‐month‐old PAI‐1flox and PAI‐1Δendo mice. Original magnification ×630.
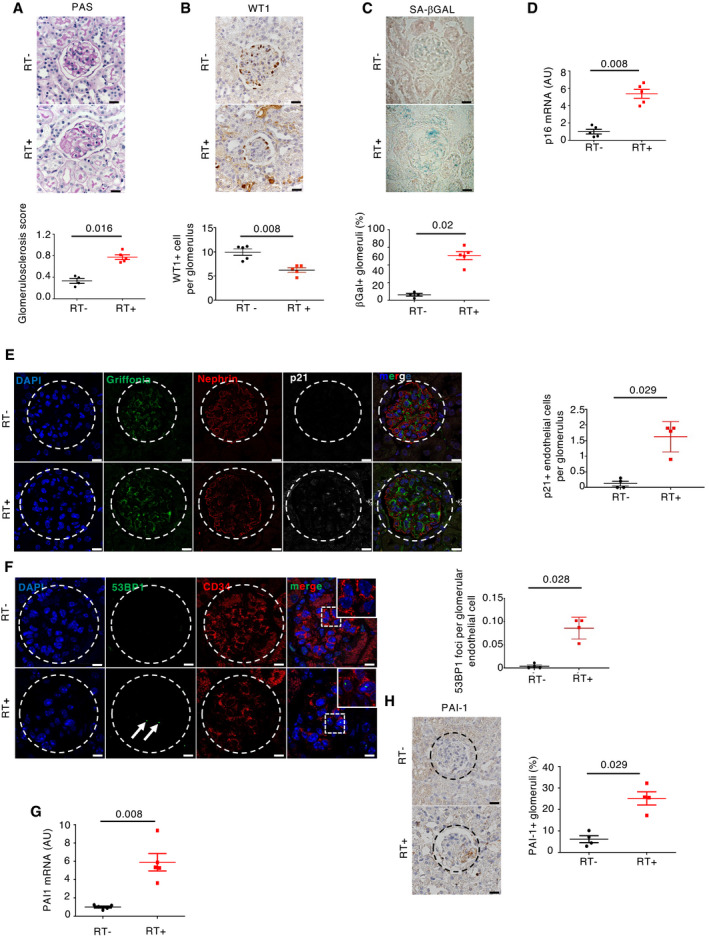
Morphology (PAS staining, upper panels) and quantification of glomerular lesions (lower panel) of kidneys from irradiated (RT+) and non‐irradiated (RT−) control mice 12 months after irradiation. Original magnification ×400. Scale bar = 20 μm. n = 4 and n = 5 for RT+ and RT−, respectively.
WT1 immunohistochemistry (upper panels) and quantification of WT1‐positive glomerular cells (lower panel) in kidneys from irradiated (RT+) and non‐irradiated (RT−) control mice 12 months after irradiation. Original magnification ×400. Scale bar = 20 μm. n = 5 for RT+ and RT− mice.
Senescence‐associated β‐galactosidase staining (upper panels) and quantification of β‐galactosidase‐positive glomeruli (lower panel) in kidneys from irradiated (RT+) and non‐irradiated (RT−) control mice 12 months after irradiation. Original magnification ×400. Scale bar = 20 μm. n = 5 for RT+ and RT− mice.
p16 mRNA expression in whole kidney from irradiated (RT+) and non‐irradiated (RT−) control mice 12 months after irradiation. n = 5 for RT+ and RT− mice.
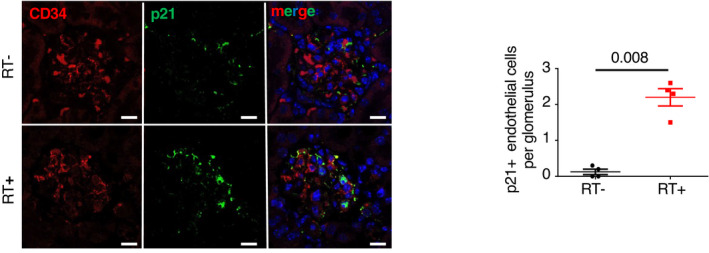
p21/griffonia simplicifolia/nephrin coimmunostaining (left panels) and quantification of endothelial p21‐positive cells (right panel) in glomeruli of kidneys from irradiated (RT+) and non‐irradiated (RT−) control mice 12 months after irradiation. Original magnification ×630. Scale bar = 10 μm. n = 4 for RT+ and RT− mice.
53BP1/CD34 coimmunostaining (left panels) and quantification of glomerular endothelial cell 53BP1 foci (right panel) in kidneys from irradiated (RT+) and non‐irradiated (RT−) control mice 12 months after irradiation. Original magnification ×630. Scale bar = 10 μm. n = 4 for RT+ and RT− mice. Arrows show 53BP1 foci.
Relative mRNA expression of PAI‐1 in whole kidneys from irradiated (RT+) and non‐irradiated (RT−) control mice 12 months after irradiation. n = 5 for RT+ and RT− mice.
PAI‐1 immunohistochemistry (left panels) and quantification of PAI‐1‐positive glomeruli (right panel) in kidneys from irradiated (RT+) and non‐irradiated (RT−) control mice 12 months after irradiation. Original magnification ×400. n = 4 for RT+ and RT− mice.
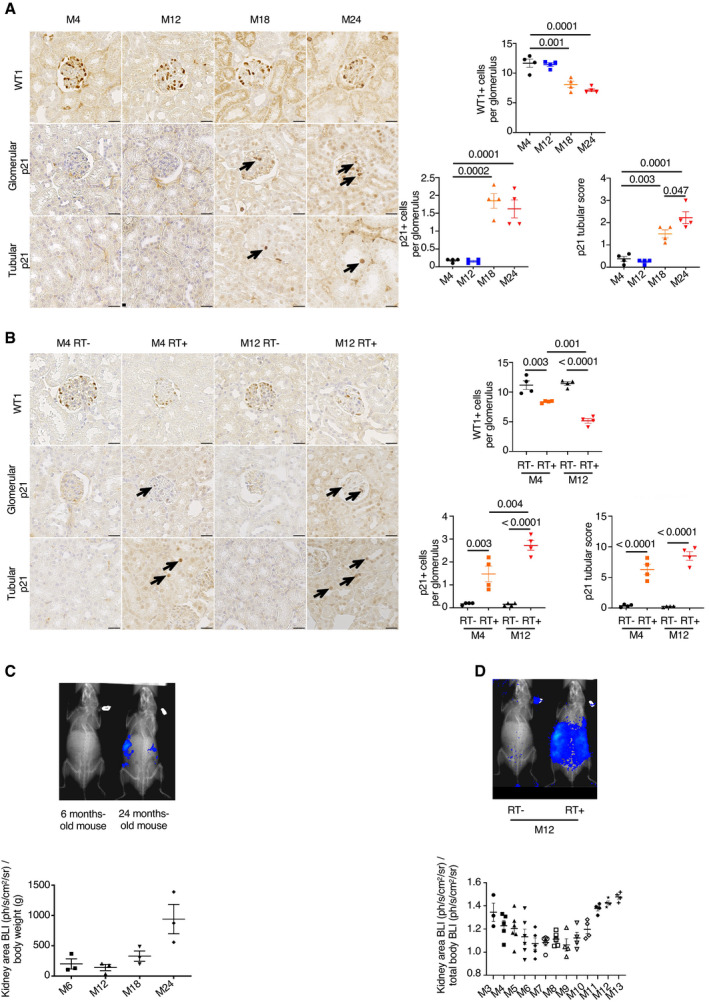
WT1 (left upper panels) and p21 (left middle and lower panels) immunostaining in 4‐, 12‐, 18‐, and 24‐month‐old mice. Quantification of WT1‐positive cells (right upper panels), and glomerular and tubular p21‐positive cells (right lower panels). Original magnification ×400. Scale bar = 20 μm. n = 4 for each group. Arrows show positive p21 nuclei, either in glomeruli or in tubules.
WT1 (left upper panels) and p21 (left middle and lower panels) immunostaining in 4‐ and 12‐month‐old irradiated (RT+) and non‐irradiated (RT−) mice. Quantification of WT1‐positive cells (right upper panels), and glomerular and tubular p21‐positive cells (right lower panels). Original magnification ×400. Scale bar = 20 μm. n = 4 for each group. Arrows show positive p21 nuclei, either in glomeruli or in tubules.
Bioluminescence (BLI, upper panel) and quantification (lower panel) kidney BLI area in young or old mice (upper panel). n = 3 mice.
Bioluminescence (BLI, upper panel) and quantification (lower panel) kidney BLI area in irradiated (RT+) and non‐irradiated (RT−) mice over time. n = 3–6 mice according to the different time points.
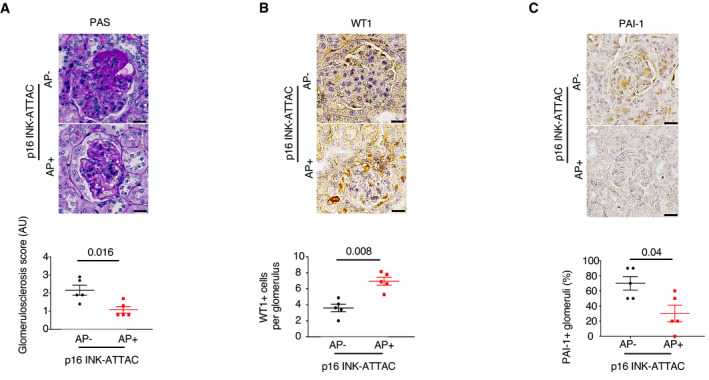
Morphology (PAS staining, upper panels) and quantification of glomerular lesions (lower panel) of kidneys from 28‐month‐old p16 INK‐ATTAC mice treated with either vehicle (AP−) or AP20187 (AP+). Original magnification ×400. Scale bar = 20 μm. n = 5.
WT1 immunostaining (upper panels) and quantification of WT1‐positive glomerular cells (lower panel) in 28‐month‐old p16 INK‐ATTAC mice treated with either vehicle (AP−) or AP20187 (AP+). Original magnification ×400. Scale bar = 20 μm. n = 5.
PAI‐1 immunostaining (upper panels) and quantification of PAI‐1‐positive glomeruli (lower panel) in 28‐month‐old p16 INK‐ATTAC mice treated with either vehicle (AP−) or AP20187 (AP+). Original magnification ×400. Scale bar = 20 μm. n = 5.
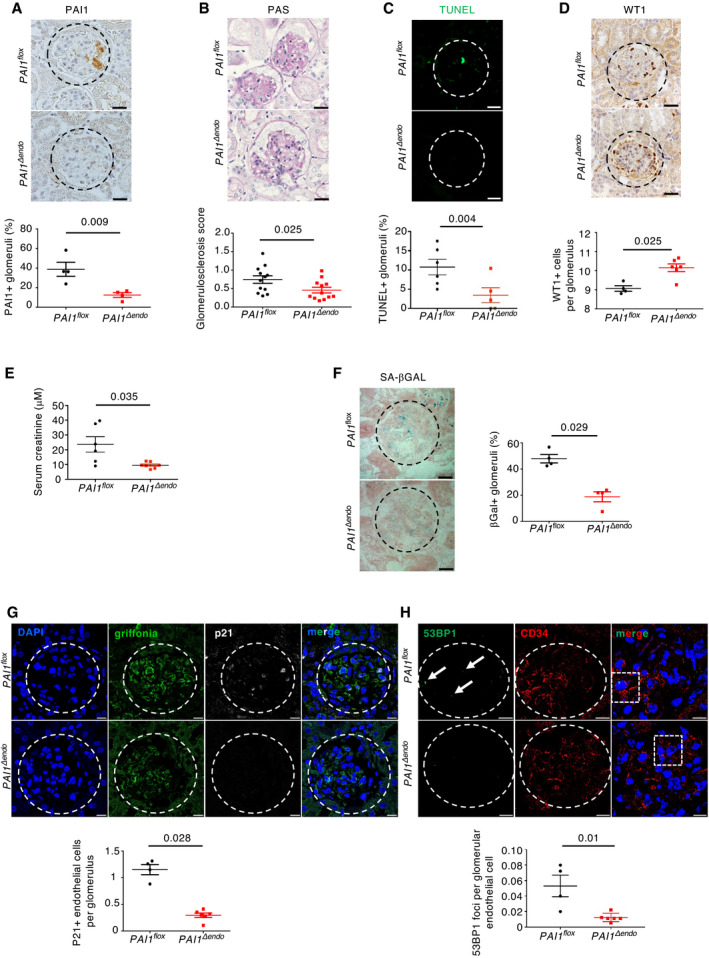
PAI‐1 immunohistochemistry (upper panels) and quantification of PAI‐1‐positive glomeruli (lower panel) in kidneys of PAI‐1flox and PAI‐1Δendo mice at 22 months of age. Original magnification ×400. Scale bar = 20 μm. n = 4 for PAI‐1flox and PAI‐1Δendo mice.
Morphology (PAS staining, upper panels) and quantification of glomerular lesions (lower panel) of kidneys from PAI‐1flox and PAI‐1Δendo mice at 22 months of age. Original magnification ×400. Scale bar = 20 μm. n = 12 for PAI‐1flox and PAI‐1Δendo mice.
TUNEL assay (upper panels) and quantification of TUNEL‐positive glomeruli (lower panel) in kidneys from PAI‐1flox and PAI‐1Δendo mice at 22 months of age. Original magnification ×400. Scale bar = 20 μm. n = 6 for PAI‐1flox and PAI‐1Δendo mice.
WT1 immunostaining (upper panels) and quantification of WT1‐positive glomerular cells (lower panel) in kidneys from PAI‐1flox and PAI‐1Δendo mice at 22 months of age. Original magnification ×400. Scale bar = 20 μm. n = 4 and n = 6 for PAI‐1flox and PAI‐1Δendo mice, respectively.
Serum creatinine measurement in PAI‐1flox (n = 6) and PAI‐1Δendo (n = 7) mice at 22 months of age.
Senescence‐associated β‐galactosidase staining (upper panels) and quantification of β‐galactosidase‐positive glomeruli (lower panel) in kidneys from PAI‐1flox and PAI‐1Δendo mice at 22 months of age. Original magnification ×400. Scale bar = 20 μm. n = 4 for PAI‐1flox and PAI‐1Δendo mice.
p21/griffonia simplicifolia/nephrin coimmunostaining in kidneys (upper panels) from PAI‐1flox and PAI‐1Δendo mice at 22 months of age and quantification (lower panel) of p21‐positive endothelial cells per glomeruli. Original magnification ×630. Scale bar = 10 μm. n = 4 and n = 6 for PAI‐1flox and PAI‐1Δendo mice, respectively.
53BP1/CD34 coimmunostaining (upper panels) and quantification of glomerular 53BP1 foci in glomerular endothelial cells from PAI‐1flox and PAI‐1Δendo mice at 22 months of age. Original magnification ×630. Scale bar = 10 μm. n = 4 and n = 6 for PAI‐1flox and PAI‐1Δendo mice, respectively. Arrows show 53BP1‐positive foci.
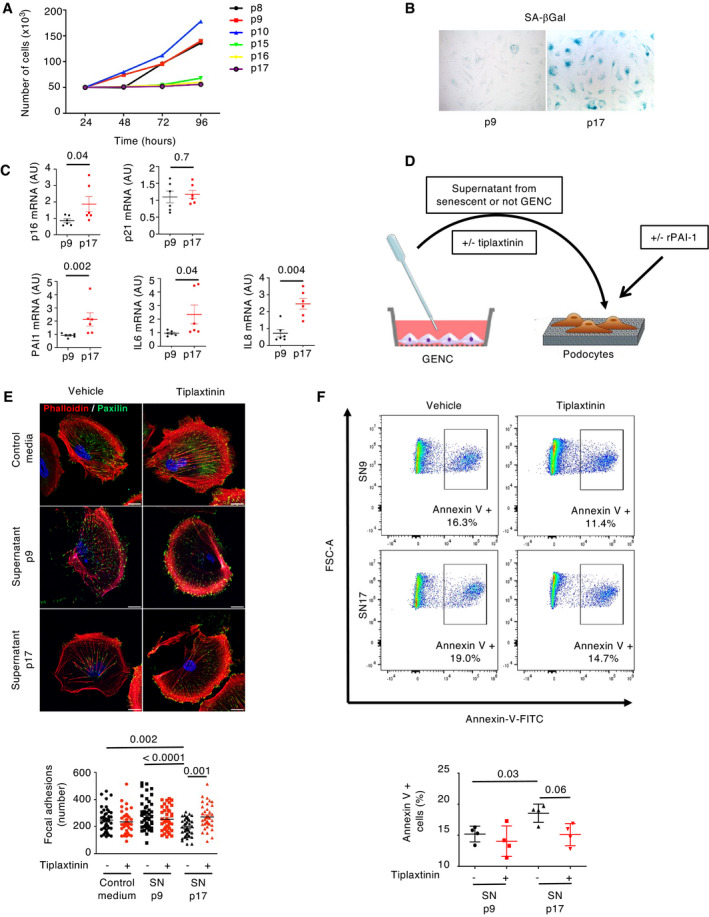
- A
Time of cell population doubling of primary glomerular endothelial cells from passage 8 (p8) to passage 17 (p17).
- B
Senescence‐associated β‐galactosidase staining of glomerular endothelial cells (GEnC) at early (p9) or late (p17) passage.
- C
Relative mRNA expression of senescence markers (p16 and p21) and SASP molecules (PAI‐1, IL‐6, IL‐8) in GEnC at early (p9) or late (p17) passage. n = 5 independent experiments.
- D
Scheme of the experimental protocol used for coculture experiments with glomerular endothelial cells (GEnC) and podocytes.
- E
Immunofluorescence of paxillin (green) and phalloidin (red) in podocytes stimulated with control medium, supernatant (SN) from glomerular endothelial cells from early (p9) or late (p17) passage and treated either with vehicle or with tiplaxtinin, a PAI‐1 inhibitor (upper panel). Quantification of focal adhesions (lower panel) was performed by counting the number of paxillin‐positive spots in 30 cells from three independent experiments. Original magnification ×1,000. Scale bar = 20 μm.
- F
Annexin‐V‐FITC staining (upper panel) and quantification by FACS (lower panel) of podocytes stimulated with supernatant (SN) from GEnC at early (p9) or late (p17) passage and treated either with vehicle or with tiplaxtinin. n = 4 independent experiments.
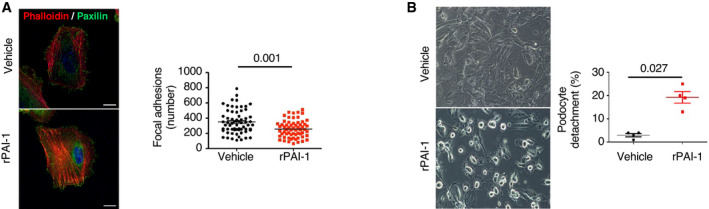
Immunofluorescence of paxillin (green) and phalloidin (red) on podocytes stimulated for 30 min with recombinant PAI‐1 at 5 nM. Quantification of focal adhesions (right panel) was performed by counting the number of paxillin‐positive spots in 30 cells from three independent experiments. Original magnification ×1,000. Scale bar = 20 μm.
Podocyte morphology (left panels) and quantification of podocyte detachment (right panel) 30 min after stimulation by recombinant PAI‐1 at 5 nM. Original magnification ×400, n = 4 independent experiments.

PAI‐1 staining (left panel) and quantification (right panel) in glomeruli of kidney biopsies from young (< 40 years of age, n = 8) or old (> 80 years of age, n = 10) kidney donors at time of transplantation (M0). Original magnification ×400. Scale bar = 20 μm.
p16 staining (left panel) and quantification (right panel) in glomeruli of kidney biopsies from young (< 40 years of age, n = 8) or old (> 80 years of age, n = 10) kidney donors at time of transplantation (M0). The arrows point to the staining. Original magnification ×400. Scale bar = 20 μm.
PAI‐1/CD34 coimmunostaining in old‐positive or old‐negative glomerular PAI‐1 donors. Original magnification ×630. Scale bar = 10 μm.
p16/CD34 coimmunostaining in old‐positive glomerular PAI‐1 donors. Original magnification ×630. Scale bar = 10 μm.
Representation of PAI‐1 and p16 staining results at time of transplantation in young (n = 8) or old donors (n = 10). Each line represents one patient. Green color is used for negative staining, and red color, for positive staining.
Quantification of the glomerulosclerosis score at time of (M0), or 12 months after (M12), kidney transplantation from elderly donors in patients displaying a negative (PAI‐1−, n = 17) or positive (PAI‐1+, n = 13) glomerular PAI‐1 staining at time of transplantation (M0).
Estimated glomerular filtration rate (eGFR) at time of (M0), or 12 months after (M12), kidney transplantation in patients displaying a negative (PAI‐1−, n = 17) or positive (PAI‐1+, n = 18) glomerular PAI‐1 staining at time of transplantation (M0).
Urinary PAI‐1 measured by ELISA in a cohort of elderly patients with (n = 48) or without (n = 48) chronic kidney disease.
References
-
- Alva JA, Zovein AC, Monvoisin A, Murphy T, Salazar A, Harvey NL, Carmeliet P, Iruela‐Arispe ML (2006) VE‐Cadherin‐Cre‐recombinase transgenic mouse: a tool for lineage analysis and gene deletion in endothelial cells. Dev Dyn 235: 759–767 - PubMed
Publication types
MeSH terms
Substances
LinkOut - more resources
Full Text Sources
Medical
Molecular Biology Databases
Miscellaneous
