. 2021 Nov 17;12(22):4286-4301.
doi: 10.1021/acschemneuro.1c00436. Epub 2021 Nov 2.

Luminescent PLGA Nanoparticles for Delivery of Darunavir to the Brain and Inhibition of Matrix Metalloproteinase-9, a Relevant Therapeutic Target of HIV-Associated Neurological Disorders

Affiliations

Luminescent PLGA Nanoparticles for Delivery of Darunavir to the Brain and Inhibition of Matrix Metalloproteinase-9, a Relevant Therapeutic Target of HIV-Associated Neurological Disorders

Tiziana Latronico et al. ACS Chem Neurosci. .

Abstract

Human immunodeficiency virus (HIV) can independently replicate in the central nervous system (CNS) causing neurocognitive impairment even in subjects with suppressed plasma viral load. The antiretroviral drug darunavir (DRV) has been approved for therapy of HIV-infected patients, but its efficacy in the treatment of HIV-associated neurological disorders (HAND) is limited due to the low penetration through the blood-brain barrier (BBB). Therefore, innovations in DRV formulations, based on its encapsulation in optically traceable nanoparticles (NPs), may improve its transport through the BBB, providing, at the same time, optical monitoring of drug delivery within the CNS. The aim of this study was to synthesize biodegradable polymeric NPs loaded with DRV and luminescent, nontoxic carbon dots (C-Dots) and investigate their ability to permeate through an artificial BBB and to inhibit in vitro matrix metalloproteinase-9 (MMP-9) that represents a factor responsible for the development of HIV-related neurological disorders. Biodegradable poly(lactic-co-glycolic) acid (PLGA)-based nanoformulations resulted characterized by an average hydrodynamic size less than 150 nm, relevant colloidal stability in aqueous medium, satisfactory drug encapsulation efficiency, and retained emitting optical properties in the visible region of the electromagnetic spectrum. The assay on the BBB artificial model showed that a larger amount of DRV was able to cross BBB when incorporated in the PLGA NPs and to exert an enhanced inhibition of matrix metalloproteinase-9 (MMP-9) expression levels with respect to free DRV. The overall results reveal the great potential of this class of nanovectors of DRV for an efficacious treatment of HANDs.

Keywords: HANDs; MMP-9; PLGA nanoparticles; blood−brain barrier; carbon dots; darunavir.


Conflict of interest statement

The authors declare no competing financial interest.

Figures

Figure 1
Figure 1
Sketch of the PLGA-based nanoformulation loaded with C-Dots and DRV potentially useful for the treatment of HIV-associated neurocognitive disorders.
Figure 2
Figure 2
Optical and morphological characterization of “as-synthesized” C-Dots. PL spectra of “as-synthesized” C-Dots dispersed in organic solvent (chloroform) and recorded at the following excitation wavelengths: 320 nm (black line), 360 nm (red line), 380 (blue line), 400 nm (royal line), 420 nm (magenta line), 440 nm (green line), 460 nm (olive line), 480 nm (orange line), and 500 nm (pink line) (A). Image under UV irradiation (λ > 285 nm) of the C-Dots dispersion in chloroform (inset A, left), UV–vis absorption spectrum (inset A, right) and TEM micrograph obtained with staining (B) of “as-synthesized” C-Dots dispersed in organic solvent (chloroform).
Figure 3
Figure 3
(A) Characterization of DRV-loaded luminescent PLGA NPs: DRV encapsulation efficiency (EE%), DRV loading (DL%), size, and morphology. EE% and DL% of four different DRV/C-Dot/PLGA NP samples, obtained starting from different initial amounts of DRV. (B) Representative size distribution by intensity and TEM micrographs, obtained (C) without and (C1, D) with staining for two increasing staining times, namely, (D) 30 and (C1) 60 s of the DRV/C-Dot/PLGA NPs sample prepared starting from 10 mg of DRV (B, C) and at a fixed C-Dots concentration of 2.5 mg/mL, and (E) DRV/C-Dot/PLGA NPs schematic sketch.
Figure 4
Figure 4
Optical characterization and in vitro drug release profile of luminescent PLGA NPs loaded with DRV. (A) PL spectra recorded of DRV/C-Dot/PLGA NPs, dispersed in water, at the following excitation wavelengths: 320 nm (black line), 360 nm (red line), 380 (blue line), 400 nm (royal line), 420 nm (magenta line), 440 nm (green line), 460 nm (olive line), 480 nm (orange line), and 500 nm (pink line). (B) Time-resolved PL decay curves (λExc 375 nm, λEm 480 nm) of C-Dots dispersed in chloroform solution (blue line) and after their encapsulation in PLGA nanoformulation in water (red line). (C) Percentage cumulative DRV release versus time of DRV/C-Dot/PLGA NPs. All of the samples were prepared starting from 10 mg of DRV at a fixed 2.5 mg/mL C-Dots concentration.
Figure 5
Figure 5
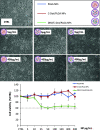
Effect of empty PLGA NPs, C-Dot-only-containing NPs, and C-Dot- and DRV-containing NPs on astrocyte cell viability. In the top panel, representative images show the morphology of astrocytes observed by phase contrast microscopy (50× magnification) after 24 h treatment with empty PLGA NPs or NPs containing C-Dots only (C-Dot/PLGA NPs) or C-Dots and DRV (DRV/C-Dot/PLGA NPs) at the indicated concentrations. In the bottom panel, the graph reports the cell viability, assessed by the 3-(4,5-dimethylthiazol-2-yl)-2.5-diphenyltetrazolium bromide (MTT) test, expressed as a percentage of surviving cells to untreated astrocytes in serum-free Dulbecco’s modified Eagle’s medium (DMEM) as control (CTRL, 100%). The doses of the preparations of NPs resulting in a cell survival below 60% were considered toxic. Data represent mean ± SD of n = 3 experiments on different cell populations.
Figure 6
Figure 6
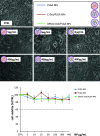
Effect of empty PLGA NPs, C-Dot-containing NPs, and C-Dot- and DRV-containing NPs. In the top panel, the representative images show the morphology of the bEnd3 observed by phase contrast microscopy (50× magnification) after 24 h treatment with empty PLGA NPs, for C-Dot-only-containing NPs (C-Dot/PLGA NPs), and C-Dot- and DRV-containing NPs (DRV/C-Dot/PLGA NPs) at the indicated concentrations. In the bottom panel, the graph reports cell viability, assessed by the MTT test, expressed as a percentage of surviving cells compared to untreated astrocytes in serum-free DMEM as control (CTRL, 100%). The doses of the preparations of NPs resulting in a cell survival below 60% were considered toxic. Data represent mean ± SD of n = 3 experiments on different cell populations.
Figure 7
Figure 7
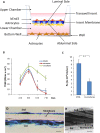
Setup and validation of the in vitro BBB model. (A) Sketch of the in vitro BBB model. (B) Graphs representing mean ± SD of the transendothelial resistance (TEER) daily detected, starting from day 4 of co-culture. The data were obtained from the measurements made on three different inserts of bEnd3 monocultures, astrocyte monocultures, and bEnd3/astrocyte co-culture of n = 3 different experiments; * represents values statically different from that recorded on day 5 (one-way analysis of variance (ANOVA) followed by Dunnett’s multiple comparison post hoc test; * = p < 0.005). (C) Histogram shows the average values of the apparent permeability coefficient (PA) of fluorescein isothiocyanate–dextran (FITC–D), in inserts containing bEnd3/astrocyte co-culture and CTRL inserts, calculated as the ratio between the amount of dextran passed in the lower chambers and that remaining in the upper chambers of the transwells; ** represents values statistically different from CTRL (Student’s t-test; ** = p < 0.001). (D) and (E) representative light microscopic images of toluidine blue-stained transversal semithin section (0.25–0.5 μm) and electron microscopic microphotographs of uranyl acetate transversal ultrathin section (70–80 nm), respectively, of co-culture insert membrane. Arrows indicate the membrane insert, Ast = astrocytes, End = bEnd3, scale bar: 5 μm.
Figure 8
Figure 8
Evaluation of DRV to cross the in vitro BBB model. (A) Sketch of the in vitro experiments performed to investigate the crossing of DRV, free or incorporated in PLGA NPs, through the artificial BBB. (B) Histograms representing the amounts of DRV, free (DRV) and incorporated in the NPs (DRV/C-Dots/PLGA NPs), permeated through the BBB model, calculated as a percentage of the drug content in the lower chamber with respect to its initial amount in the upper chamber. Values are mean ± SD of n = 3 different experiments (Student’s t-test; ** = p < 0.001).
Figure 9
Figure 9
Effect of DRV, free or encapsulated in PLGA NPs, on MMP-9 release from LPS-activated astrocytes. (A) Representative zymographic gel of the analysis of cell culture supernatants from astrocytes activated with LPS (10 μg/mL) and simultaneously treated for 24 h with DRV/C-Dot/PLGA NPs or free DRV (DRV) at the indicated concentrations. Positive and negative controls were represented from LPS-stimulated astrocytes and unstimulated and untreated astrocytes in serum-free DMEM (CTRL), respectively. (B) Histogram representing MMP-9 levels expressed as % in comparison with LPS, calculated after scanning densitometry and computerized analysis of gels. The values represent mean ± SD of n = 3 experiments performed on different cell populations; * indicates values statistically significant different in comparison with LPS (one-way ANOVA followed by Dunnet’s post hoc test; *p < 0.05).
Figure 10
Figure 10
Effect of DRV, to inhibit MMP-9 in LPS-activated astrocytes after crossing of the artificial BBB. (A) Sketch of astrocytes, plated on the bottom of the transwell containing the insert with artificial BBB. LPS (10 μg/mL) was used to activate astrocytes, seeded at the bottom of the transwell. The inserts containing the artificial BBB were treated with 150 μg/mL DRV/C-Dot/PLGA NPs (containing 15 μM DRV) or 15 μM free DRV in the presence of LPS as described in the Section 4. Nonactivated and untreated cells (CTRL) and LPS-activated cells (10 μg/mL) were used as negative and positive controls, respectively. (B) Representative zymographic analysis performed on supernatants after their collection from the lower chamber after 24 h of incubation at 37 °C, 5% CO2 from astrocytes. (C) Histograms showing MMP-9 levels expressed as % in comparison with LPS: scanning densitometry and computerized analysis of gels were carried out for their calculation. The values of MMP-9 levels are reported as mean + SD (n = 3 replicates of different experiments). Values characterized by statistically significant difference in comparison with LPS (one-way ANOVA followed by Dunnet’s post hoc test) were indicated by the symbols * (p < 0.05) and ** (p < 0.001).

Similar articles

Cited by

References

    1. Antinori A.; Arendt G.; Becker J. T.; Brew B. J.; Byrd D. A.; Cherner M.; Clifford D. B.; Cinque P.; Epstein L. G.; Goodkin K.; Gisslen M.; Grant I.; Heaton R. K.; Joseph J.; Marder K.; Marra C. M.; McArthur J. C.; Nunn M.; Price R. W.; Pulliam L.; Robertson K. R.; Sacktor N.; Valcour V.; Wojna V. E. Updated research nosology for HIV-associated neurocognitive disorders. Neurology 2007, 69, 1789–1799. 10.1212/01.WNL.0000287431.88658.8b. - DOI - PMC - PubMed
    1. Hong S.; Banks W. A. Role of the immune system in HIV-associated neuroinflammation and neurocognitive implications. Brain, Behav., Immun. 2015, 45, 1–12. 10.1016/j.bbi.2014.10.008. - DOI - PMC - PubMed
    1. King J. M. J. B.; Gannon P. J.; Akaj C.. Persistence of HIV-Associated Neurocognitive Disorders in the Era of Antiretroviral Therapy. In Therapy, Current Perspectives in HIV Infection; Saxena S. K., Eds.; IntechOpen, 2013.
    1. Borrajo A.; Spuch C.; Penedo M. A.; Olivares J. M.; Agís-Balboa R. C. Important role of microglia in HIV-1 associated neurocognitive disorders and the molecular pathways implicated in its pathogenesis. Ann. Med. 2021, 53, 43–69. 10.1080/07853890.2020.1814962. - DOI - PMC - PubMed
    1. Kramer-Hämmerle S.; Rothenaigner I.; Wolff H.; Bell J. E.; Brack-Werner R. Cells of the central nervous system as targets and reservoirs of the human immunodeficiency virus. Virus Res. 2005, 111, 194–213. 10.1016/j.virusres.2005.04.009. - DOI - PubMed