. 2022 Jan 20;34(1):374-394.
doi: 10.1093/plcell/koab261.

Membrane nanodomains modulate formin condensation for actin remodeling in Arabidopsis innate immune responses

Affiliations

Membrane nanodomains modulate formin condensation for actin remodeling in Arabidopsis innate immune responses

Zhiming Ma et al. Plant Cell. .

Abstract

The assembly of macromolecules on the plasma membrane concentrates cell surface biomolecules into nanometer- to micrometer-scale clusters (nano- or microdomains) that help the cell initiate or respond to signals. In plant-microbe interactions, the actin cytoskeleton undergoes rapid remodeling during pathogen-associated molecular pattern-triggered immunity (PTI). The nanoclustering of formin-actin nucleator proteins at the cell surface has been identified as underlying actin nucleation during plant innate immune responses. Here, we show that the condensation of nanodomain constituents and the self-assembly of remorin proteins enables this mechanism of controlling formin condensation and activity during innate immunity in Arabidopsis thaliana. Through intrinsically disordered region-mediated remorin oligomerization and formin interaction, remorin gradually recruits and condenses formins upon PTI activation in lipid bilayers, consequently increasing actin nucleation in a time-dependent manner postinfection. Such nanodomain- and remorin-mediated regulation of plant surface biomolecules is expected to be a general feature of plant innate immune responses that creates spatially separated biochemical compartments and fine tunes membrane physicochemical properties for transduction of immune signals in the host.


Figures

Figure 1
Figure 1
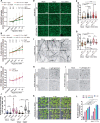
Remorin mediates formin clustering and actin polymerization for Arabidopsis PTI responses. A and B, Quantification of the total fluorescence intensity of AtFH6-GFP punctate foci (A) and Lifeact-Venus-labeled F-actin occupancy (B) on the cotyledon epidermal cell surface of 5-day WT and rem1.2 1.3c seedlings inoculated with 10-µM flg22 or 1 × 107 CFU·mL−1  Xcc 8004 at the indicated time point before and postinoculation. The particle intensities of AtFH6-GFP or F-actin occupancy were normalized to the mean values of the seedlings before Xcc 8004 or flg22 elicitation as ratios. Statistical analysis of AtFH6-GFP intensity or F-actin occupancy in the WT and rem1.2 1.3c seedlings at each time point is shown on top of the related chart. n=200 particles in (A), n > 25 cells in (B). C, Quantification of the total fluorescence intensity of YFP-AtREM1.2 in 5-day seedlings inoculated as in (A) (see also Supplemental Figure S1, A and B). Normalized data were plotted as in (A). n = 200 as in (A). D, Representative images of AtFH6-GFP in the WT or rem1.2 1.3c and YFP-AtREM1.2 at 3 hpi after flg22 or Xcc 8004 treatment. E, Total intensity quantification of the AtFH6-GFP particles in (D), n = 200 particles. F, VA-TIRFM recording of Lifeact-Venus in the cotyledon epidermal cells of 5-day WT and rem1.2 1.3c seedlings elicited with flg22 or Xcc 8004 at 3 hpi, (G) Quantification of F-actin occupancy in (F), n > 25 cells. H–J, Callose deposition (H and I) and quantification (J) at the cotyledon surface in 2-week-old WT and rem1.2 1.3c seedlings treated with different combinations of 250-nM LatB (H) and 1-µM flg22 for 24 h before aniline blue-staining and imaging. ROIs (50 µm × 50 µm) were used for total intensity quantification. N > 30 ROIs. K, Disease symptoms of 2-week-old WT or rem1.2 1.3c seedlings with flood-inoculation with 1 × 107 CFU·mL−1  Xcc 8004 for 1 min. Representative images at 0 days postinoculation (0 dpi), 3 dpi, and 4 dpi are shown. L, Quantification of the internal Xcc 8004 bacterial population in the seedlings of (K) at the indicated time points. N = 3 individual seedlings. Significant differences were determined via one-way analysis of variance (ANOVA) with multiple comparisons (****P ≤ 0.0001, ***P ≤ 0.001, **P ≤ 0.01, *P ≤ 0.05, ns = not significant). Error bars = sd in (A), (B), (C), and (L). Scale bar: 2 µm in (D) and (F), 100 µm in (H) and (I), 0.5 cm in (K).
Figure 2
Figure 2
Remorin recruits formin for clustering and promotes formin actin nucleation activity. A, mScarlet-AtREM1.2 (magenta) and AtFH6-GFP foci (green) on the cotyledon epidermal cell surface in 5 d AtFH6-GFP/ProREM1.2:mScarlet-AtREM1.2/rem1.2 seedlings, with or without 3 h of flg22 treatment with 10 µM (upper two parts). The lower three parts are the seedlings that were treated by 10-µM flg22 together with 10-mM MβCD, 50-µM SMIFH2, or 5-µM LatB for 3 h before imaging. B, Pearson correlation coefficient analysis of AtFH6-GFP and mScarlet-AtREM1.2 foci in the seedlings as in (A). n > 30 ROIs (20 µm × 20 µm in size). C, Representative VA-TIRFM images of Lifeact-Venus-labeled F-actin in cotyledon epidermal cells of 5 d Lifeact-Venus/XVE:mRuby2-AtREM1.2 seedlings with or without 24 h ES treatment at 5 µM. D, Quantification of F-actin occupancy from (C). n >40 cells. Error bars = sd. E, CLSM recording of F-actin regeneration in Lifeact-Venus/XVE:mRuby2-AtREM1.2 seedlings. Five-day-old seedlings were inoculated, with or without 5-µM ES for 24 h, before an additional 40 min of LatB treatment at 5 µM to completely disrupt F-actin. Regenerated actin seeds were imaged 30 min after LatB washout. F, Quantification of actin seed numbers at 30 min after LatB washout from (E). n = 30 cells. Significant differences were determined via Student’s t test assuming equal variances in (D) and (F), or one-way ANOVA with multiple comparisons in (B) (****P ≤ 0.0001, ***P ≤ 0.0001, **P ≤ 0.01, ns = not significant). Scale bar: 2 µm in (A) and (C), 5 µm in (E).
Figure 3
Figure 3
AtREM1.2 interacts with type-I formin and promotes formin-mediated actin nucleation in vitro. A, Coomassie blue-stained SDS–PAGE of recombinant AtFH1-FH1COOH (430–1,051 aa) (FH1C) and AtREM1.2 FL (REM) proteins. B, Fluorescence anisotropy assay of FH1C and REM interaction by mixing serial concentrations of REMs with a fixed concentration of 90-nM FH1C (labeled by Alexa Fluor 647 dye) for 20 min before measurement. The data were plotted with the Hill slope equation. n=3 biological replicates. Error bars = sd. C, TIRFM recording of single-molecule images of FH1C mixed with titrated REM on SLBs. FH1C (30 nM, 10% Alexa 647-FH1C) was premixed with REM in protein buffer (20-mM HEPES, pH 7.4, 150-mM NaCl) at 1:0, 1:1, 1:4, and 1:8 stoichiometric ratios and further applied to SLBs for 2 min before imaging. D, Quantification of the single-particle total intensity of FH1C in (C). n = 200 particles. E, Representative TIRFM images of FH1C (10% Alexa 647-FH1C) and REM (10% Alexa 488-REM) on SLBs with a stoichiometric ratio of 1:4, as in (C). F, Relative actin polymerization rate in the pyrene-actin polymerization assay in the presence of 400-nM REM, 50-nM FH1C, or 50-nM FH1 plus REM at stoichiometric ratios 1:1, 1:4, and 1:8 (see also Supplemental Figure S5I). The data were normalized according to the spontaneous actin polymerization rate. N = 6 biological replicates. Error bars = sd. G, Representative images from the TIRFM actin polymerization assay in the presence of 240-nM REM alone or 30-nM FH1C with serial concentrations of REM at 1:1, 1:4, and 1:8 stoichiometric molar ratios, and 0.5-µM actin (10% Oregon green 488-actin and 0.5% biotin–actin). H, Quantification of the actin seed number at the 1 min time point in (G). n = 10 ROIs (20 μm × 20 μm in size). Significant differences were determined using one-way ANOVA with multiple comparisons in (D) and (H), or Student’s t test assuming equal variances in (F) (****P ≤ 0.0001, ***P ≤ 0.001, *P ≤ 0.05, ns = not significant). Scale bar: 5 µm in (C) and (E), 2 µm in (G).
Figure 4
Figure 4
AtREM1.2 mediated type I formin clustering is dependent on high-order AtREM1.2 self-assembly. A, Domain schematics of AtREM1.2 (REM) FL and truncation variants. Predicted IDR, CC and C-ter were shown in different colors. B, Coomassie blue-stained SDS–PAGE of purified recombinant REM-ΔIDR and ΔCC truncated constructs and IDR and CC domains. C, Fluorescence anisotropy measurement of a fixed concentration of 90-nM FH1C (Alexa Fluor 647-labeled) mixed with serial concentrations of REM-truncating variants in protein buffer (20-mM HEPES, pH 7.4, 150-mM NaCl). The fluorescence anisotropy readouts of FH1C (Alexa 647) were plotted with the Hill slope equation. N = 3 biological replicates. Error bars = sd. D, Size exclusion chromatography profiles of recombinant REM-FL, ΔIDR and ΔCC proteins using a Superdex 200 10/300 GL column with calibration. The gray dashed line indicates the elution peaks of protein standards with the indicated sizes. The estimated size of each protein variant is shown in brackets, assuming a globular shape. E, Comparison of mRuby2-AtREM1.2 FL, ΔIDR, ΔCC, and ΔC-ter signals in vivo. Images were captured by CLSM in the cotyledon epidermal cells of 5 d XVE:mRuby2-AtREM1.2 FL, ΔIDR, ΔCC, and ΔC-ter transgenic seedlings, treated with 5-µM ES for 24 h before imaging. The secant view indicates the plasma membrane localization of mRuby2-AtREM1.2 FL, ΔIDR, and ΔCC, while the surface view reveals that only AtREM1.2 FL forms punctate foci. White arrows indicate cytosolic mRuby2 signal. F, Representative images of AtFH6-GFP foci and Lifeact-Venus-labeled F-actin in the seedlings with or without overexpression of the indicated AtREM1.2 truncating variants. Cotyledon epidermal cells of 5 day AtFH6-GFP/XVE:mRuby2-AtREM1.2 and Lifeact-Venus/XVE:mRuby2-AtREM1.2 seedlings overexpressing different REM variants (FL, ΔIDR, ΔCC, and ΔC-ter) subjected to 5-µM ES treatment for 24 h were imaged by CLSM or VA-TIRFM. G and H, Quantification of the fold changes in AtFH6-GFP particle total intensity (G) and F-actin occupancy (H) triggered by the overexpression of AtREM1.2 as in (F). n = 200 particles in (G) and n >40 cells in (H). Significant differences were determined using one-way ANOVA with multiple comparisons (****P ≤ 0.0001, ***P ≤ 0.001, *P ≤ 0.05). Scale bar: 5 µm in (E), 2 µm in (F).
Figure 5
Figure 5
Proposed working model of remorin-mediated formin nanoclustering and actin assembly. Type I formins are integrated within the CW–PM–AC continuum. Perception of PAMPs triggers local high-order assembly of remorins through IDR-mediated self-oligomerization and, thus, the recruitment and gradual condensation of formins, and resultant actin polymerization in a time-dependent manner.
None

Comment in

References

    1. Abel NB, Buschle CA, Hernandez-Ryes C, Burkart SS, Deroubaix A-F, Mergner J, Gronnier J, Jarsch IK, Folgmann J, Braun KH (2021) A hetero-oligomeric remorin-receptor complex regulates plant development. bioRxiv. DOI: 10.1101/2021.01.28.428596 [Posted on January 29, 2021]
    1. Alberti S, Halfmann R, King O, Kapila A, Lindquist S (2009) A systematic survey identifies prions and illuminates sequence features of prionogenic proteins. Cell 137: 146–158 - PMC - PubMed
    1. Banani SF, Lee HO, Hyman AA, Rosen MK (2017) Biomolecular condensates: organizers of cellular biochemistry. Nat Rev Mol Cell Biol 18: 285–298 - PMC - PubMed
    1. Bariola P, Retelska D, Stasiak A, Kammerer R, Fleming A, Hijri M, Frank S, Farmer E (2004) Remorins form a novel family of coiled coil-forming oligomeric and filamentous proteins associated with apical, vascular and embryonic tissues in plants. Plant Mol Biol 55: 579–594 - PubMed
    1. Brühmann S, Ushakov DS, Winterhoff M, Dickinson RB, Curth U, Faix J (2017) Distinct VASP tetramers synergize in the processive elongation of individual actin filaments from clustered arrays. Proc Natl Acad Sci USA 114: E5815–E5824 - PMC - PubMed

Publication types

MeSH terms

LinkOut - more resources