. 2021 Dec 1;60(49):25958-25965.
doi: 10.1002/anie.202110515. Epub 2021 Nov 2.

Room-Temperature Spin-Dependent Transport in Metalloporphyrin-Based Supramolecular Wires

Affiliations

Room-Temperature Spin-Dependent Transport in Metalloporphyrin-Based Supramolecular Wires

Albert C Aragonès et al. Angew Chem Int Ed Engl. .

Abstract

Here we present room-temperature spin-dependent charge transport measurements in single-molecule junctions made of metalloporphyrin-based supramolecular assemblies. They display large conductance switching for magnetoresistance in a single-molecule junction. The magnetoresistance depends acutely on the probed electron pathway through the supramolecular wire: those involving the metal center showed marked magnetoresistance effects as opposed to those exclusively involving the porphyrin ring which present nearly complete absence of spin-dependent charge transport. The molecular junction magnetoresistance is highly anisotropic, being observable when the magnetization of the ferromagnetic junction electrode is oriented along the main molecular junction axis, and almost suppressed when it is perpendicular. The key ingredients for the above effect to manifest are the electronic structure of the paramagnetic metalloporphyrin, and the spinterface created at the molecule-electrode contact.

Keywords: density functional calculations; magnetoresistance; metalloporphyrins; single-molecule junctions; spinterface.


Conflict of interest statement

The authors declare no conflict of interest.

Figures

Figure 1
Figure 1
Representation of the studied magnetoresistance of the [Cu/Co(DPP)] systems showing a π–π supramolecular single‐molecule junction under both Ni tip electrode magnetizations (labelled in the Figure as α‐Ni and β‐Ni).
Figure 2
Figure 2
A) Representative individual current traces displaying plateau features used to build the 1D histograms in B–E. B–E) Single‐molecule conductance 1D semi‐log histograms for the metal porphyrins (labelled and represented in the Figure) bridging between Au and both α (blue) and β (orange) magnetically polarized Ni tips using PyrMT as anchoring ligand. Electrons are injected from the Au substrate to the Ni tip. All conductance values have been extracted from Gaussian fits of the peaks. Counts have been normalized versus the total amount of traces. All histograms display three peaks named conductance features I, II and III. The applied bias was set to −7.5 mV (see equivalent figures for positive bias in Figure S1.6).
Figure 3
Figure 3
Graphs representing the high conductance feature I (A and B positive and negative bias, respectively) for each [M(DPP)]/PyrMT (indicated in the Figure) under non‐magnetized, α and β magnetized Ni tips, represented in grey, blue and orange, respectively. Error bars denote the standard deviation of the Gaussian fits of the peaks shown in the histograms of Figures 2 and S.1.6.
Figure 4
Figure 4
2D conductance maps were obtained by accumulating hundreds of background‐subtracted blinks set at a common time origin for [Cu(DPP)] under A) non‐polarized, B) α‐Ni tip, C) β‐Ni‐tip and D) perpendicularly magnetized electrodes. The 2D maps color counts were normalized versus the total number of counts. Applied voltage bias and initial setpoint currents were −7.5 mV and 7 nA, respectively.
Figure 5
Figure 5
Graphs (left column in A–C) representing the experimental (black dots) and DFT calculated conductance values (green, red, blue dots) for the three single‐molecule junction conductance signatures I–III (see zoom‐in more detailed graph in Figure S5.1). The values for the high conductance feature I in (A) were calculated using DFT optimized stacking structures illustrated in the right panel for the CoII system case (green dots), using an optimized hexacoordinated model with two axial thiol‐pyridine PyrMT ligands (blue dots) and using a pentacoordinated model with one axial ligand only (red dots).
Figure 6
Figure 6
DFT calculated spin‐resolved projected density of states (PDOS) and transmission spectra (T(E)) for the conductance feature I of the [Co(DPP)]/PyrMT (A) and [Cu(DPP)]/PyrMT (B) systems obtained with the Siesta and Gollum codes using PBE functional. Filled curves in the PDOS graphs denotes transition metal energy levels. Red and blue colors correspond to the alpha and beta spin contributions, respectively.
Figure 7
Figure 7
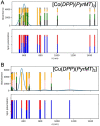
TD‐DFT spectrum (TPSSh functional and def2‐TZVP basis set) for [Co(DPP)]/PyrMT (A) and [Cu(DPP)]/PyrMT (B). The blue curve corresponds to the calculated spectrum. Each transition is represented in the absorbance graph by a vertical line, where colors indicate their transition composition (metal–metal black, metal–ligand green, ligand–metal pink, ligand–ligand orange). Spin polarization of the transition: red spin up, blue spin down. Results for the four‐ and five‐coordinated models are presented in the Supporting Information section S5.

References

    1. Sanvito S., Nat. Phys. 2010, 6, 562–564.
    1. Sanvito S., Chem. Soc. Rev. 2011, 40, 3336–3355. - PubMed
    1. Fusil S., Garcia V., Barthélémy A., Bibes M., Annu. Rev. Mater. Res. 2014, 44, 91–116.
    1. Hirohata A., Takanashi K., J. Phys. D 2014, 47, 193001.
    1. Sinova J., Valenzuela S. O., Wunderlich J., Back C. H., Jungwirth T., Rev. Mod. Phys. 2015, 87, 1213–1260.

LinkOut - more resources