. 2021 Nov 19;16(11):2581-2594.
doi: 10.1021/acschembio.1c00629. Epub 2021 Nov 2.

Proteome-Wide Profiling of Cellular Targets Modified by Dopamine Metabolites Using a Bio-Orthogonally Functionalized Catecholamine

Affiliations

Proteome-Wide Profiling of Cellular Targets Modified by Dopamine Metabolites Using a Bio-Orthogonally Functionalized Catecholamine

Alexander K Hurben et al. ACS Chem Biol. .

Abstract

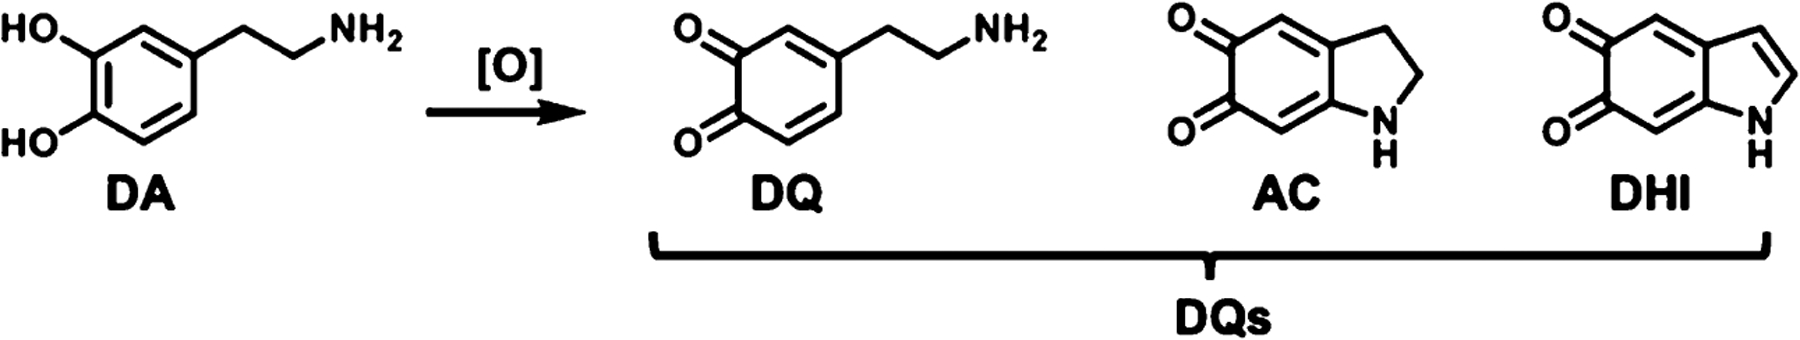
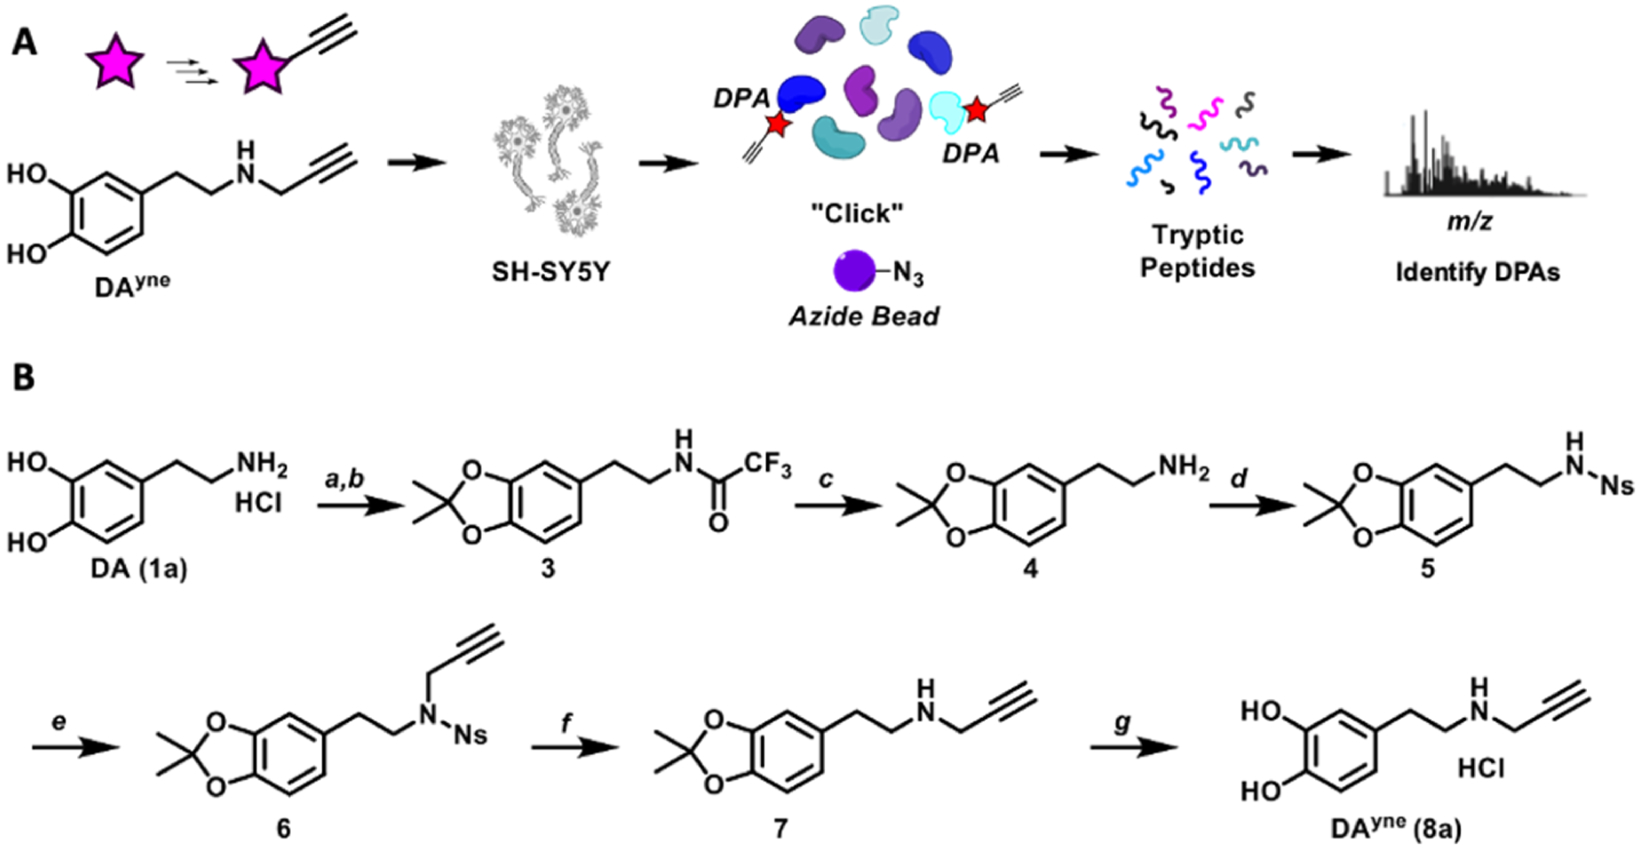
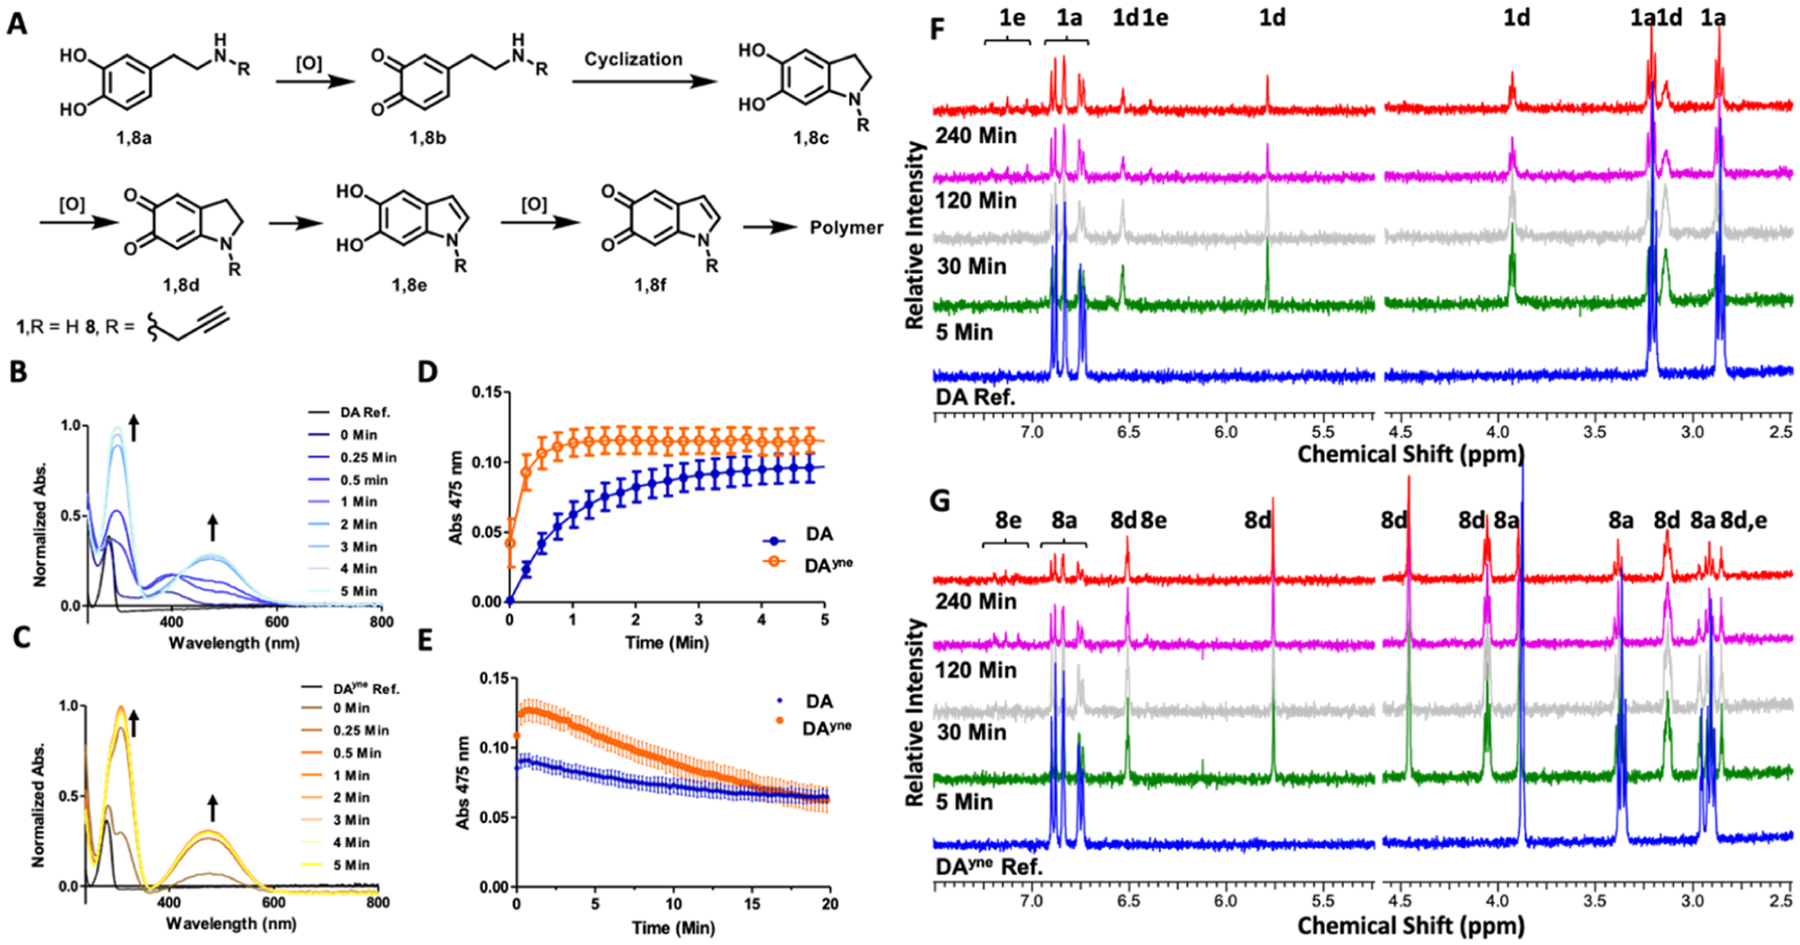
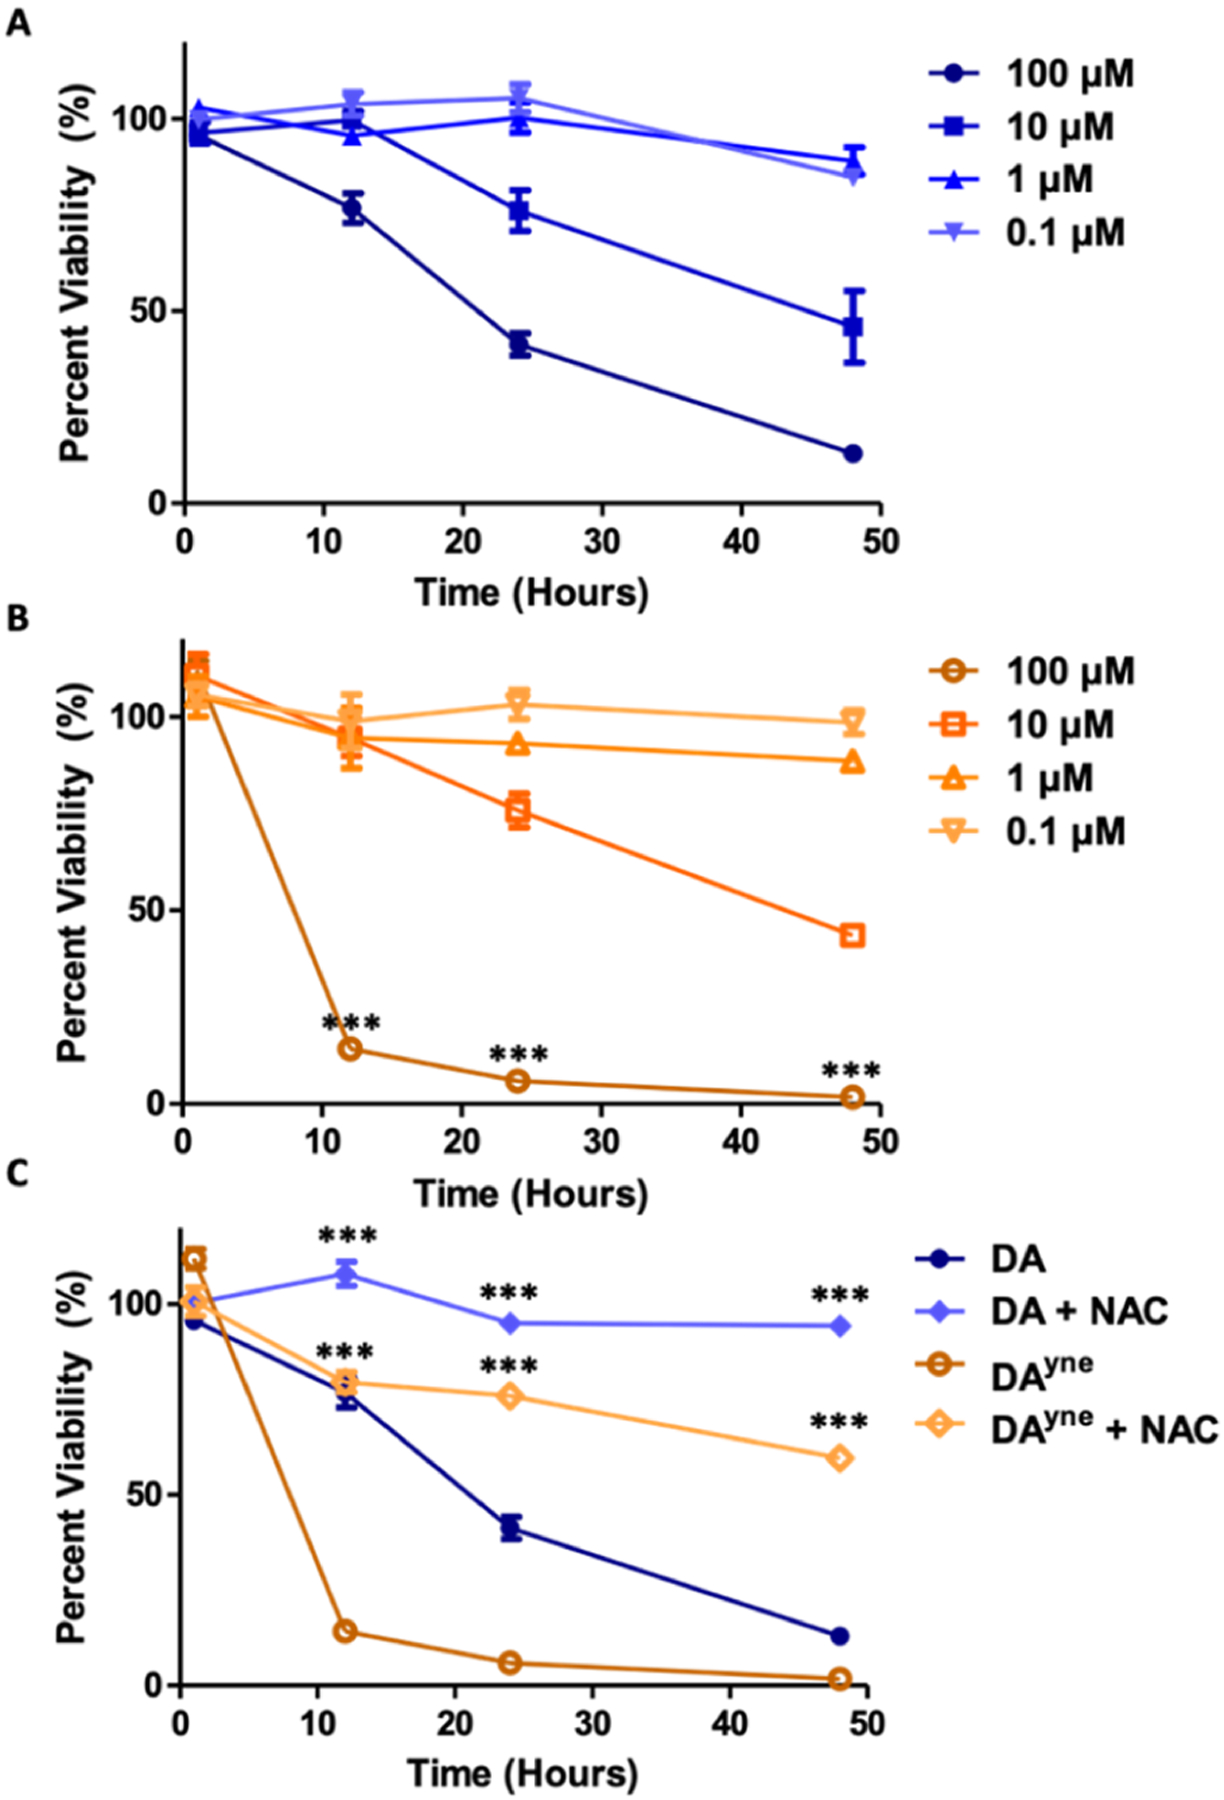
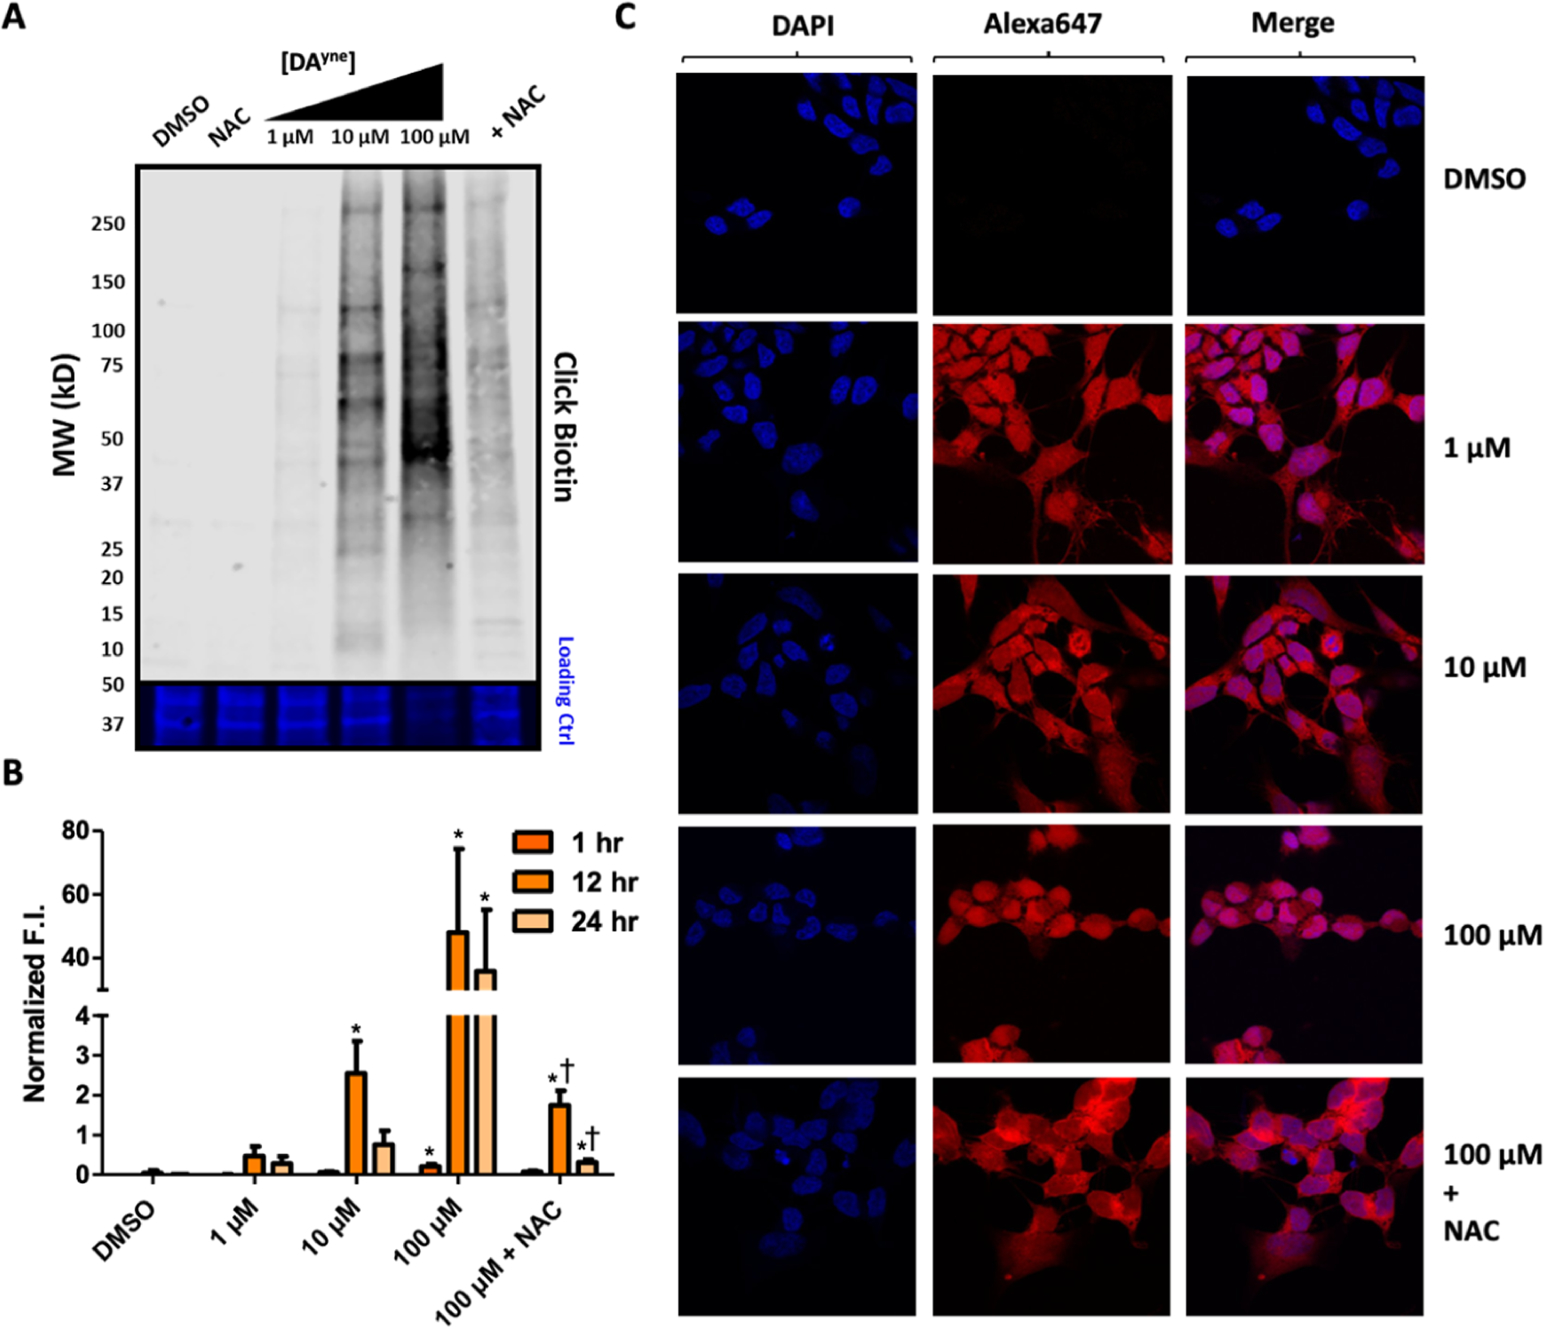
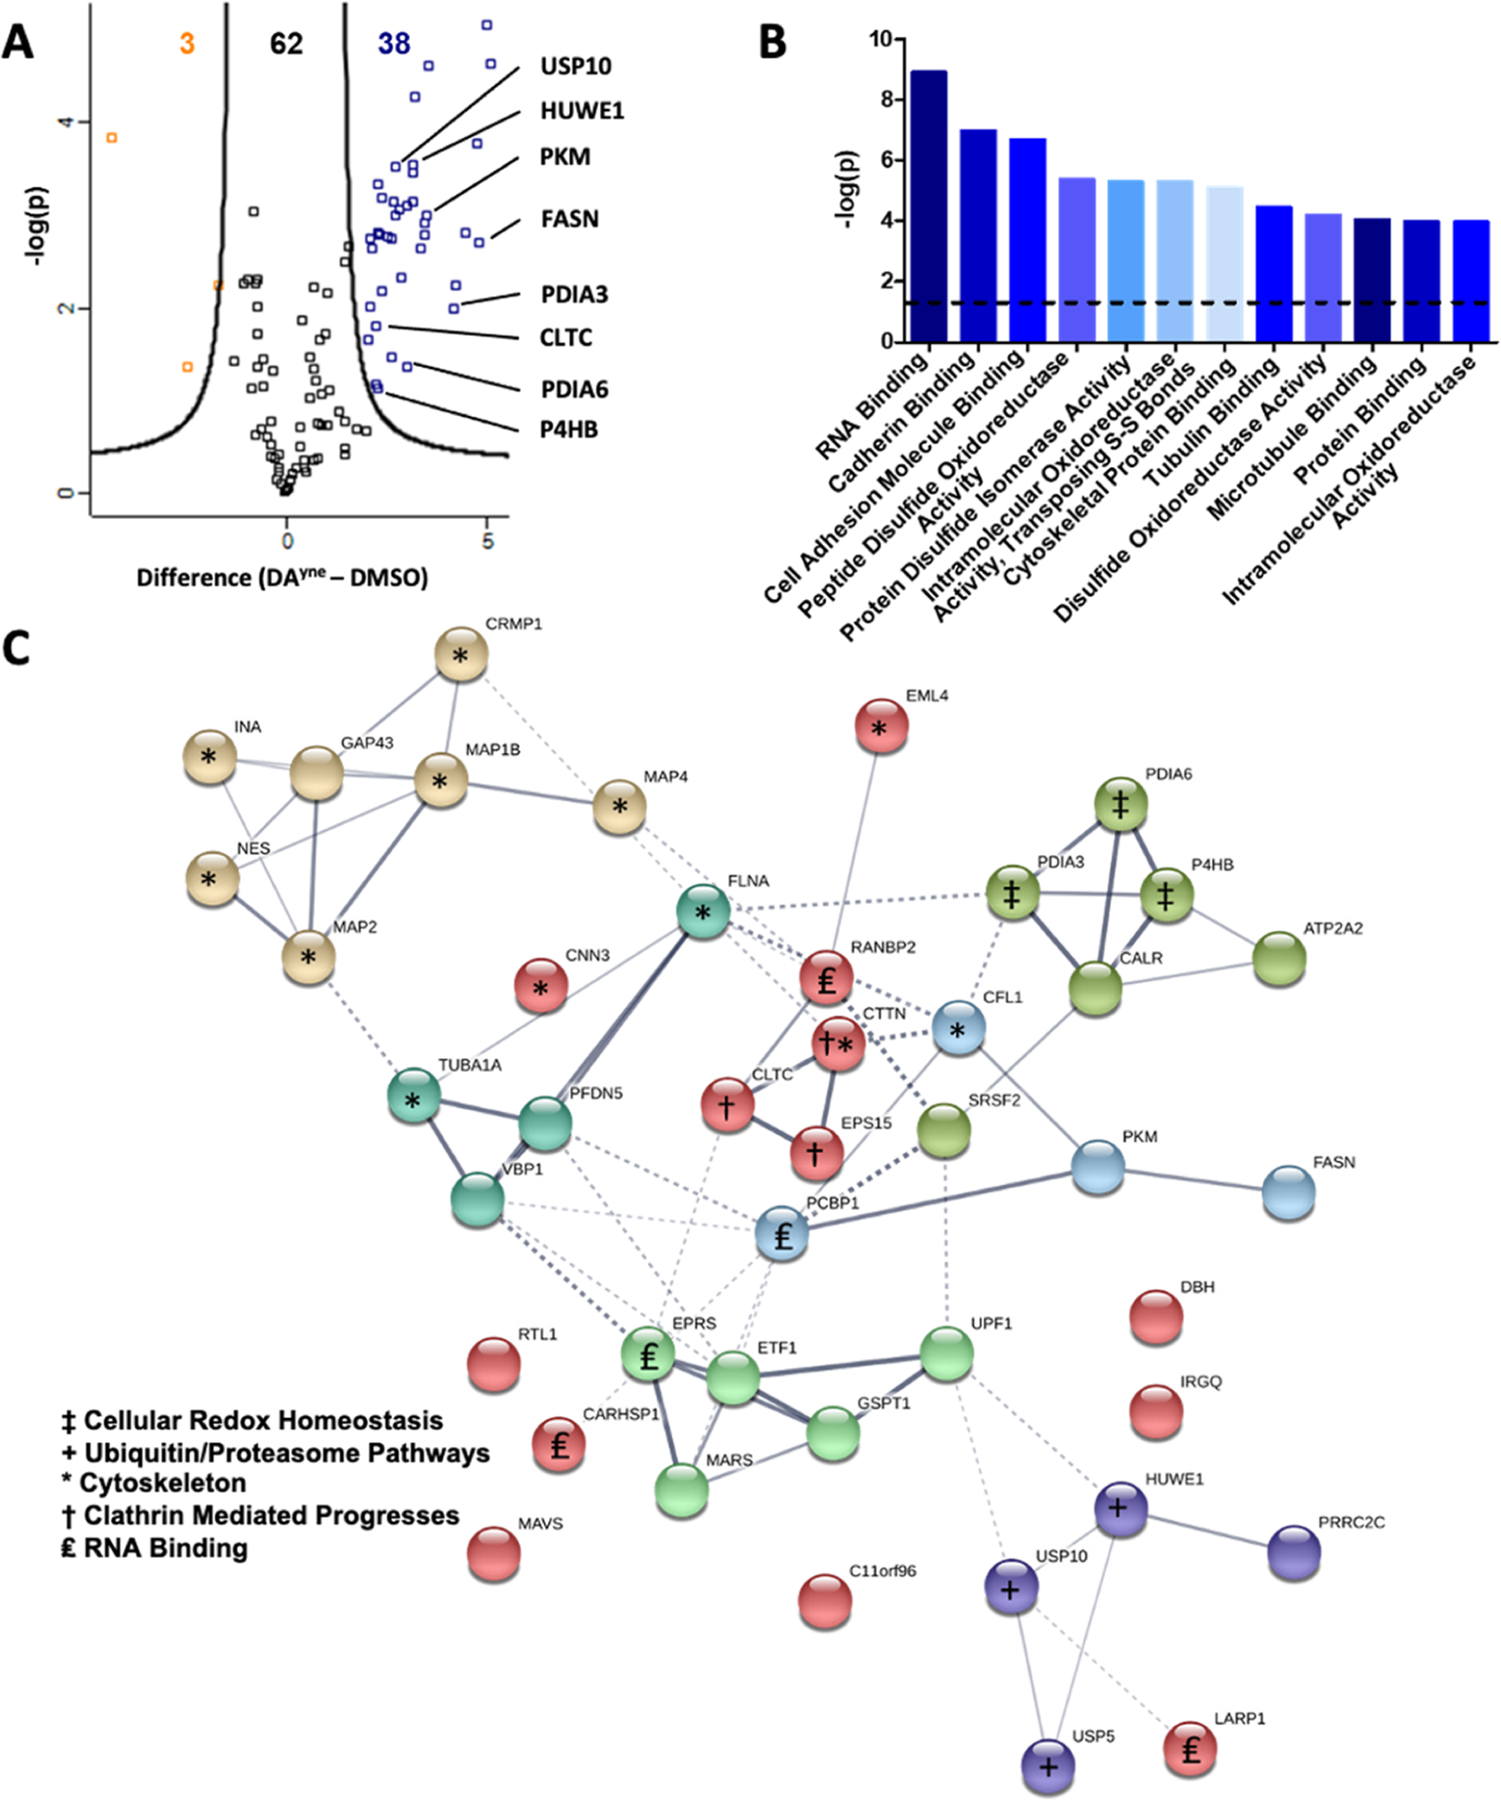
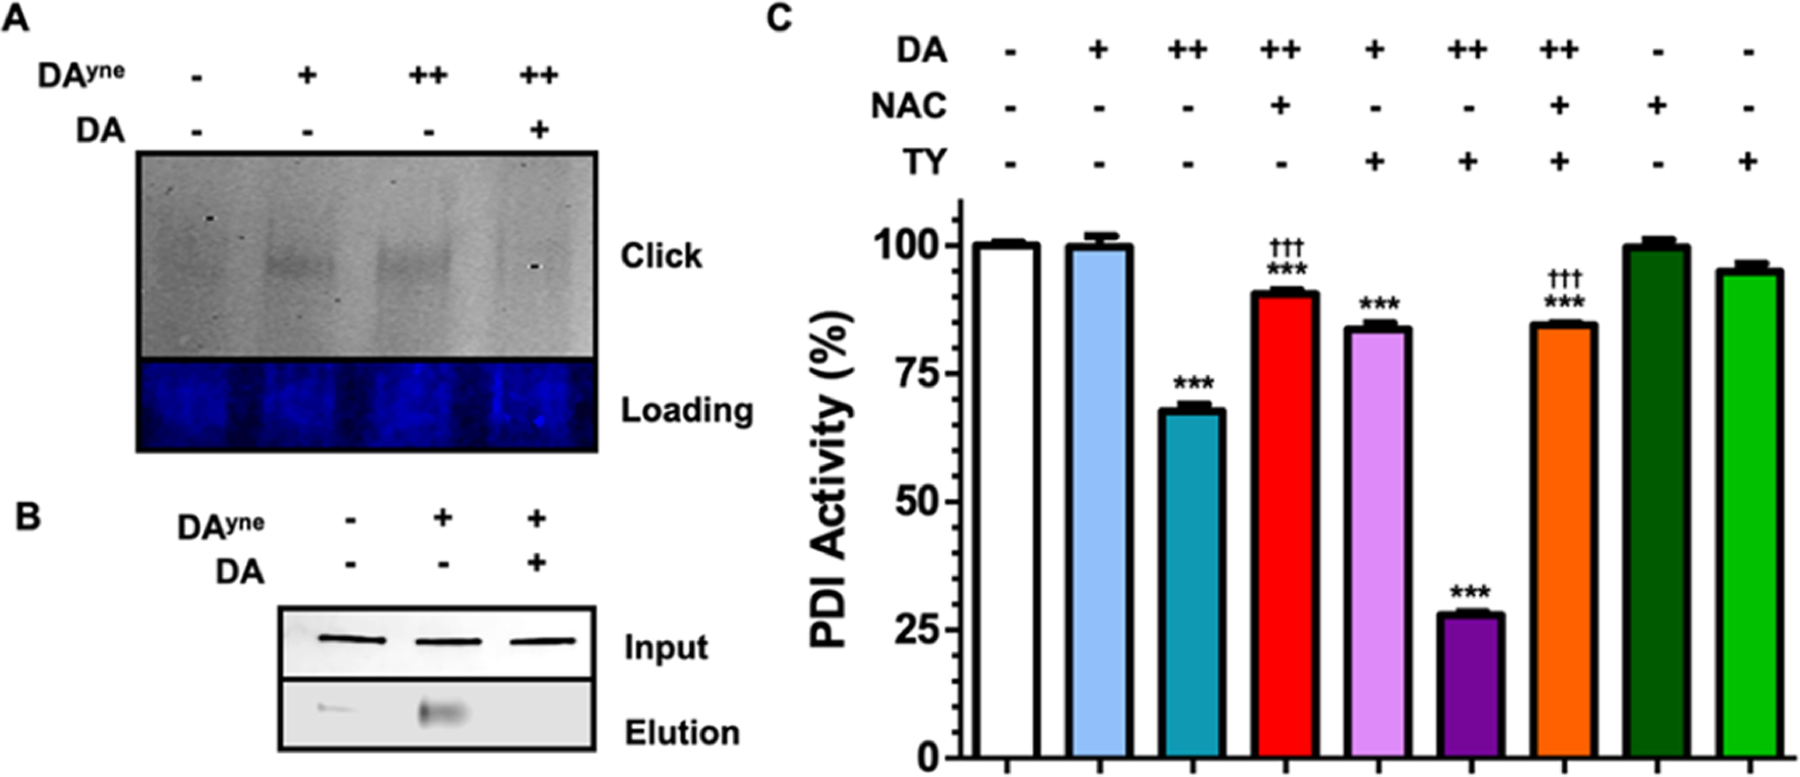
Selective death of midbrain dopaminergic neurons is a hallmark pathology of Parkinson's disease (PD), but the molecular mechanisms that initiate the cascade of events resulting in neurodegeneration in PD remain unclear. Compelling evidence suggests that dysregulation of dopamine (DA) induces neuronal stress and damage responses that are operative processes in striatal degeneration preceding PD-like symptoms. Improper DA sequestration to vesicles raises cytosolic DA levels, which is rapidly converted into electrophilic dopaquinone species (DQs) that react readily with protein nucleophiles forming covalent modifications that alter the native structure and function of proteins. These so-called DA-protein adducts (DPAs) have been reported to play a role in neurotoxicity, and their abundance with respect to neurodegeneration has been linked to clinical and pathological features of PD that suggest that they play a causal role in PD pathogenesis. Therefore, characterizing DPAs is a critical first step in understanding the susceptibility of midbrain dopaminergic neurons during PD. To help achieve this goal, we report here a novel DA-mimetic (DAyne) containing a biorthogonal alkyne handle that exhibits a reactivity profile similar to DA in aqueous buffers. By linking DPAs formed with DAyne to a fluorescent reporter molecule, DPAs were visualized in fixed cells and within lysates. DAyne enabled global mapping of cellular proteins affected by DQ modification and their bioactive pathways through enrichment. Our proteomic profiling of DPAs in neuronal SH-SY5Y cells indicates that proteins susceptible to DPA formation are extant throughout the proteome, potentially influencing several diverse biological pathways involved in PD such as endoplasmic reticulum (ER) stress, cytoskeletal instability, proteotoxicity, and clathrin function. We validated that a protein involved in the ER stress pathway, protein disulfide isomerase 3 (PDIA3), which was enriched in our chemoproteomic analysis, is functionally inhibited by DA, providing evidence that dysregulated cellular DA may induce or exacerbate ER stress. Thus, DAyne provided new mechanistic insights into DA toxicity that may be observed during PD by enabling characterization of DPAs generated reproducibly at physiologically relevant quinone exposures. We anticipate our design and application of this reactivity-based probe will be generally applicable for clarifying mechanisms of metabolic quinone toxicity.


Conflict of interest statement

The authors declare no competing financial interest.

Figures

Figure 1.
Figure 1.
Simplified schematic of dopamine oxidation to electrophilic DQs metabolites. Shown are the 2 e, 4 e, and 6 e oxidation products of DA; dopa-o-quinone (DQ), aminochrome (AC), and dihydroxyindole (DHI), respectively.
Figure 2.
Figure 2.
(A) Chemical biology strategy to visualize and identify DPAs. (B) Synthesis of DAyne. (a) Methyl trifluoroacetate, triethylamine, CH3OH; 93%. (b) pTSA, 2,2-dimethoxypropane, toluene; 79%. (c) LiOH, CH3OH; 98%. (d) Nosyl chloride, triethylamine, CH2Cl2; 97%. (e) Propargyl bromide, K2CO3, acetone; 96%. (f) Thiophenol, KOH, CH3CN; 50%. (g) Trifluoroacetic acid, CHCl3 then HCl, tetrahydrofuran; 96%.
Figure 3.
Figure 3.
Spectroscopic characterization of DA and DAyne oxidation. (A) Oxidation products of DA and DAyne. (B/C) Absorbance spectra time course of 50 μM DA/DAyne respectively and 50 μM NaIO4 in H2O. (D/E) Change in absorbance at 475 nm of 50 μM DA/DAyne and 50 μM NaIO4 in H2O or PBS pH 7.4 respectively. 475 nm absorption is characteristic of aminochrome formation. Data are represented as mean ± SEM from three replicates. (F/G) NMR spectra time course of 1 mM DA/DAyne, respectively, and 1 mM NaIO4 in PBS pH 7.4. Labels above proton resonances denote corresponding compounds. Water solvent peak was removed for clarity.
Figure 4.
Figure 4.
DA and DAyne reduce SH-SY5Y cell viability. Cell viability was determined through an alamarBlue assay. Data are represented as mean ± SEM from four replicates and normalized to DMSO control. All treatments of DA and DAyne at analogous times and concentrations were analyzed via a one-way ANVOA and an unpaired t-test (***p < 0.001). Percent viability of cells was determined following treatment with (A) DA or (B) DAyne alone. (C) Cells were treated with 100 μM DA or DAyne in the presence or absence of 2.5 mM NAC, which showed that cell viability was rescued under these conditions.
Figure 5.
Figure 5.
Visualization of DPAs by DAyne. (A) Representative nitrocellulose blot following incubation of SH-SY5Y cells with DMSO, 2.5 mM NAC, 1 μM, 10 μM, 100 μM, or 100 μM DAyne and 2.5 mM NAC for 12 h, lysis and ensuing CuAAC click reaction with biotin azide. Top: 800 nm channel following incubation with SA800. Bottom: 700 nm channel following REVERT total protein stain. (B) Quantification of DPAs. Fluorescence intensity (F.I.) of SA800 for each treatment was normalized by total protein through the REVERT stain. Data are represented as mean ± SEM from three replicates. Data were analyzed via a two-way ANOVA and an unpaired t-test. (Comparisons between: DMSO *p < 0.05; 100 μM DAynep < 0.05 for given treatment duration). (C) Confocal imaging of SH-SY5Y cells following treatment with DMSO, 1 μM, 10 μM, 100 μM, or 100 μM DAyne and 2.5 mM NAC, respectively for 12 h, fixation with paraformaldehyde, ensuing CuAAC click reaction with Alexa Fluor 647 azide and staining with DAPI. Images were acquired at 60× magnification.
Figure 6.
Figure 6.
Proteomic enrichment and bioinformatic analysis of DPAs. (A) Volcano plot for quantitative analysis of proteins identified following 12 h treatment of SH-SY5Y cells with DMSO or 10 μM DAyne and enrichment at a FDR of 0.05 and a minimal coefficient of variation (S0) of 2.0. Proteins highlighted in orange or blue were significantly enriched in the DMSO or DAyne treatment, respectively. Data are representative of 3 biological replicates from each treatment condition. (B) Molecular function of DAyne enriched proteins. Analysis performed with PANTHER overrepresentation test (released 20190711); annotation version: GO Ontology database (released 20190703), using Fisher’s exact test with FDR correction. The dashed line represents a statistical cutoff of p = 0.05. (C) Pathway analysis of DAyne enriched proteins was performed with the STRING (Search Tool for the Retrieve of Interacting Genes, version 11) database. Confidence of interaction represented by line thickness. Proteins involved in enriched processes are labeled.
Figure 7.
Figure 7.
PDIA3 is covalently modified and functionally inhibited by DQs. (A) Representative SDS-PAGE gel after incubating PDIA3 for 1 h with DMSO, 10 μM, 150 μM DAyne preoxidized with TY, or with 150 μM DAyne after a 30 min 150 μM DA pre-treatment (both preoxidized with TY), and ensuing CuAAC click reaction with Alexa Fluor 647 azide. Top: Alexa Fluor 647 fluorescence intensity. Bottom: Imperial protein stain. (B) Representative nitrocellulose blot probed for PDIA3 following capture with DAyne. SH-SY5Y lysate was incubated with DMSO, 150 μM DAyne, or with 150 μM DAyne after a 30 min 150 μM DA pre-treatment lysis and subjected to a CuAAC click reaction with biotin azide. Samples were then incubated with streptavidin agarose beads to capture DPAs. Top: sample lysate prior to streptavidin enrichment. Bottom: elution of DPAs following streptavidin agarose enrichment. (C) Percent PDI activity following a 30 min incubation with the indicated treatment. Final concentrations of DA used were 10 and 150 μM. TY was used to oxidize DA to DQs. The final NAC concentration was 1 mM. Data are represented as mean ± SEM from four replicates and normalized to DMSO control. Data were analyzed via a two-way ANOVA and a tukey post hoc test. (Comparisons between: DMSO ***P < 0.0001; 150 μM DA †††P < 0.0001) for given treatment duration.

References

    1. GBD 2016 Parkinson’s Disease Collaborators. Global, regional, and national burden of Parkinson’s disease, 1990–2016: a systematic analysis for the Global Burden of Disease Study 2016. Lancet Neurol. 2018, 17, 939–953. - PMC - PubMed
    1. Poewe W; Seppi K; Tanner CM; Halliday GM; Brundin P; Volkmann J; Schrag A-E; Lang AE Parkinson disease. Nat. Rev. Dis. Primers 2017, 3, 17013. - PubMed
    1. Zecca L; Fariello R; Riederer P; Sulzer D; Gatti A; Tampellini D The absolute concentration of nigral neuromelanin, assayed by a new sensitive method, increases throughout the life and is dramatically decreased in Parkinson’s disease. FEBS Lett. 2002, 510, 216–220. - PubMed
    1. Cheng H-C; Ulane CM; Burke RE Clinical progression in Parkinson disease and the neurobiology of axons. Ann. Neurol 2010, 67, 715–725. - PMC - PubMed
    1. Monzani E; Nicolis S; Dell’Acqua S; Capucciati A; Bacchella C; Zucca FA; Mosharov EV; Sulzer D; Zecca L; Casella L Dopamine, Oxidative Stress and Protein-Quinone Modifications in Parkinson’s and Other Neurodegenerative Diseases. Angew. Chem., Int. Ed. Engl 2019, 58, 6512–6527. - PubMed

Publication types