. 2022 Jan 8;6(3):854-865.
doi: 10.1182/bloodadvances.2021005522.

Decreased IL-10 accelerates B-cell leukemia/lymphoma in a mouse model of pediatric lymphoid leukemia

Affiliations

Decreased IL-10 accelerates B-cell leukemia/lymphoma in a mouse model of pediatric lymphoid leukemia

Briana A Fitch et al. Blood Adv. .

Abstract

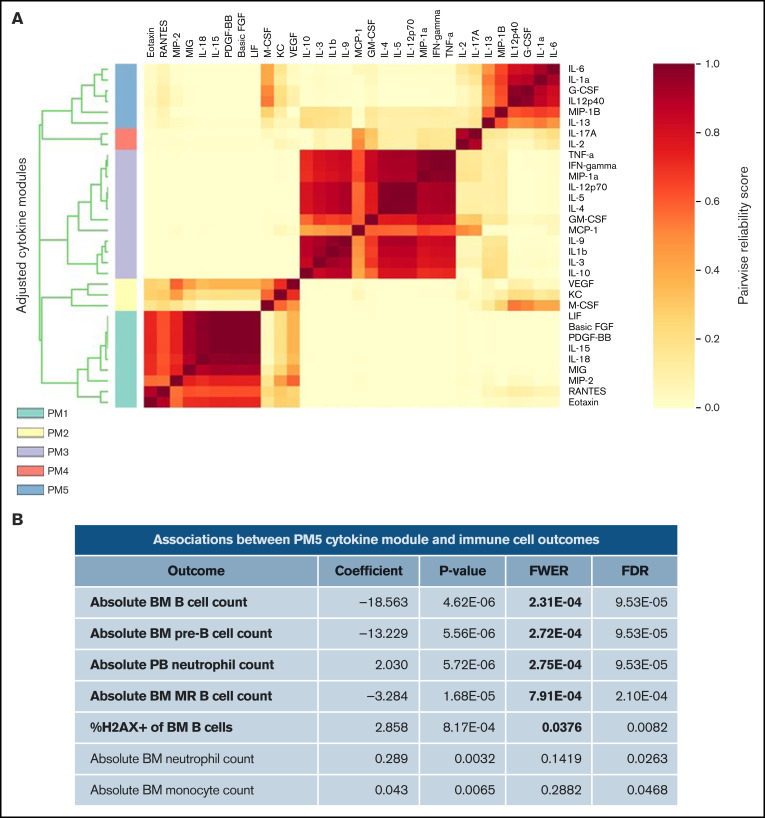
Exposures to a wide repertoire of common childhood infections and strong inflammatory responses to those infections are associated with the risk of pediatric B-cell acute lymphoblastic leukemia (B-ALL) in opposing directions. Neonatal inflammatory markers are also related to risk by unknown mechanism(s). Here, we demonstrate that interleukin-10 (IL-10) deficiency, which is associated with childhood B-ALL, indirectly impairs B lymphopoiesis and increases B-cell DNA damage in association with a module of 6 proinflammatory/myeloid-associated cytokines (IL-1α, IL-6, IL-12p40, IL-13, macrophage inflammatory protein-1β/CCL4, and granulocyte colony-stimulating factor). Importantly, antibiotics attenuated inflammation and B-cell defects in preleukemic Cdkn2a-/-Il10-/- mice. In an ETV6-RUNX1+ (E6R1+) Cdkn2a-/- mouse model of B-ALL, decreased levels of IL-10 accelerated B-cell neoplasms in a dose-dependent manner and altered the mutational profile of these neoplasms. Our results illuminate a mechanism through which a low level of IL-10 can create a risk for leukemic transformation and support developing evidence that microbial dysbiosis contributes to pediatric B-ALL.


Figures

None
Graphical abstract
Figure 1.
Figure 1.
Disruption of B lymphopoiesis and double-stranded DNA breaks in B cells are correlated with myeloid expansion in Il10−/− mice. Analysis of immune cell lineages and cytokines in 8- to 12-week-old Il10+/+ and Il10−/− mice. (A) Representative flow cytometry plots show the percentage of CD11b+ CD19 myeloid cells and CD19+ B cells of FVB/N and Il10−/− bone marrow (BM) gated on single live cells (left panel). Bar graph summarizes the number of CD19+ B, CD3+ T, and CD11b+ CD19 myeloid cells in the BM (right panel). (B) Number of pro-B cells (B220+CD19+IgMIgDCD43+), pre-B cells (B220+CD19+IgMIgDCD43), IgM+ immature B cells (B220+CD19+IgM+IgD), and MR B cells (B220+CD19+IgM+IgD+) in the BM. (C) Percentage of B-cell subsets in B220+CD19+ BM. (D) Number of neutrophils (CD11b+CD19 Gr1hiLy6Clo) and monocytes (CD11b+CD19Gr1loLy6Chi) in the BM. (E) Percentage of myeloid subsets in single live BM cells. Percentage of γH2AX+ cells among total BM B cells (F) and BM B-cell subsets (G). (H) Absolute plasma concentrations of a selected panel of myeloid, proinflammatory, and T-cell regulatory cytokines detected by a bead-based multiplex Luminex assay. Plasmas of all mice were assayed simultaneously. Nominal P values are presented for cytokine data. Data in (A-G) are representative of 3 experiments. Error bars represent mean ± standard deviation. *P ≤ .05, **P ≤ .01, ***P ≤ .001, ****P ≤ .001. Statistical tests used are described in Methods.
Figure 2.
Figure 2.
Cytokine modules defined in combined cytokine profiles of Il10+/+ and Il10−/− mice are associated with B-cell outcomes. (A) Heat map of cytokine modules displaying pairwise reliability scores of adjusted cytokines over 1000 random samplings of subjects. The optimal number of clusters was determined by the Tibshirani gap statistic method. (B) Table of associations between PM5 module and immune cell outcomes with differential abundance between Il10+/+ and Il10−/− bone marrow (BM) or peripheral blood (PB). Log-cytokine regression coefficient, P value, FWER, and false-discovery rate (FDR) were calculated as described.
Figure 3.
Figure 3.
Antibiotic treatment response rescues preleukemic Cdkn2a−/−Il10−/− B cells from impaired development and DNA damage. Analysis of 8- to 12-week-old Cdkn2a−/−Il10+/+ and Cdkn2a−/−Il10−/− mice. (A) Absolute bone marrow (BM) count of total B220+CD19+ B cells and BM B-cell subsets. (B) Percent of γH2AX+ cells among total BM B cells and BM B-cell subsets. (C) Schematic diagram of antibiotic (ABX) treatment and tracking of peripheral blood and BM cells in adult mice. (D) Concentration of cytokines in Il10−/−Cdkn2a−/− mice and controls. Lines connect values from the same mouse sampled before and after antibiotic treatment. Flow analysis of the percentage of CD11b+CD19 cells (E) and CD19+ B220+ cells (F) in BM. (G) Percentage of γH2AX+ of CD19+B220+ cells in Cdkn2a−/−Il10+/+ and Cdkn2a−/−Il10−/− mice after treatment with placebo (-) or antibiotics (+) for 4 weeks. Data in (A-B) are representative of 2 experiments. Data in (D-G) were obtained from a single-cohort study. Error bars represent the mean ± standard deviation. *P ≤ .05, **P ≤ .01, ***P ≤ .001, ****P ≤ .001. Statistical tests used are described in Methods.
Figure 4.
Figure 4.
Decreased levels of IL-10 accelerate development of B-cell disease in the E6R1+Cdkn2a−/− model. Survival curves for cancer (A) and leukemia/lymphoma development (B) in E6R1+Cdkn2a−/− Il10+/+ mice and E6R1+Cdkn2a−/−Il10−/− mice. Log-rank (Mantel-Cox) test. (C) Number of total or nonsynonymous SNVs in B-cell leukemia/lymphomas from exome sequencing of 9 E6R1+Cdkn2a−/−Il10+/+ mice and 8 E6R1+Cdkn2a−/−Il10−/− mice. Error bars represent the mean ± standard deviation. (D) Mutation spectrum representing the frequency of mutations in each context of 96 possible trinucleotide contexts in sequenced E6R1+Cdkn2a−/−Il10+/+ and E6R1+Cdkn2a−/−Il10−/− B-cell leukemia/lymphomas. (E) Model for the role of microbial dysbiosis in childhood B-cell leukemia/lymphoma. IL-10 deficiency induces microbial dysbiosis in the gut, resulting in inflammation with distal effects of B-cell deficiency and B-cell DNA damage in the bone marrow. The inflammation-associated acquisition of genetic lesions in bone marrow B cells leads to the development of B-cell leukemia/lymphoma. Antibiotics may counteract the impact of low IL-10 by restoring bacterial homeostasis in the gut.

Similar articles

Cited by

References

    1. Hwee J, Tait C, Sung L, Kwong JC, Sutradhar R, Pole JD. A systematic review and meta-analysis of the association between childhood infections and the risk of childhood acute lymphoblastic leukaemia. Br J Cancer. 2018;118(1):127-137. - PMC - PubMed
    1. Urayama KY, Buffler PA, Gallagher ER, Ayoob JM, Ma X. A meta-analysis of the association between day-care attendance and childhood acute lymphoblastic leukaemia. Int J Epidemiol. 2010;39(3):718-732. - PMC - PubMed
    1. Rudant J, Lightfoot T, Urayama KY, et al. . Childhood acute lymphoblastic leukemia and indicators of early immune stimulation: a Childhood Leukemia International Consortium study. Am J Epidemiol. 2015;181(8):549-562. - PMC - PubMed
    1. Hjalgrim LL, Rostgaard K, Hjalgrim H, et al. . Birth weight and risk for childhood leukemia in Denmark, Sweden, Norway, and Iceland. J Natl Cancer Inst. 2004;96(20):1549-1556. - PubMed
    1. Chang JS, Tsai C-R, Tsai Y-W, Wiemels JL. Medically diagnosed infections and risk of childhood leukaemia: a population-based case-control study. Int J Epidemiol. 2012;41(4):1050-1059. - PubMed

Publication types