. 2022 Feb;28(3):950-968.
doi: 10.1111/gcb.15970. Epub 2021 Nov 17.

Coupling plant litter quantity to a novel metric for litter quality explains C storage changes in a thawing permafrost peatland

Collaborators, Affiliations

Coupling plant litter quantity to a novel metric for litter quality explains C storage changes in a thawing permafrost peatland

Moira Hough et al. Glob Chang Biol. 2022 Feb.

Abstract

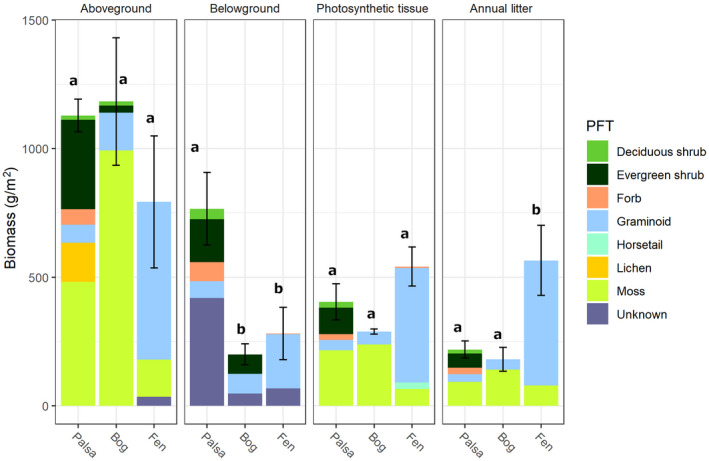
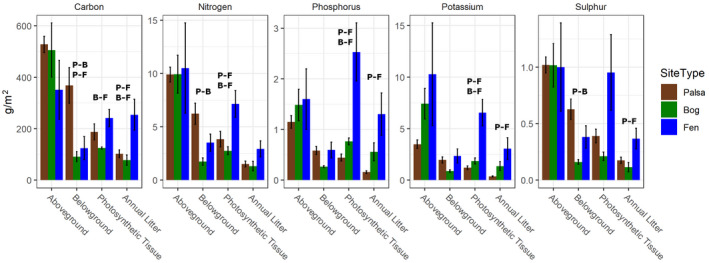
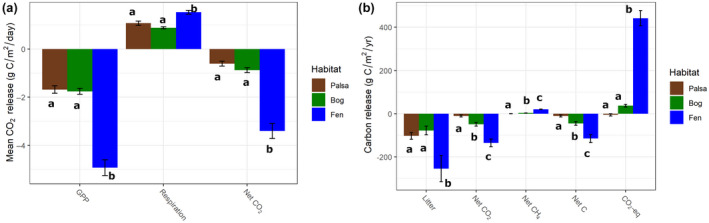
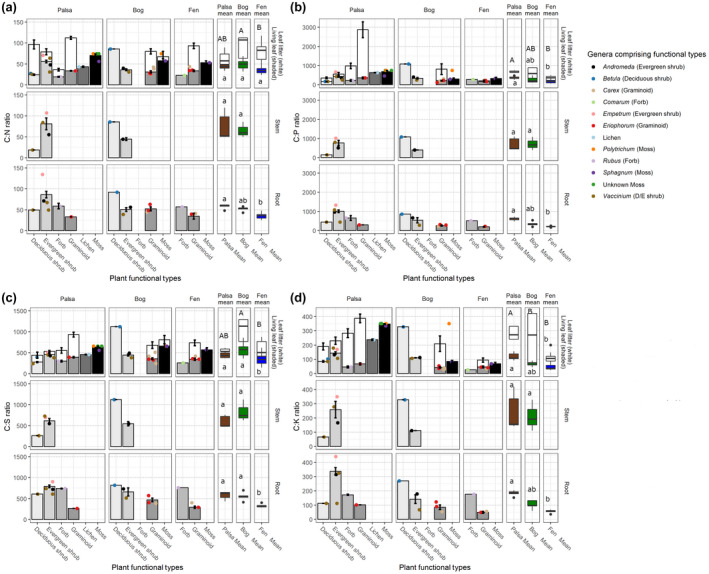
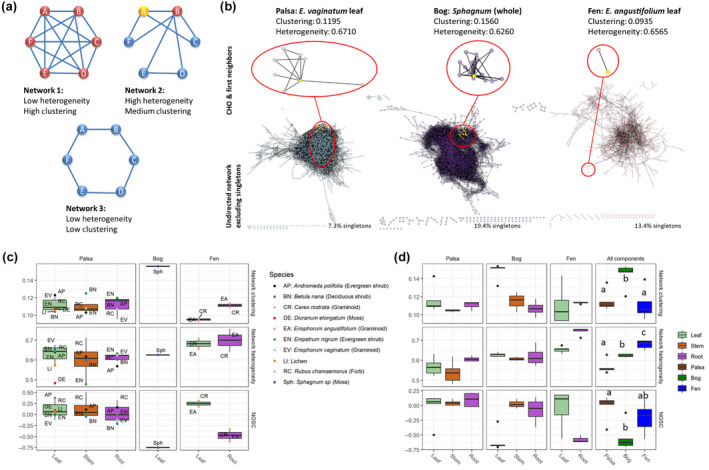
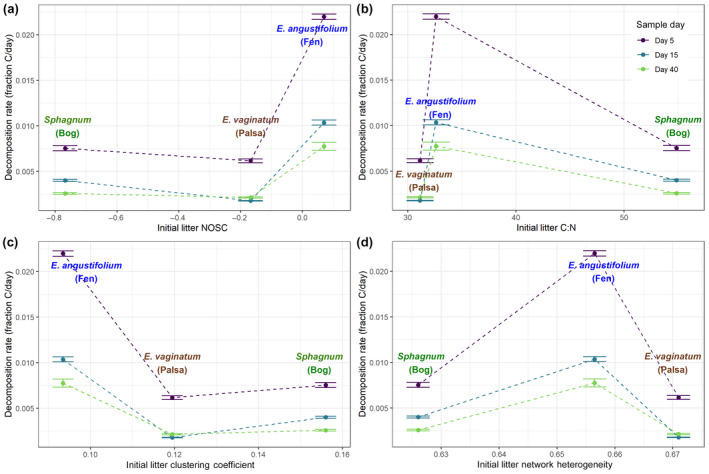
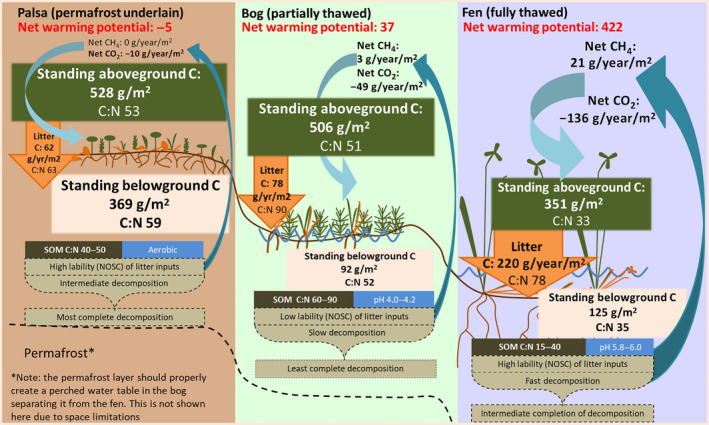
Permafrost thaw is a major potential feedback source to climate change as it can drive the increased release of greenhouse gases carbon dioxide (CO2 ) and methane (CH4 ). This carbon release from the decomposition of thawing soil organic material can be mitigated by increased net primary productivity (NPP) caused by warming, increasing atmospheric CO2 , and plant community transition. However, the net effect on C storage also depends on how these plant community changes alter plant litter quantity, quality, and decomposition rates. Predicting decomposition rates based on litter quality remains challenging, but a promising new way forward is to incorporate measures of the energetic favorability to soil microbes of plant biomass decomposition. We asked how the variation in one such measure, the nominal oxidation state of carbon (NOSC), interacts with changing quantities of plant material inputs to influence the net C balance of a thawing permafrost peatland. We found: (1) Plant productivity (NPP) increased post-thaw, but instead of contributing to increased standing biomass, it increased plant biomass turnover via increased litter inputs to soil; (2) Plant litter thermodynamic favorability (NOSC) and decomposition rate both increased post-thaw, despite limited changes in bulk C:N ratios; (3) these increases caused the higher NPP to cycle more rapidly through both plants and soil, contributing to higher CO2 and CH4 fluxes from decomposition. Thus, the increased C-storage expected from higher productivity was limited and the high global warming potential of CH4 contributed a net positive warming effect. Although post-thaw peatlands are currently C sinks due to high NPP offsetting high CO2 release, this status is very sensitive to the plant community's litter input rate and quality. Integration of novel bioavailability metrics based on litter chemistry, including NOSC, into studies of ecosystem dynamics, is needed to improve the understanding of controls on arctic C stocks under continued ecosystem transition.

Keywords: C storage; NOSC; Stordalen Mire; decomposition; litter chemistry; peat; permafrost thaw; plant community change.


Conflict of interest statement

The authors declare that they have no conflict of interest.

Figures

FIGURE 1
FIGURE 1
Plant community composition. Standing biomass (aboveground, belowground, photosynthetic tissue) or annual litter input at each state of permafrost thaw (palsa, bog, fen), by plant functional type. Letters indicate significant differences between different thaw stages in total pool size or flux (ANOVA, Tukey HSD p < .05). Error bars show the standard error of mean total values
FIGURE 2
FIGURE 2
Total nutrient content in plant tissues. Total carbon (C), nitrogen (N), sulfur (S), phosphorus (P), and potassium (K) in standing aboveground biomass, belowground biomass, photosynthetic tissue, and annual litter inputs at each thaw stage (palsa, bog, fen). Letters indicate significant differences between different identified thaw stages (P, palsa; B, bog; F, fen) in total pool size or flux (ANOVA, Tukey HSD p < .05). Error bars are the standard error of the mean
FIGURE 3
FIGURE 3
Net ecosystem fluxes. (a) Gross primary productivity, ecosystem respiration, and net CO2 flux across the thaw gradient (with positive values indicating net flux to the atmosphere) estimated as a 24‐h average from July measurements (peak growing season) under light and dark conditions in autochambers. (b) Flows of C to the atmosphere via litter, net CO2 exchange, net CH4 exchange, net C balance (from both CO2 and CH4), and in CO2‐equivalents (assuming a CH4 Global Warming Potential of 28)
FIGURE 4
FIGURE 4
Plant nutrient ratios by functional type. Nutrient content of plant functional types (PFT), by tissue type (rows) and permafrost thaw stage (palsa, bog, fen) (columns) for (a) carbon:nitrogen (C:N), (b) carbon:phosphorus (C:P), c) carbon:sulfur (C:S), and (d) carbon:potassium (C:K). Shaded bars show nutrient concentrations in living tissues, while white bars show nutrient concentrations in senesced leaf tissues. Colored dots represent genus‐level means for the species within each PFT. Colored box plots represent biomass‐weighted mean nutrient concentrations for each stage of permafrost thaw. Statistical differences are based on the Dunn test or Wilcox test (where limited to two comparisons) controlled for false discovery rate with Benjamini‐Hochberg method using Q = 0.05
FIGURE 5
FIGURE 5
Plant chemistry network characteristics and NOSC. (a) Examples of networks with different clustering coefficients and heterogeneity, with nodes colored by the number of connecting edges (red = 5, yellow = 3, blue = 2). Network 1: all nodes are equally connected resulting in low heterogeneity and as connected as possible resulting in a high clustering coefficient. Network 2: Node B is a highly connected hub node while others have very few connections resulting in a high variance in connectivity across nodes (Dong & Horvath, 2007) which creates high heterogeneity and an intermediate clustering coefficient (since the average number of connections between nodes is neither maximal nor minimal). Network 3: All nodes are equally connected resulting in low heterogeneity, and the average number of connections between nodes is very low resulting in a low clustering coefficient. (b) Visualization of networks for litter used in incubations with peat from palsa (E. vaginatum leaf), bog (Sphagnum), and fen (E. angustifolium leaf). Zoomed‐in areas show sub‐networks for a single compound (CHO) and its first neighbors to illustrate differences in clustering and heterogeneity. (c) Differences in bioavailability of plant litter based on FT‐ICR MS analyses showing average nominal oxidation state of carbon (NOSC), network heterogeneity, and network clustering coefficient for each tissue type of each plant species grouped by permafrost thaw stage and tissue type. Both network heterogeneity and clustering coefficient have a possible range from 0 to 1, while NOSC may range from −4 to +4. (d) biomass‐weighted average NOSC, network heterogeneity, and clustering coefficient for each tissue type as well as total plant biomass (all components) at each thaw stage. Mass‐weighted indices were calculated based on biomass contribution per field‐sampling plot for each species. Variation within a thawing stage is driven by species composition differences between plots. Different letters indicate significant differences based on ANOVA and Tukey HSD tests with p < .05
FIGURE 6
FIGURE 6
Impacts of plant litter chemistry on decomposition rate. Carbon decomposition rate (sum of CO2 and CH4) at days 5, 15, and 40 for plant litter characteristic of each stage of permafrost thaw. Litter was added to peat from the corresponding thaw stage and incubated with aerobic headspace. Decomposition rates are plotted versus (a) average nominal oxidation state of carbon of the litter, (b) clustering coefficient of compounds found in litter, (c) network heterogeneity of compounds found in litter, and (d) bulk carbon:nitrogen ratio of the litter. Error bars show standard error across replicate incubations for each time point: 9 for day 5, 6 for day 15, 3 for day 40. All values are significantly different at p < .05 based on ANOVA with Tukey HSD except for Fen:Day 40‐Bog:Day 5, Palsa:Day 40‐Palsa:Day 15, Bog:Day 40‐Palsa:Day 15, Bog:Day 40‐Bog:Day 15, Bog:Day 40‐Palsa:Day 40
FIGURE 7
FIGURE 7
Overview of changing C stocks, flows, and key ecosystem properties across permafrost thaw gradient. While standing stocks of C in plant biomass decrease across the permafrost thaw gradient, the rate of C cycling increases. This is driven by increased uptake (NPP) and faster transfer of NPP to SOM via litter with thaw (as seen in fully thawed fen versus palsa or bog areas). High bioavailability of litter in the fully thawed fen results in rapid decomposition with a large contribution to CO2 and especially CH4 production but the high volume of litter input results in incomplete decomposition. In pre‐thaw (palsa) areas, high bioavailability but smaller volume of litter and aerobic conditions result in near‐complete decomposition of inputs but a smaller contribution to C emissions than in post‐thaw areas. In intermediate thaw (bog) areas, the intermediate volume of low bioavailability litter and anaerobic conditions result in slower and incomplete decomposition with intermediate C emissions. Overall, this leads to positive feedback from permafrost thaw to global warming

References

    1. Aerts, R. (1996). nutrient resorption from senescing leaves of perennials: Are there general patterns? The Journal of Ecology, 84(4), 597–608. 10.2307/2261481 - DOI
    1. AminiTabrizi, R. , Wilson, R. M. , Fudyma, J. D. , Hodgkins, S. B. , Heyman, H. M. , Rich, V. I. , Saleska, S. R. , Chanton, J. P. , & Tfaily, M. M. (2020). Controls on soil organic matter degradation and subsequent greenhouse gas emissions across a permafrost thaw gradient in Northern Sweden. Frontiers in Earth. 10.3389/feart.2020.557961 - DOI
    1. Bäckstrand, K. , Crill, P. M. , Jackowicz‐Korczyñski, M. , Mastepanov, M. , Christensen, T. R. , & Bastviken, D. (2010). Annual carbon gas budget for a subarctic peatland, Northern Sweden. Biogeosciences, 7(1), 95–108. 10.5194/bg-7-95-2010 - DOI
    1. Bintanja, R. , & Andry, O. (2017). Towards a rain‐dominated Arctic. Nature Climate Change, 7(4), 263–267. 10.1038/nclimate3240 - DOI
    1. Blume‐Werry, G. , Milbau, A. , Teuber, L. M. , Johansson, M. , & Dorrepaal, E. (2019). Dwelling in the deep—strongly increased root growth and rooting depth enhance plant interactions with thawing permafrost soil. The New Phytologist, 223(3), 1328–1339. 10.1111/nph.15903 - DOI - PubMed