. 2021 Nov;7(3):e001694.
doi: 10.1136/rmdopen-2021-001694.

All-cause mortality in systemic rheumatic diseases under treatment compared with the general population, 2015-2019

Affiliations

All-cause mortality in systemic rheumatic diseases under treatment compared with the general population, 2015-2019

Vasiliki-Kalliopi Bournia et al. RMD Open. 2021 Nov.

Abstract

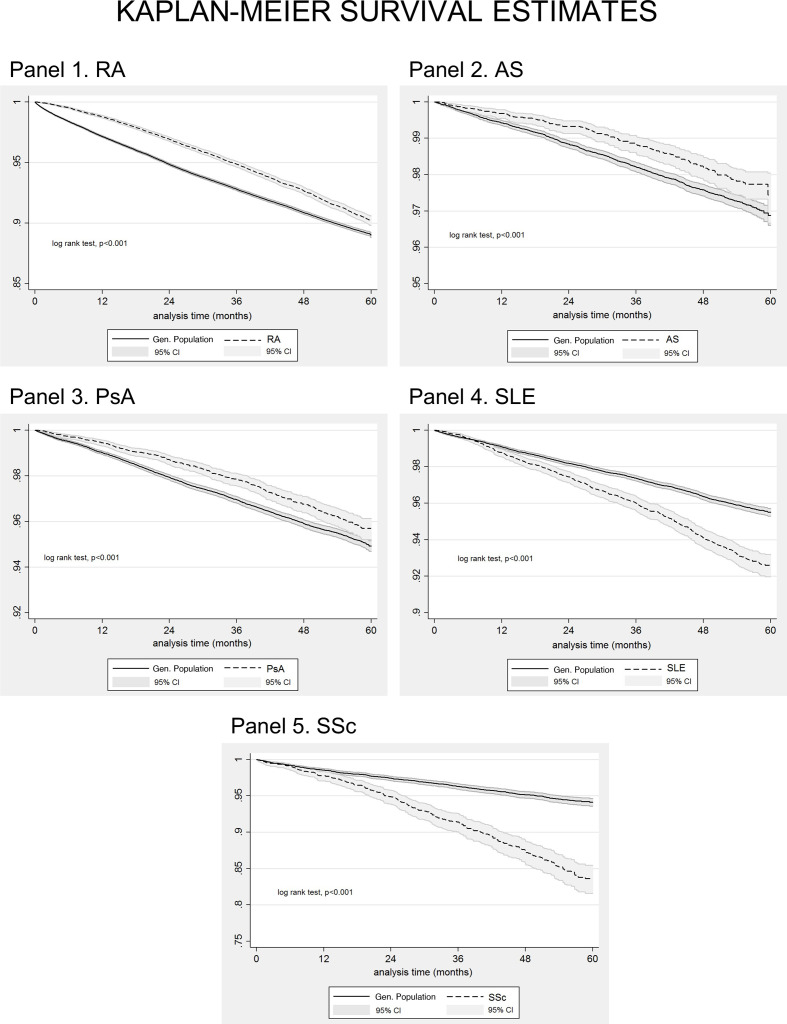
Objectives: To compare current all-cause mortality rates in rheumatoid arthritis (RA), ankylosing spondylitis (AS), psoriatic arthritis (PsA), systemic lupus erythematosus (SLE) and systemic sclerosis (SSc) versus general population.

Methods: In this population-based, retrospective cohort study, anonymised data on 11 186 586 citizens, including all patients with RA (42 735, 79% female), AS (9707, 43% female), PsA (13 779, 55% female), SLE (10 440, 89% female) and SSc (2277, 88% female), (median age of 64/47/54/53/59 years at study entry, respectively), under prescribed treatment between 2015 and 2019, were extracted from the electronic database covering nearly 99% of the Greek population.

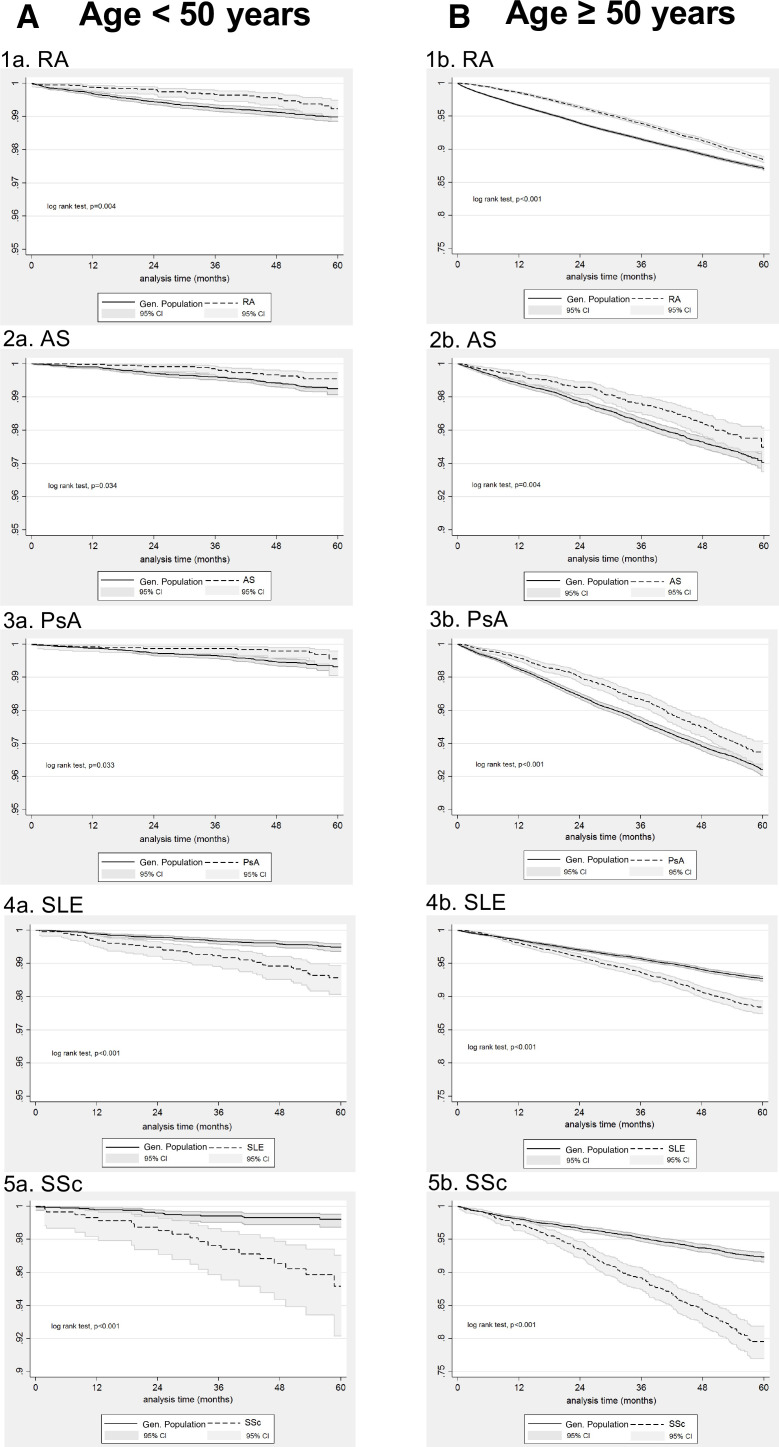
Results: After 1:5 (patients:general population) matching for gender/age, we found that survival was worse in SSc, followed by SLE and inflammatory arthritis. Compared with the general population HRs for death increased from the first 3 years to 5 years of observation possibly due to increases in disease duration: RA (from 0.63 to 1.13 (95% CI: 1.05 to 1.22), AS (from 0.62 to 1.01, (95% CI: 0.76 to 1.33)), PsA (from 0.68 to 1.06, (95% CI: 0.88 to 1.28)), SLE (from 1.52 to 1.98, (95% CI: 1.67 to 2.33)) and SSc (from 2.27 to 4.24, (95% CI: 3.19 to 5.63)). In both SLE and SSc mortality was increased in men than women and in patients younger than 50 years.

Conclusions: Survival rates over 5 years in inflammatory arthritis under treatment are currently becoming comparable (AS/PsA) or slightly higher (RA) than those of the general population. However, all-cause mortality is almost twofold and fourfold higher in SLE and SSc, respectively, being even higher for male and younger patients.

Keywords: ankylosing; arthritis; psoriatic; rheumatoid arthritis; spondylitis; systemic lupus erythematosus; systemic sclerosis.


Conflict of interest statement

Competing interests: None declared.

Figures

Figure 1
Figure 1
Kaplan-Meier survival curves for patients with rheumatoid arthritis (RA, N=42 735, panel 1), ankylosing spondylitis (AS, N=9707, panel 2), psoriatic arthritis (PSA, N=13 779, panel 3), systemic lupus erythematosus (SLE, N=10 440, panel 4), systemic sclerosis (SSC, N=2277, panel 5), and for age-matched and gender-matched individuals from the general population (1:5 exposed: unexposed ratio) included in our cohort between 1 January 2015 and 31 December 2019. Analysis time in months.
Figure 2
Figure 2
Kaplan-Meier survival curves for female (A) and male (B) patients with (1) rheumatoid arthritis (RA, N=33 641 females, N=9094 males), (2) ankylosing spondylitis (AS, N=4163 females, N=5544 males), (3) psoriatic arthritis (PSA, N=7565 females, N=6214 males), (4) systemic lupus erythematosus (SLE, N=9315 females, N=1125 males), (5)systemic sclerosis (SSC, N=1,998 females, N=279 males) and for age-matched and gender-matched individuals from the general population (1:5 exposed:unexposed ratio) included in our cohort between 1 January 2015 and 31 December 2019. Analysis time in months.
Figure 3
Figure 3
Kaplan-Meier survival curves for patients <50 years (A) and ≥50 years of age B) with (1) rheumatoid arthritis (RA, N=7099 <50 years, N=35 636 ≥50years), (2) ankylosing spondylitis (AS, N=5466 <50 years, N=4241 ≥50years), (3) psoriatic arthritis (PSA, N=5048 <50 years, N=8731 ≥50years), (4) systemic lupus erythematosus (SLE, N=4373 <50 years, N=6067 ≥50years), (5) systemic sclerosis (SSC, N=600 <50 years, N=1677 ≥50 years) and for age-matched and gender-matched individuals from the general population (1:5 exposed:unexposed ratio) included in our cohort between 1 January 2015 and 31 December 2019. Analysis time in months.

References

    1. Toledano E, Candelas G, Rosales Z, et al. . A meta-analysis of mortality in rheumatic diseases. Reumatol Clin 2012;8:334–41. 10.1016/j.reuma.2012.05.006 - DOI - PubMed
    1. Ziade N, El Khoury B, Zoghbi M, et al. . Prevalence and pattern of comorbidities in chronic rheumatic and musculoskeletal diseases: the COMORD study. Sci Rep 2020;10:7683. 10.1038/s41598-020-64732-8 - DOI - PMC - PubMed
    1. Colaco K, Widdifield J, Luo J, et al. . Trends in mortality and cause-specific mortality among patients with psoriasis and psoriatic arthritis in Ontario, Canada. J Am Acad Dermatol 2021;84:1302–9. 10.1016/j.jaad.2020.10.031 - DOI - PubMed
    1. Fragoulis GE, Chatziodionysiou K, Nikiphorou E, et al. . Damage Accrual in rheumatoid arthritis: evaluating the joint and beyond. Arthritis Rheumatol 2020;72:1967–70. 10.1002/art.41449 - DOI - PubMed
    1. Ogdie A, Haynes K, Troxel AB, et al. . Risk of mortality in patients with psoriatic arthritis, rheumatoid arthritis and psoriasis: a longitudinal cohort study. Ann Rheum Dis 2014;73:149–53. 10.1136/annrheumdis-2012-202424 - DOI - PMC - PubMed