. 2022 Jan;21(1):48-57.
doi: 10.1158/1535-7163.MCT-21-0098. Epub 2021 Nov 2.

Triple Targeting of Breast Tumors Driven by Hormonal Receptors and HER2

Affiliations

Triple Targeting of Breast Tumors Driven by Hormonal Receptors and HER2

Elena Shagisultanova et al. Mol Cancer Ther. 2022 Jan.

Abstract

Breast cancers that express hormonal receptors (HR) and HER2 display resistance to targeted therapy. Tumor-promotional signaling from the HER2 and estrogen receptor (ER) pathways converges at the cyclin D1 and cyclin-dependent kinases (CDK) 4 and 6 complex, which drives cell-cycle progression and development of therapeutic resistance. Therefore, we hypothesized that co-targeting of ER, HER2, and CDK4/6 may result in improved tumoricidal activity and suppress drug-resistant subclones that arise on therapy. We tested the activity of the triple targeted combination therapy with tucatinib (HER2 small-molecule inhibitor), palbociclib (CKD4/6 inhibitor), and fulvestrant (selective ER degrader) in HR+/HER2+ human breast tumor cell lines and xenograft models. In addition, we evaluated whether triple targeted combination prevents growth of tucatinib or palbociclib-resistant subclones in vitro and in vivo Triple targeted combination significantly reduced HR+/HER2+ tumor cell viability, clonogenic survival, and in vivo growth. Moreover, survival of HR+/HER2+ cells that were resistant to the third drug in the regimen was reduced by the other two drugs in combination. We propose that a targeted triple combination approach will be clinically effective in the treatment of otherwise drug-resistant tumors, inducing robust responses in patients.


Figures

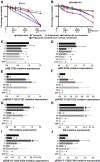
Figure 1. Activity of tucatinib, palbociclib, and fulvestrant in cancer cell lines. A–B, Triple combination improves suppression of tumor cell viability of (A) BT474 and (B) MDA-MB-361 cells. All cell line experiments were run in triplicate and repeated at least 3 times. Data are mean ± SEM. C–J, Signaling changes upon treatment with tucatinib (T), palbociclib (P), fulvestrant (F), or vehicle (V), treatment was conducted for 24 hours at the IC30 value: for MDA-MB-361, P = 1.9 μmol/L, F = 8.9 μmol/L, T = 0.05 μmol/L, for BT474, P = 1.5 μmol/L, F = 9.5 μmol/L, and T = 0.05 μmol/L. Average normalized expression via immunoblot of pRB S780 in (C) BT474 and (D) MDA-MB-361; pHER2 Y1221/1222 in (E) BT474 and (F) MDA-MB-361; ER in (G) BT474 and (H) MDA-MB-361; and pERK1/2 Y202/204 in (I) BT474 and (J) MDA-MB-361. Data are mean ±SD. Each western blot was done in triplicate and repeated with ≥2 sets of protein lysates. *, P ≤ 0.05 comparison between drug treatment and vehicle by the two-sided t test.
Figure 1.
Activity of tucatinib, palbociclib, and fulvestrant in cancer cell lines. A–B, Triple combination improves suppression of tumor cell viability of (A) BT474 and (B) MDA-MB-361 cells. All cell line experiments were run in triplicate and repeated at least 3 times. Data are mean ± SEM. C–J, Signaling changes upon treatment with tucatinib (T), palbociclib (P), fulvestrant (F), or vehicle (V), treatment was conducted for 24 hours at the IC30 value: for MDA-MB-361, P = 1.9 μmol/L, F = 8.9 μmol/L, T = 0.05 μmol/L, for BT474, P = 1.5 μmol/L, F = 9.5 μmol/L, and T = 0.05 μmol/L. Average normalized expression via immunoblot of pRB S780 in (C) BT474 and (D) MDA-MB-361; pHER2 Y1221/1222 in (E) BT474 and (F) MDA-MB-361; ER in (G) BT474 and (H) MDA-MB-361; and pERK1/2 Y202/204 in (I) BT474 and (J) MDA-MB-361. Data are mean ±SD. Each western blot was done in triplicate and repeated with ≥2 sets of protein lysates. *, P ≤ 0.05 comparison between drug treatment and vehicle by the two-sided t test.
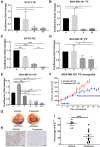
Figure 2. Triple combination therapy reduces HR+/HER2+ tumor growth in vivo. MDA-MB-361 xenografts (N = 10–12 tumors per group) and BT474 xenografts (N = 9–12 tumors per group) were treated with vehicle (V), tucatinib (T) or combinations of tucatinib, fulvestrant (F), and palbociclib (P). Results shown for MDA-MB-361 xenografts: A, Tumor growth curves; B, Tumor volumes at end of treatment (EOT); C, Representative tumors at study completion (scale bar, 5 mm); D, Tumor growth rates (TGR; change in tumor volume over time) for each treatment group; (E) Ki67 analysis and (F) Images of representative Ki67 staining (scale bar, 25 μm). Results of BT474 xenografts are shown: G, Tumor growth curves; H, BT474 tumor volumes at EOT; I, Representative tumors from each treatment group at study completion (scale bar, 5 mm); J, TGRs; K, Ki67 analysis and (L) Images of representative Ki67 staining scale bar, 25 μm. All data are mean ± SEM. For B, D, E, H, J, and K overall differences are significant with P < 0.0001 by ANOVA; *, P < 0.05; **, P < 0.01; ***, P < 0.005; and ****, P < 0.001 by the two-sided t test
Figure 2.
Triple combination therapy reduces HR+/HER2+ tumor growth in vivo. MDA-MB-361 xenografts (N = 10–12 tumors per group) and BT474 xenografts (N = 9–12 tumors per group) were treated with vehicle (V), tucatinib (T) or combinations of tucatinib, fulvestrant (F), and palbociclib (P). Results shown for MDA-MB-361 xenografts: A, Tumor growth curves; B, Tumor volumes at end of treatment (EOT); C, Representative tumors at study completion (scale bar, 5 mm); D, Tumor growth rates (TGR; change in tumor volume over time) for each treatment group; (E) Ki67 analysis and (F) Images of representative Ki67 staining (scale bar, 25 μm). Results of BT474 xenografts are shown: G, Tumor growth curves; H, BT474 tumor volumes at EOT; I, Representative tumors from each treatment group at study completion (scale bar, 5 mm); J, TGRs; K, Ki67 analysis and (L) Images of representative Ki67 staining scale bar, 25 μm. All data are mean ± SEM. For B, D, E, H, J, and K overall differences are significant with P < 0.0001 by ANOVA; *, P < 0.05; **, P < 0.01; ***, P < 0.005; and ****, P < 0.001 by the two-sided t test
Figure 3. HR+/HER2+ subclones resistant to tucatinib or palbociclib are sensitive to other agent in triple combination. Clonogenic survival of (A) BT474 and (B) MDA-MB-361 tucatinib-resistant (TR) subclones treated with vehicle (V), 0.67 μmol/L tucatinib (T), and/or 3 μmol/L palbociclib (P). Clonogenic survival of (C) BT474 and (D) MDA-MB-361 palbociclib-resistant (PR) subclones treated with vehicle, 10 μmol/L palbociclib, and 0.25 μmol/L (BT474) or 1.75 μmol/L (MDA-MB-361) tucatinib. E, Clonogenic survival of MDA-MB-361 PR subclones treated with vehicle, 5 μmol/L palbociclib, 1.5 μmol/L tucatinib, and/or 4 μmol/L fulvestrant (F). All clonogenic data are normalized to vehicle. All in vitro assays were replicated ≥3 times. Data are presented as mean ± SEM. F, Tumor growth curves of MDA-MB-361 TR tumors treated with vehicle or tucatinib. After tumor volumes reached 500 mm3, the tucatinib treatment group was switched to fulvestrant and palbociclib. N = 8–12 tumors per group. G, Representative tumors from vehicle and treatment groups at the end of the study. Dotted line represents length and width tumor volume measurements; scale bar, 1 cm. H, Representative Ki67 staining and (I) quantification; scale bar, 5 mm. *, P < 0.05; **, P <0.01; ***, P < 0.005; and****, P < 0.001 by ANOVA with Dunett multiple comparison test (A–E) or two-tailed t test (I).
Figure 3.
HR+/HER2+ subclones resistant to tucatinib or palbociclib are sensitive to other agent in triple combination. Clonogenic survival of (A) BT474 and (B) MDA-MB-361 tucatinib-resistant (TR) subclones treated with vehicle (V), 0.67 μmol/L tucatinib (T), and/or 3 μmol/L palbociclib (P). Clonogenic survival of (C) BT474 and (D) MDA-MB-361 palbociclib-resistant (PR) subclones treated with vehicle, 10 μmol/L palbociclib, and 0.25 μmol/L (BT474) or 1.75 μmol/L (MDA-MB-361) tucatinib. E, Clonogenic survival of MDA-MB-361 PR subclones treated with vehicle, 5 μmol/L palbociclib, 1.5 μmol/L tucatinib, and/or 4 μmol/L fulvestrant (F). All clonogenic data are normalized to vehicle. All in vitro assays were replicated ≥3 times. Data are presented as mean ± SEM. F, Tumor growth curves of MDA-MB-361 TR tumors treated with vehicle or tucatinib. After tumor volumes reached 500 mm3, the tucatinib treatment group was switched to fulvestrant and palbociclib. N = 8–12 tumors per group. G, Representative tumors from vehicle and treatment groups at the end of the study. Dotted line represents length and width tumor volume measurements; scale bar, 1 cm. H, Representative Ki67 staining and (I) quantification; scale bar, 5 mm. *, P < 0.05; **, P <0.01; ***, P < 0.005; and****, P < 0.001 by ANOVA with Dunett multiple comparison test (A–E) or two-tailed t test (I).
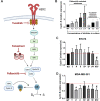
Figure 4. Cyclin E expression as potential drug resistance mechanism. A, ER, HER2, and CDK4/6 signaling diagram and targeted agents. Diagram was created with BioRender.com. B, Cyclin E expression increases in BT474 palbociclib and TR subclones. Cells were treated with drug concentrations increasing in a step-wise fashion. Palbociclib 1.3 represents 1–1.49 range, 1.8 represents 1.5–1.99 range, 2.3 represents 2–2.49 range, and 2.8 represents 2.5–2.99 range. C, Cyclin E expression in wild-type (WT) BT474 and (D) MDA-MB-361 after treatment with vehicle (V), tucatinib (T), palbociclib (P), fulvestrant (F) or combination of drugs. All experiements were performed in triplicate with ≥2 sets of protein lysates; data are mean ±SEM; #, P ≤ 0.05 compared with WT by a two-tailed t test.
Figure 4.
Cyclin E expression as potential drug resistance mechanism. A, ER, HER2, and CDK4/6 signaling diagram and targeted agents. Diagram was created with BioRender.com. B, Cyclin E expression increases in BT474 palbociclib and TR subclones. Cells were treated with drug concentrations increasing in a step-wise fashion. Palbociclib 1.3 represents 1–1.49 range, 1.8 represents 1.5–1.99 range, 2.3 represents 2–2.49 range, and 2.8 represents 2.5–2.99 range. C, Cyclin E expression in wild-type (WT) BT474 and (D) MDA-MB-361 after treatment with vehicle (V), tucatinib (T), palbociclib (P), fulvestrant (F) or combination of drugs. All experiements were performed in triplicate with ≥2 sets of protein lysates; data are mean ±SEM; #, P ≤ 0.05 compared with WT by a two-tailed t test.
Figure 5. HR+/HER2+ breast tumors are more prevalent among young women. The percentage of patients with HR+/HER2+ breast cancer reaches 20% among women ≤45 years old in (A) the University of Colorado Young Women's Breast Cancer (YWBC) Cohort and (B) The Cancer Genome Atlas. C, The percentage of patients with HR+/HER2+ breast cancer is 10% in all age patients in the US SEER Database.
Figure 5.
HR+/HER2+ breast tumors are more prevalent among young women. The percentage of patients with HR+/HER2+ breast cancer reaches 20% among women ≤45 years old in (A) the University of Colorado Young Women's Breast Cancer (YWBC) Cohort and (B) The Cancer Genome Atlas. C, The percentage of patients with HR+/HER2+ breast cancer is 10% in all age patients in the US SEER Database.

References

    1. Anders CK, Hsu DS, Broadwater G, Acharya CR, Foekens JA, Zhang Y, et al. . Young age at diagnosis correlates with worse prognosis and defines a subset of breast cancers with shared patterns of gene expression. J Clin Oncol 2008;26:3324–30. - PubMed
    1. Anders CK, Johnson R, Litton J, Phillips M, Bleyer A. Breast cancer before age 40 years. Semin Oncol 2009;36:237–49. - PMC - PubMed
    1. Bendell JC, Domchek SM, Burstein HJ, Harris L, Younger J, Kuter I, et al. . Central nervous system metastases in women who receive trastuzumab-based therapy for metastatic breast carcinoma. Cancer 2003;97:2972–7. - PubMed
    1. Arpino G, Gutierrez C, Weiss H, Rimawi M, Massarweh S, Bharwani L, et al. . Treatment of human epidermal growth factor receptor 2-overexpressing breast cancer xenografts with multiagent HER-targeted therapy. J Natl Cancer Inst 2007;99:694–705. - PubMed
    1. Kaufman B, Mackey JR, Clemens MR, Bapsy PP, Vaid A, Wardley A, et al. . Trastuzumab plus anastrozole versus anastrozole alone for the treatment of postmenopausal women with human epidermal growth factor receptor 2-positive, hormone receptor-positive metastatic breast cancer: results from the randomized phase III TAnDEM study. J Clin Oncol 2009;27:5529–37. - PubMed

Publication types

Substances