. 2021 Nov 2;12(1):6298.
doi: 10.1038/s41467-021-26447-w.

Extracellular LGALS3BP regulates neural progenitor position and relates to human cortical complexity

Affiliations

Extracellular LGALS3BP regulates neural progenitor position and relates to human cortical complexity

Christina Kyrousi et al. Nat Commun. .

Abstract

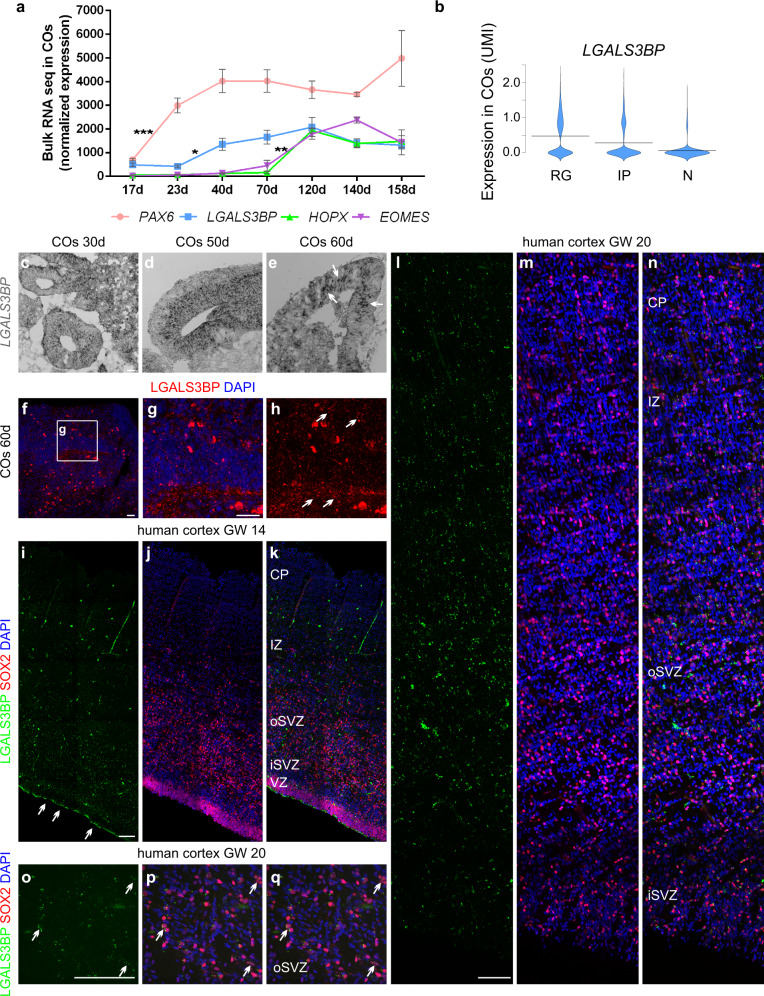
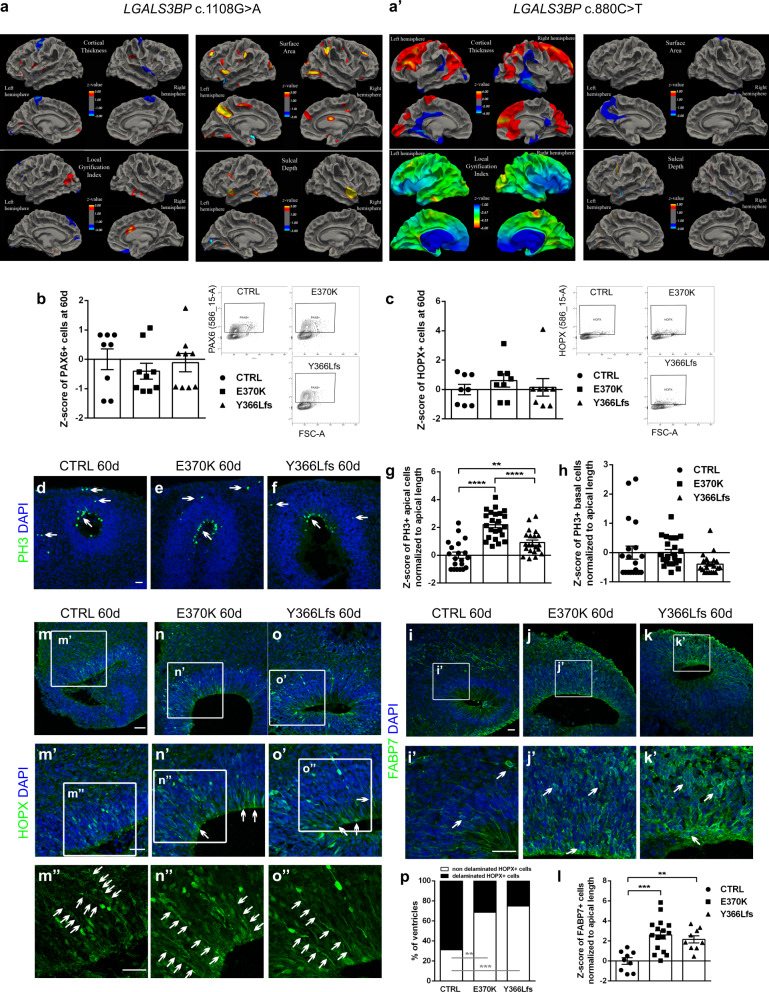
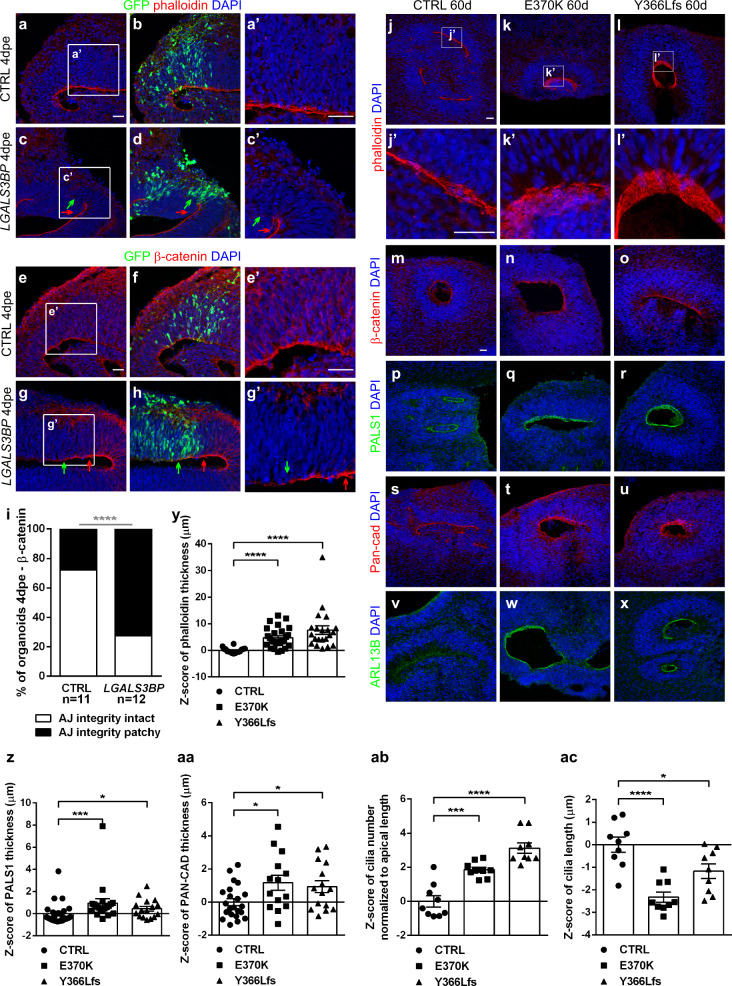
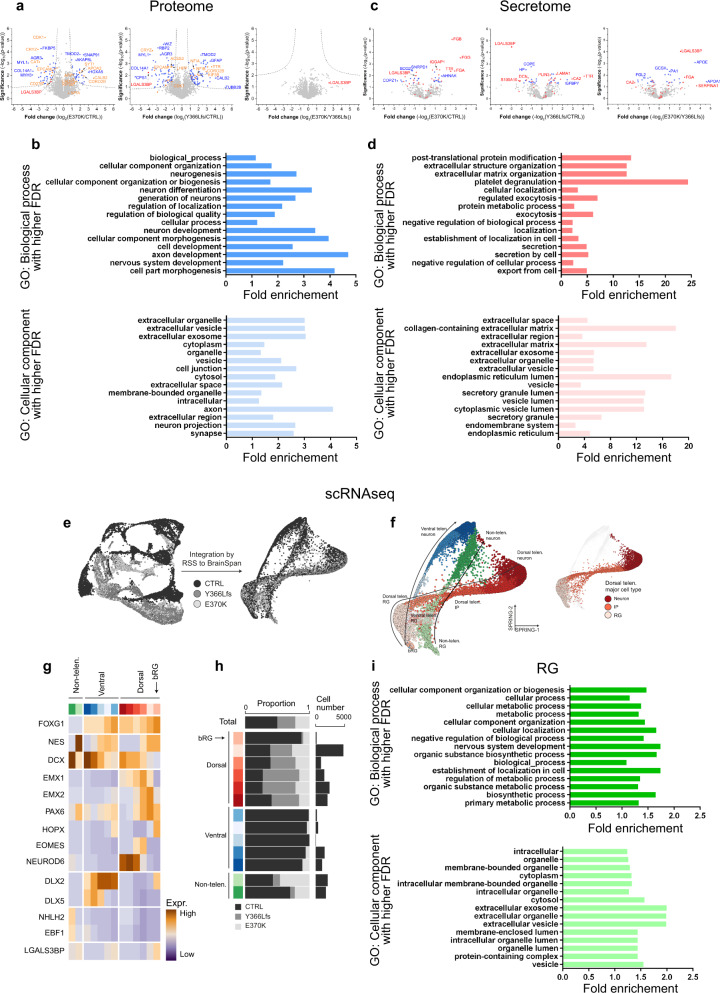
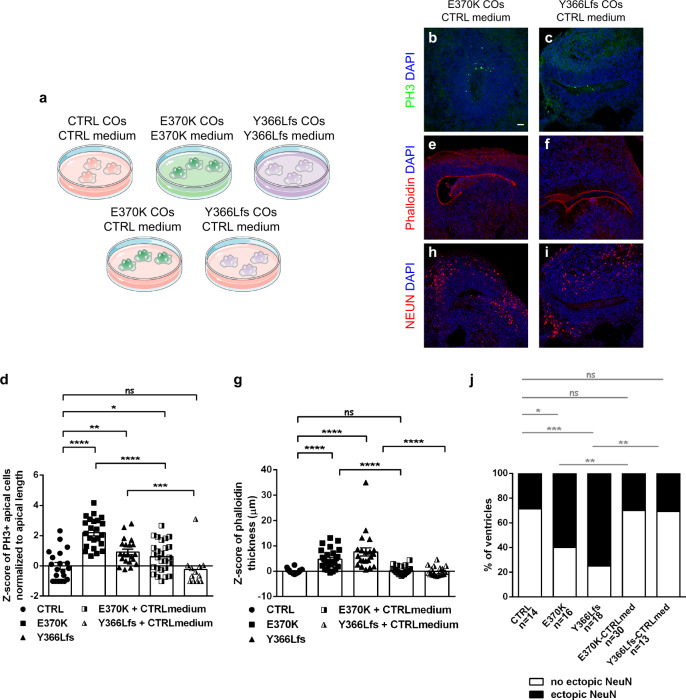
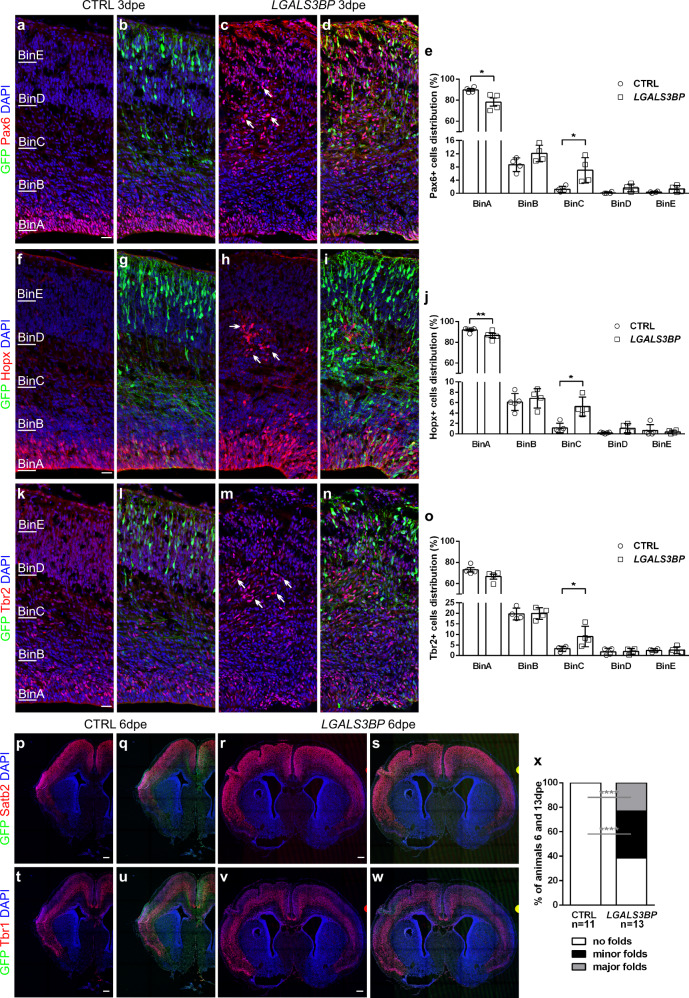
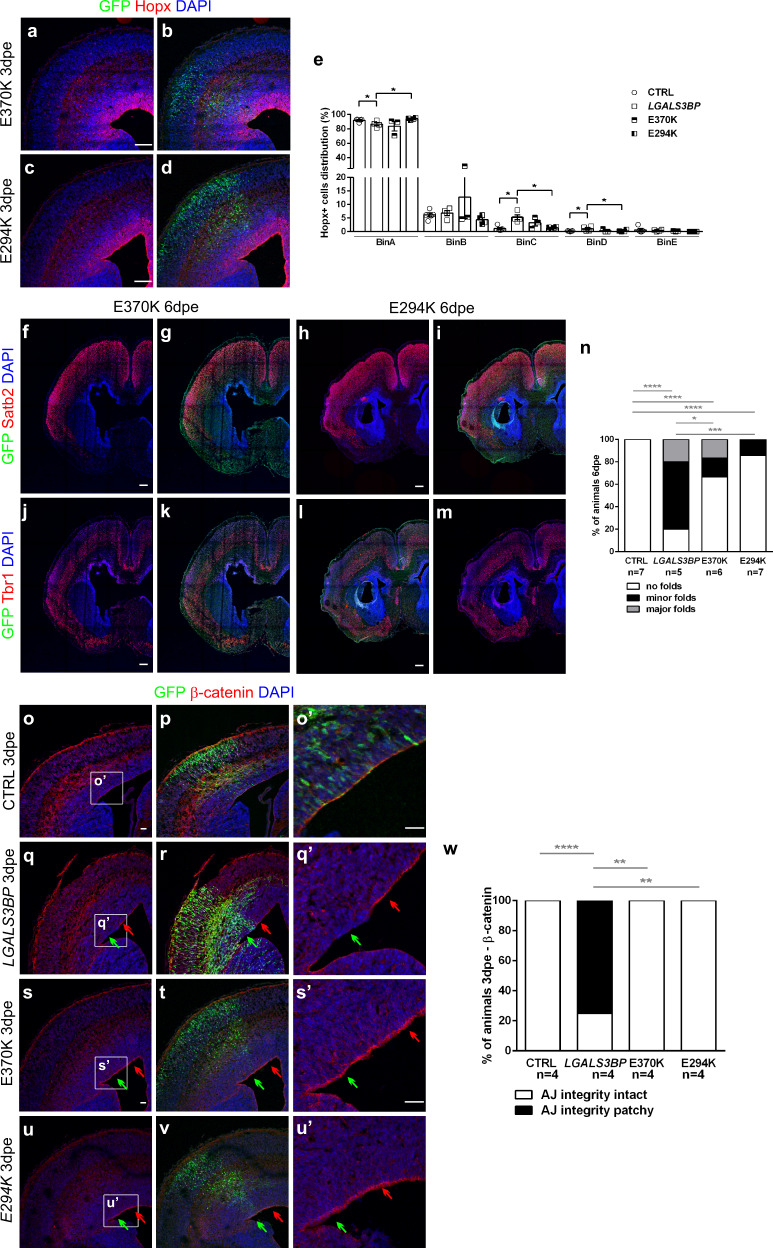
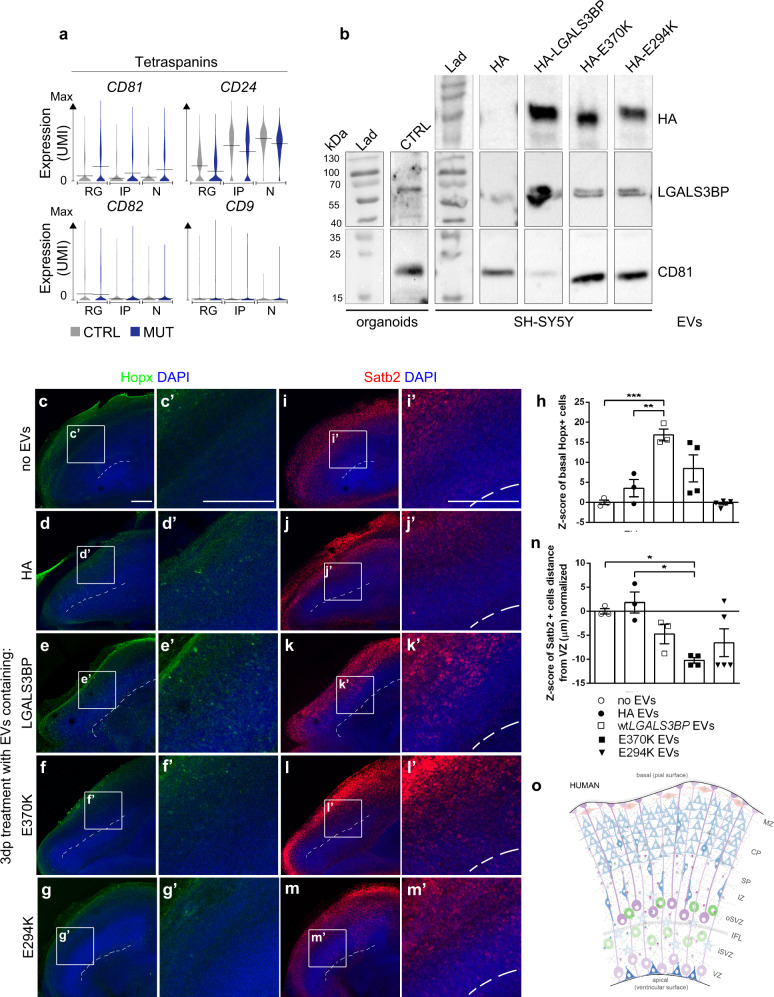
Basal progenitors (BPs), including intermediate progenitors and basal radial glia, are generated from apical radial glia and are enriched in gyrencephalic species like humans, contributing to neuronal expansion. Shortly after generation, BPs delaminate towards the subventricular zone, where they further proliferate before differentiation. Gene expression alterations involved in BP delamination and function in humans are poorly understood. Here, we study the role of LGALS3BP, so far known as a cancer biomarker, which is a secreted protein enriched in human neural progenitors (NPCs). We show that individuals with LGALS3BP de novo variants exhibit altered local gyrification, sulcal depth, surface area and thickness in their cortex. Additionally, using cerebral organoids, human fetal tissues and mice, we show that LGALS3BP regulates the position of NPCs. Single-cell RNA-sequencing and proteomics reveal that LGALS3BP-mediated mechanisms involve the extracellular matrix in NPCs' anchoring and migration within the human brain. We propose that its temporal expression influences NPCs' delamination, corticogenesis and gyrification extrinsically.


Conflict of interest statement

The authors declare no competing interests.

Figures

Fig. 1
Fig. 1. LGALS3BP expression in human cortical progenitors.
a Bulk RNA-sequencing data performed in COs at different stages. LGALS3BP has a peak of expression after apical progenitor marker PAX6 and prior to basal progenitor markers EOMES and HOPX. Data are shown as mean ± SEM, batches = 3, organoids = 3. Statistical analysis was performed using two-way ANOVA followed by Tukey’s multiple comparison test, *p < 0.05, **p < 0.01, ****p < 0.0001. In (a), p = 0.0026 in ctrlvsY366Lfs. b Violin plots from scRNA-seq data performed in 60d control COs showing LGALS3BP mRNA expression levels in RGs, IPs, and N, batches = 1, organoids = 2, cells = 9290. ce In situ hybridization depicting mRNA expression of LGALS3BP in 30d, 50d, and 60d control COs. Arrows show basally located LGALS3B+ cells, batches = 1, organoids = 3, ventricles = 3. fh Micrograph of control CO sections immunostained with specific LGALS3BP antibody. iq Micrograph of human fetal cortical sections immunostained as depicted in the panels at GW14 (ik) and 20 (lq). Arrows show LGALS3BP+ cells. Scale bar: 30 μm in (ch), 500 μm in (in), and 100 μm in (oq). See also Supplementary Fig. 1. Abbreviations: d: days, RG: radial glial cells, IP: intermediate progenitors, N: neurons, GW: gestational week, VZ: ventricular zone, iSVZ: inner subventricular zone, oSVZ: outer subventricular zone, IZ: intermediate zone, CP: cortical plate.
Fig. 2
Fig. 2. Genetic Variants within LGALS3BP in humans associated with cortical malformations.
a, a’ Morphometric analysis of the MRIs of individual 1 (a) and 2 (a’) showing changes in cortical thickness, local gyrification index, surface area and sulcal depth in different positions of the cortex. Statistical analysis of morphometric data was performed by a two-tailed paired t-test which compares each individual with a template obtained by averaging 8 age-matched controls. Cortical maps were clustered and corrected for multiple comparisons. b, c FACS plots and respective quantification depicting the sorting of PAX6+ (b) or HOPX+ (c) cells in 60d old control, E370K, and Y366Lfs mutant COs. The total proportion of the apical and basal progenitor cells is not changed in mutant COs. Data are shown as Z-scores ±SEM, batches = 2, organoids = 9. df, ik’, mo” Micrographs of sections of 60d control, E370K, and Y366Lfs mutant COs immunostained for PH3 (df), FABP7 (ik’) or HOPX (mo”). Arrows indicate the PH3+, FAPB7+, or HOPX+ cells which retain the apical contact with the ventricular zone. The apical and basal processes of the HOPX+ cells as indicated by the staining (arrows along the length of the processes) show the cells which should typically lose their apical processes, they tend to retain them and keep the attachment to the apical membrane in the mutant COs. g, h, l Quantification of the apically (g) or basally (h) located PH3+ cells and the number of FABP7+ cells within the VZ normalized to the apical membrane length (l) are shown as Z-scores ±SEM. Statistical significance was based on two-sided Mann-Whitney U test **p < 0.01, ***p < 0.001, ****p < 0.0001, batches = 2, organoids = 6, ventricles = 20. In (g), p = 0.0026 in ctrlvsY366Lfs. In (l), p = 0.0005 in ctrlvsE370K, p = 0.0012 in ctrlvsY366Lfs. p Quantification of the percentage of ventricles having non-delaminated HOPX+ cells. Statistical analysis was based on one-tailed exact binomial test **p < 0.01, ***p < 0.001, batches = 2, organoids = 6, ventricles = 15. In (p), p = 0.0023 in ctrlvsE370K, p = 0.0004 in ctrlvsY366Lfs. Scale bar: 30 μm. See also Supplementary Fig. 2. Abbreviations: CTRL: control, d: days.
Fig. 3
Fig. 3. LGALS3BP controls apical anchoring of human progenitor cells.
ah Micrographs of sections of control COs immunostained as indicated in the panels after electroporation of control or LGALS3BP at day 40 and analyzed 4dpe and immunostained as indicated in the panels (phalloidin in (ad), β-catenin in (eh)). Green arrows depict the electroporated area and red arrows the adjacent area. White boxes indicate the area which is zoomed-in in corresponding pictures. jx Micrographs of sections of day 60 control, E370K, and Y366Lfs mutant COs immunostained as indicated in the panels (phalloidin in (jl’), β-catenin in (mo), Pals1 in (pr), Pan-cad in (su), Arl13b in (vx)). White boxes indicate the area which is zoomed in in corresponding pictures. i Quantification of the percentage of COs with intact or patchy apical junction upon overexpression of LGALS3BP depicted in (ag’). Data were statistically analyzed with one-tailed exact binomial test, ****p < 0.0001, batches = 2, organoids = 6, ventricles = 12. yac Quantification of the phalloidin (y), PALS1 (z) or PAN-CAD (aa) thickness depicted in (ju) and cilia number (ab) and length (ac) depicted in (vx). Data in (zac) are shown as Z-scores ±SEM, statistical significance was based on the two-tailed Mann-Whitney U test *p < 0.05, ***p < 0.001, ****p < 0.0001, batches = 2, organoids = 6, ventricles=12. In (z), p = 0.0003 in ctrlvsE370K, p = 0.0184 in ctrlvsY366Lfs. In (aa), p = 0.0271 in ctrlvsE370K, p = 0.0302 in ctrlvsY366Lfs. In (ac), p = 0.0012 in ctrlvsE370K. Scale bar: 30 μm. See also Supplementary Fig. 3. Abbreviations: CTRL: control, dpe: days post electroporation, d: days, PAN-CAD: PAN-CADHERIN.
Fig. 4
Fig. 4. Proteomics, secretomics, and scRNA sequencing reveal altered signatures of the mutant cells in COs and cell non-autonomous effect of LGALS3BP function.
a, c Volcano plots illustrating the fold change of protein expression in the whole proteome (a) and in secretome (c) analysis in control or mutant COs at 60d. b, d GO Term analysis on the differentially regulated protein in the proteome (b) or secretome (d) of control or mutant COs plotted with reverse FDR and their fold enrichment. Data revealed higher enrichment of proteins with functions that are highly relevant to cortical development such as neurogenesis, cell-substrate adhesion, extracellular matrix organization, and secretions via vesicles like exosomes. e UMAP embedding of 10X genomics-based scRNA-seq data generated for 2 CTRL (9290 single cells), 2 Y366Lfs (5199 single cells), and 2 E370K (4095 single cells) COs prior to data integration (left) and SPRING embedding of the data upon RSS integration (right). f Cell type annotation of organoid scRNA-seq data visualized in the integrated SPRING embedding (see panel e). Three major progenitor-to-neuron trajectories can be seen for the dorsal telencephalon (shades of red), the ventral telencephalon (shades of blue), and non-telencephalic cells (shades of green). g Heatmap showing the expression of genes used to define the different cell types found in COs. The sidebar on the left denotes the cell states along the three main developmental trajectories (dorsal telencephalon, red; ventral telencephalon, blue; non-telencephalic cells, green). h Barplots summarizing the relative proportion of cells for each of the three conditions (left), as well as the total number of cells (right) detected for each cell state. i GO Term analysis on the differentially regulated genes in the RG population as where identified form scRNA-seq analysis form control and mutant COs plotted with reverse FDR and their fold enrichment. Data revealed higher enrichment of genes with cellular functions involved in extracellular exosomes, extracellular organelle and extracellular vesicles. See also Supplementary Fig. 4. Abbreviations: CTRL: control, GO: gene ontology, FDR: false discovery rate, RG: radial glial cells, bRG: basal radial glial cells, IP: intermediate progenitor, Telen.: telencephalon, Non-telen.: non-telencephalic, Expr.: expression.
Fig. 5
Fig. 5. Proper protein secretion mediates LGALS3BP function.
a Scheme showing the experimental procedure of the switch medium experiment in COs. b, c, e, f, h, i Micrographs of sections of E370K or Y366Lfs COs treated with control condition medium and immunostained as depicted in the panels. d, g Quantification of the percentage of organoids with apically dividing PH3+ cells (d) or the phalloidin thickness of COs upon incubation of control, E370K, or Y366Lfs mutant COs with CTRL, E370K, or Y366Lfs medium as indicated in the panels. Data are shown as Z-scores ±SEM, statistical significance was based on two-tailed Mann-Whitney U test *p < 0.05, **p < 0.01, ***p < 0.001, ****p < 0.0001, batches = 1, organoids = 9, ventricles = 16. In (d), p = 0.0026 in ctrlvsY366Lfs, p = 0.0357 in ctrlvsE370K+ctrlmedium, p = 0.0002 in Y366LfsvsY366Lfs+ctrlmedium. In (g), p = 0.0010 in ctrlvsY366Lfs, p = 0.0384 in ctrlvsE370K+ctrlmedium. j Quantification of the percentage of organoids with ectopic neurons upon incubation of control, E370K, or Y366Lfs mutant COs with CTRL, E370K, or Y366Lfs medium as indicated in the panels. Data are shown in percentages, statistical significance was based on one-tailed exact binomial test *p < 0.05, **p < 0.01, ***p < 0.001, batches = 1, organoids = 9, ventricles = 16. In (j), p = 0.0376 in ctrlvsE370K, p = 0.0002 in ctrlvsY366Lfs, p = 0.0012 in E370KvsE370K+ctrlmed, p = 0.0010 in Y366LfsvsY366Lfs+ctrlmed. Scale bar: 30 μm. See also Supplementary Fig. 5. Abbreviations: CTRL: control.
Fig. 6
Fig. 6. Overexpression of LGALS3BP in mouse brain results in changes in the progenitors’ position and folded cortex.
ad, fi, kn Micrographs of sections of mice immunostained as depicted in the panels after electroporation of control or LGALS3BP at embryonic day 13 and analyzed 3dpe. e, j, o Quantification of the distribution of the Pax6+, Hopx+ or Tbr2+ cells in the developing cortex. Data are shown mean ± SEM. Statistical significance was based on two-tailed Mann-Whitney U test *p < 0.05, **p < 0.01, n = 4 independently processed animals. In (e), p = 0.0286 in ctrlvsLGALS3BP in BinA, p = 0.0286 in ctrlvsLGALS3BP in BinC. In (j), p = 0.0031 in ctrlvsLGALS3BP in BinA, p = 0.0159 in ctrlvsLGALS3BP in BinC. In (o), p = 0.0286 in ctrlvsLGALS3BP in BinC. pw Micrographs of sections of mice immunostained as depicted in the panels after electroporation of control or LGALS3BP at embryonic day 13 and analyzed 6dpe. LGALS3BP overexpression resulted in the formation of fold-like structures, which include deep (Tbr1) and upper (Satb2) layer neurons. x Quantification of the percentage of animals that had no folds (white), minor folds (black) or major folds (gray). Statistical significance was based on one-tailed exact binomial test **p < 0.01 ****p < 0.0001. Scale bar: 30 μm in (ad, fi, kn), 200 μm in (pw). See also Supplementary Fig. 6. Abbreviations: CTRL: control, dpe: days post electroporation.
Fig. 7
Fig. 7. Overexpression of the LGALS3BP variants in the mouse brain only partially recapitulates the phenotype.
ad Micrographs of sections of mice immunostained for Hopx after electroporation of the E370K or the E294K variants of LGALS3BP at embryonic day 13 and analyzed 3dpe. e Quantification of the distribution of the Hopx+ cells in the developing cortex. Data are shown as mean ± SEM. Statistical significance was based on the two-tailed Mann-Whitney U test *p < 0.05, n = 5 ctrl, 4 LGALS3BP, 3 E370K, 4 E294K independently processed animals. In (e), p = 0.0317 in ctrlvsLGALS3BP in BinA, p = 0.0286 in LGALS3BPvsE394K in BinA, p = 0.0159 in ctrlvsLGALS3BP in BinC, p = 0.0286 in LGALS3BPvsE394K in BinC. fm Micrographs of sections of mice immunostained as depicted in the panels after electroporation of the E370K or the E294K variants of LGALS3BP at embryonic day 13 and analyzed 6dpe. Overexpression of the LGALS3BP variants cannot fully recapitulate the formation of fold-like structures, which the wt form of LGALS3BP generates. n Quantification of the percentage of animals that had no folds (white), minor folds (black) or major folds (gray). ov Micrographs of sections of mice immunostained as indicated in the panels after electroporation of control (o, p), LGALS3BP (q, r), or the two LGAS3BP variants (sv) at embryonic day 13 and analyzed 3dpe. Green arrows depict the electroporated area and red arrows the adjacent area. w Quantification of the percentage of mice with intact or patchy apical junction upon overexpression of the different forms of LGALS3BP. Statistical significance was based on the one-tailed exact binomial test, *p < 0.05, ***p < 0.001. In (n), p = 0.0170 in LGALS3BPvsE370K, p = 0.0004 in LGALS3BPvsE294K. In (w), p = 0.0039 in LGALS3BPvsE370K, p = 0.0039 in LGALS3BPvsE294K. Scale bar: 30 μm in (ad), 200 μm in (hm, ou’). See also Supplementary Fig. 7. Abbreviations: CTRL: control, dpe: days post electroporation, LFQ: labeled free quantification.
Fig. 8
Fig. 8. LGALS3BP function is mediated by EVs.
a Violin plots showing the distribution of gene expression, which are up- or downregulated in mutant cells in scRNA-seq analysis. b Western blot analysis for the expression levels of HA, LGALS3BP, or CD81 antibodies performed in protein extracts isolated from EVs derived from control COs or SH-SY5Y cells upon electroporation of HA, HA-LGALS3BP, HA-E370K, or HA-E294K batches = 2, organoids = 6, cell batches = 3. Source data are provided as a Source Data file. cm’ Immunostaining as indicated in the panels of non-treated control mice sections or after incubation with SH-SY5Y-derived EVs overexpressing HA, HA-LGALS3BP, HA-E370K, or HA-E294K at embryonic day 13 and analyzed 3dpe. h, n Quantification of the percentage of basal Hopx+ cells (h) or the distance from the ventricular surface where the first neuronal positive cells are found (n) after treatment of control mouse sections with EVs overexpressing HA, HA-LGALS3BP, HA-E370K, or HA-E294K. Data are shown as Z-scores ±SEM. Statistical significance was based on one-way ANOVA and Turkey’s multiple comparison test *p < 0.05, **p < 0.01, ***p < 0.001, n = 3 mice in no EVs, HA EVs, wt-LGALS3BP EVs, n = 4 mice in E370K EVs, n = 5 mice in E294K EVs. In (h), p = 0.0002. In (n), p = 0.0142. Scale bar: 200 μm. o Summary scheme showing that LGALS3BP is secreted via EVs protein, which upon secretion modulates the extracellular space and promotes changes in the distribution of the apical and basal progenitor cells which in turn regulates proper cortical development. Abbreviations: CTRL: control, MUT: mutant, UMI: Unique molecular identifiers, MAX: maximum, kDa: kilo Dalton, Lad: ladder, dpe: days post electroporation, EVs: extracellular vesicles.

References

    1. Götz M, Huttner WB. The cell biology of neurogenesis. Nat. Rev. Mol. Cell Biol. 2005;6:777–788. doi: 10.1038/nrm1739. - DOI - PubMed
    1. Borrell V, Reillo I. Emerging roles of neural stem cells in cerebral cortex development and evolution. Dev. Neurobiol. 2012;72:955–971. doi: 10.1002/dneu.22013. - DOI - PubMed
    1. Betizeau M, et al. Precursor diversity and complexity of lineage relationships in the outer subventricular zone of the primate. Neuron. 2013;80:442–457. doi: 10.1016/j.neuron.2013.09.032. - DOI - PubMed
    1. Lui JH, Hansen DV, Kriegstein AR. Development and evolution of the human neocortex. Cell. 2011;146:18–36. doi: 10.1016/j.cell.2011.06.030. - DOI - PMC - PubMed
    1. Lewitus E, Kelava I, Kalinka AT, Tomancak P, Huttner WB. An adaptive threshold in mammalian neocortical evolution. PLoS Biol. 2014;12:e1002000. doi: 10.1371/journal.pbio.1002000. - DOI - PMC - PubMed

Publication types

MeSH terms