. 2021 Nov 2;11(1):21473.
doi: 10.1038/s41598-021-00335-1.

Hypoxia induces stress fiber formation in adipocytes in the early stage of obesity

Affiliations

Hypoxia induces stress fiber formation in adipocytes in the early stage of obesity

Golnaz Anvari et al. Sci Rep. .

Abstract

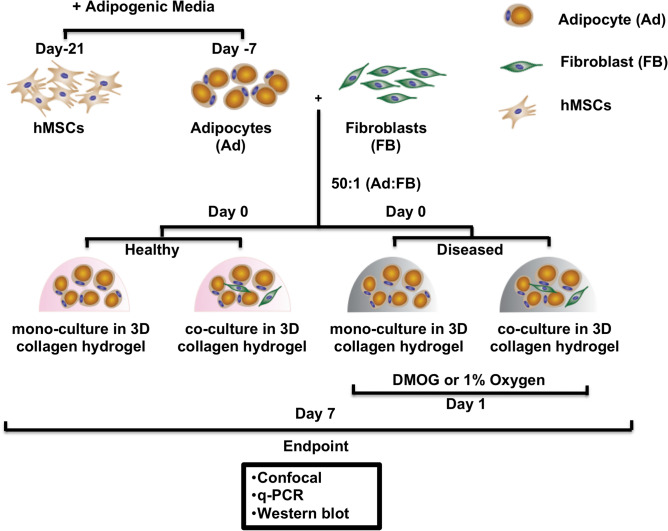
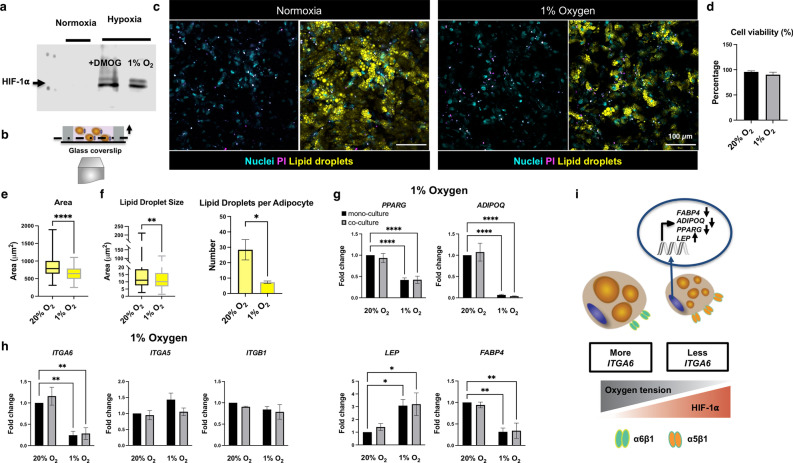
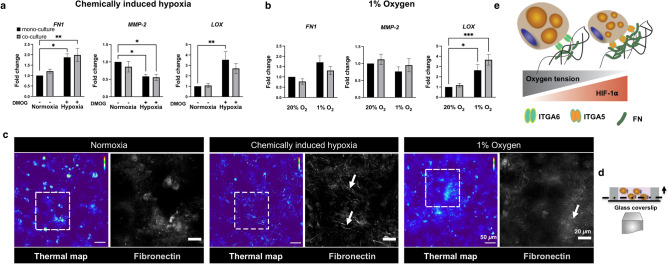
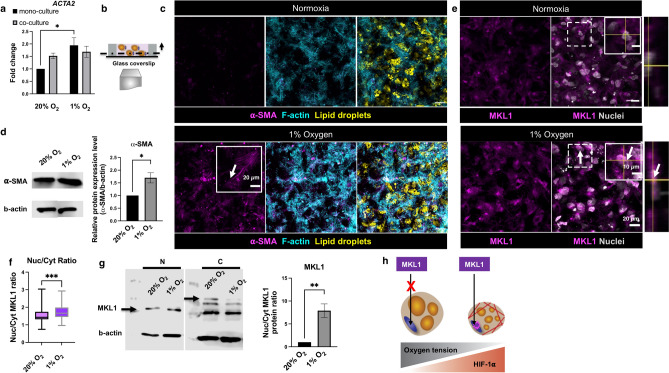
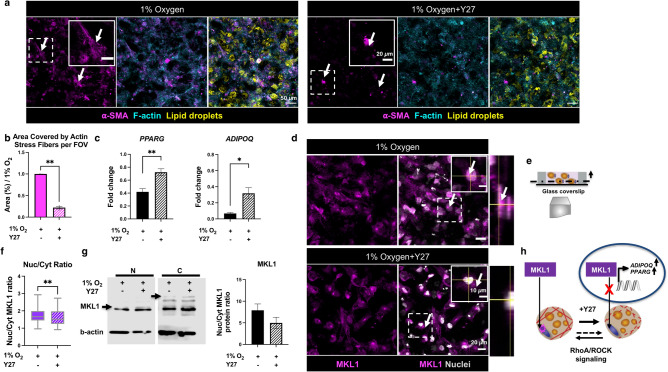
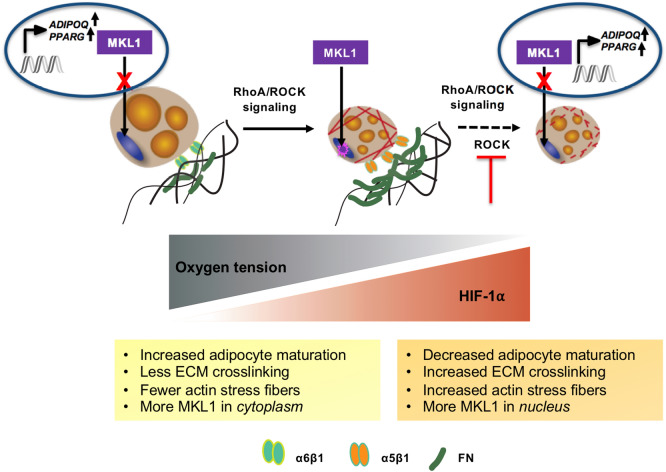
In obese adipose tissue (AT), hypertrophic expansion of adipocytes is not matched by new vessel formation, leading to AT hypoxia. As a result, hypoxia inducible factor-1⍺ (HIF-1⍺) accumulates in adipocytes inducing a transcriptional program that upregulates profibrotic genes and biosynthetic enzymes such as lysyl oxidase (LOX) synthesis. This excess synthesis and crosslinking of extracellular matrix (ECM) components cause AT fibrosis. Although fibrosis is a hallmark of obese AT, the role of fibroblasts, cells known to regulate fibrosis in other fibrosis-prone tissues, is not well studied. Here we have developed an in vitro model of AT to study adipocyte-fibroblast crosstalk in a hypoxic environment. Further, this in vitro model was used to investigate the effect of hypoxia on adipocyte mechanical properties via ras homolog gene family member A (RhoA)/Rho-associated coiled-coil kinases (ROCK) signaling pathways. We confirmed that hypoxia creates a diseased phenotype by inhibiting adipocyte maturation and inducing actin stress fiber formation facilitated by myocardin-related transcription factor A (MRTF-A/MKL1) nuclear translocation. This work presents new potential therapeutic targets for obesity by improving adipocyte maturation and limiting mechanical stress in obese AT.


Conflict of interest statement

The authors declare no competing interests.

Figures

Figure 1
Figure 1
Experimental schematic and workflow. Human mesenchymal stem cells (hMSCs) were expanded in 2D until confluence. To differentiate to adipocytes, adipogenic induction media was added for 7 days. To prepare the 3D constructs, adipocytes were encapsulated in type 1 collagen hydrogels (2 mg/mL) alone or with fibroblasts in a 50:1 ratio with a final seeding density of 8 million/mL. The constructs were maintained in adipogenic maintenance media. Constructs were kept in normoxia to mimic healthy adipose tissue (AT) or in hypoxia to mimic the early stage of obesity. Hypoxia was chemically induced by 1 mM DMOG addition to the media or by culturing in 1% O2. After 7 days, AT constructs were sacrificed for endpoint analyses.
Figure 2
Figure 2
Hypoxia develops a diseased phenotype by inhibiting adipocyte maturation. (a) Hypoxia was confirmed by western blot, HIF-1⍺ was present in hypoxic conditions (cropped blot is shown for the mono-culture condition, full length blots are presented in Supplementary Fig. S1). (b) Cross-section of AT constructs, fluorescent confocal microscopy images were taken at least 20 µm above the glass coverslip. (c) Fluorescent confocal microscopy images of the mono-culture AT constructs in normoxia or 1% oxygen after 7 days stained for Propidium Iodide (PI) to quantify cell viability (scale bar-100 µm). (d) Hypoxia did not affect cell viability. (e) Adipocyte area was significantly decreased in 1% oxygen, data are presented for the mono-culture condition (n = 4 biological replicates, 14–20 cells per replicate). (f) Lipid droplet size and average lipid droplet number per adipocyte were significantly decreased in 1% oxygen, data are presented for the mono-culture condition (n = 3–4 biological replicates). (g) Adipocyte gene expression after 7 days, PPARG, ADIPOQ, and FABP4 were significantly downregulated, and LEP was significantly upregulated in 1% oxygen (n = 3–8 biological replicates). (h) ITGA6 was significantly downregulated in 1% oxygen (n = 4–8 biological replicates). (i) Hypoxia reduces hallmarks of adipocyte maturation through the downregulation of PPARG, ADIPOQ and FABP4 expression, increasing LEP expression and results in smaller and fewer lipid droplets. ITGA6 gene expression is significantly downregulated in less mature adipocytes. Data are presented as means ± SEM. Comparisons between groups and statistical analysis were performed using two-way ANOVA with Tukey post hoc test, unpaired t-test or Mann–Whitney test with two-tailed p-values (*p < 0.05, **p < 0.01, ****p < 0.0001).
Figure 3
Figure 3
Hypoxia increases fibronectin, FN, and crosslinking gene, LOX, expression and results in a distinct fibronectin matrix assembly. (a) FN and LOX are significantly upregulated, while MMP-2 is downregulated in the chemically induced hypoxia (n = 8 biological replicates). (b) LOX was significantly upregulated in 1% oxygen (n = 8 biological replicates). (c) Fluorescent confocal microscopy images of the mono-culture AT constructs in normoxic (thermal map on the left and magnified view of ROI on the right) or hypoxic conditions (thermal map on the left and magnified view of ROI on the right) after 7 days (arrows point to the fibrillar structure of fibronectin, scale bar-50 µm, magnified images-20 µm). (d) Cross-section of AT constructs, fluorescent confocal microscopy images were taken at least 20 µm above the glass coverslip. (e) Hypoxia increases FN and LOX expression, and remodels fibronectin matrix into a fibrillar structure. Data are presented as means ± SEM. Comparisons between groups and statistical analysis were performed using two-way ANOVA with Tukey post hoc test (*p < 0.05, **p < 0.01).
Figure 4
Figure 4
Hypoxia induces stress fiber formation through MKL1 nuclear translocation. (a) ACTA2 was significantly upregulated in hypoxia (n = 8 biological replicates). (b) Cross-section of AT constructs, fluorescent confocal microscopy images were taken at least 20 µm above the glass coverslip. (c) Fluorescent confocal microscopy images of the mono-culture AT constructs after 7 days in normoxia (top left panel) and 1% oxygen (bottom left panel), arrows point to ⍺-SMA signal and stress fiber morphology (scale bar-50 µm, insets-20 µm). (d) ⍺-SMA protein expression was significantly increased in 1% oxygen (data are presented for the mono-culture condition, cropped blot is shown, full length blot is presented in Supplementary Fig. S5). (e) Fluorescent confocal microscopy images of the mono-culture AT constructs and the orthogonal view in normoxia (top right panel) and 1% oxygen (bottom right panel), arrows point to MKL1 signal localization (scale bar- 20 µm, insets- 10 µm). (f) Nuclear to cytoplasmic ratio for MKL1 was significantly increased in 1% oxygen (n = 5 biological replicates, 20 cells per replicate). (g) MKL1 nuclear (N) to cytoplasmic (C) protein ratio was significantly increased in 1% oxygen, arrows point to the quantified MKL1 protein bands (data are presented for the mono-culture condition, n = 3 biological replicates, cropped blot is shown, full length blot is presented in Supplementary Fig. S6). (h) Hypoxia induces actin stress fiber formation via MKL1 nuclear translocation. Data are presented as means ± SEM. Comparisons between groups and statistical analysis were performed using two-way ANOVA with Tukey post hoc test or unpaired Mann–Whitney test with two-tailed p-values (*p < 0.05, **p < 0.01, ***p < 0.001).
Figure 5
Figure 5
Y27 treatment partly attenuates hypoxia effects by inhibiting MKL1 nuclear translocation. (a) Fluorescent confocal microscopy images of the mono-culture AT constructs after 7 days in 1% oxygen without (top left panel) and with (top right panel) Y27 treatment, arrows point to ⍺-SMA signal (scale bar-50 µm, insets-20 µm). (b) Actin stress fiber morphology was changed after Y27 treatment (n = 3 biological replicates). (c) Adipogenic (ADIPOQ, PPARG) genes were partly rescued towards a normoxic phenotype after Y27 treatment (n = 4–8 biological replicates, data are normalized to mono-culture samples maintained in 20% oxygen). (d) Fluorescent confocal microscopy images of the mono-culture AT constructs and the orthogonal view in 1% oxygen before and after Y27 treatment, arrows point to MKL1 signal localization (scale bar-20 µm, insets-10 µm). (e) Cross-section of AT constructs, fluorescent confocal microscopy images were taken at least 20 µm above the glass coverslip. (f) The nucleus to cytoplasm ratio for MKL1 was significantly decreased after Y27 treatment (n = 5 biological replicates, 20 cells per replicate). (g) MKL1 nuclear to cytoplasmic protein ratio in 1% oxygen and after Y27 treatment, arrows point to the quantified MKL1 protein bands (n = 3 biological replicates, cropped blot is shown, full length blot is presented in Supplementary Fig. S6). (h) Y27 treatment disrupts actin stress fibers due to MKL1 nuclear translocation inhibition, and this process is regulated via RhoA/ROCK signaling pathway. Data are presented as means ± SEM. Comparisons between groups and statistical analysis were performed using unpaired Mann–Whitney test with two-tailed p-values (*p < 0.05, **p < 0.01).
Figure 6
Figure 6
Summary overview. Hypoxia creates a diseased phenotype by (1) inhibiting adipocyte maturation via downregulating adipogenic (ADIPOQ, PPARG), and ITGA6 gene expression, and (2) inducing actin stress fiber formation through MKL1 translocation to the nucleus. MKL1 nuclear translocation is regulated via RhoA/ROCK signaling pathway and inhibiting ROCK attenuates hypoxia effects.

References

    1. Galic S, Oakhill JS, Steinberg GR. Adipose tissue as an endocrine organ. Mol. Cell. Endocrinol. 2010;316:129–139. doi: 10.1016/j.mce.2009.08.018. - DOI - PubMed
    1. Vázquez-Vela MEF, Torres N, Tovar AR. white adipose tissue as endocrine organ and its role in obesity. Arch. Med. Res. 2008;39:715–728. doi: 10.1016/j.arcmed.2008.09.005. - DOI - PubMed
    1. Kusminski CM, Bickel PE, Scherer PE. Targeting adipose tissue in the treatment of obesity-associated diabetes. Nat. Rev. Drug Discov. 2016;15:639–660. doi: 10.1038/nrd.2016.75. - DOI - PubMed
    1. Rosen ED, Spiegelman BM. What we talk about when we talk about fat. Cell. 2014;156:20–44. doi: 10.1016/j.cell.2013.12.012. - DOI - PMC - PubMed
    1. Sun K, Tordjman J, Clément K, Scherer PE. Fibrosis and adipose tissue dysfunction. Cell Metab. 2013;18:470–477. doi: 10.1016/j.cmet.2013.06.016. - DOI - PMC - PubMed

Publication types