Multicenter Study
. 2021 Nov 2;12(1):6311.
doi: 10.1038/s41467-021-26643-8.

Accurate recognition of colorectal cancer with semi-supervised deep learning on pathological images

Affiliations
Multicenter Study

Accurate recognition of colorectal cancer with semi-supervised deep learning on pathological images

Gang Yu et al. Nat Commun. .

Abstract

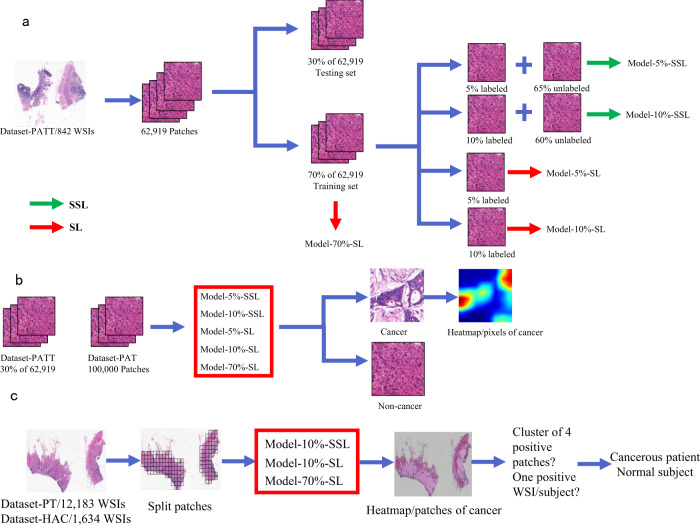
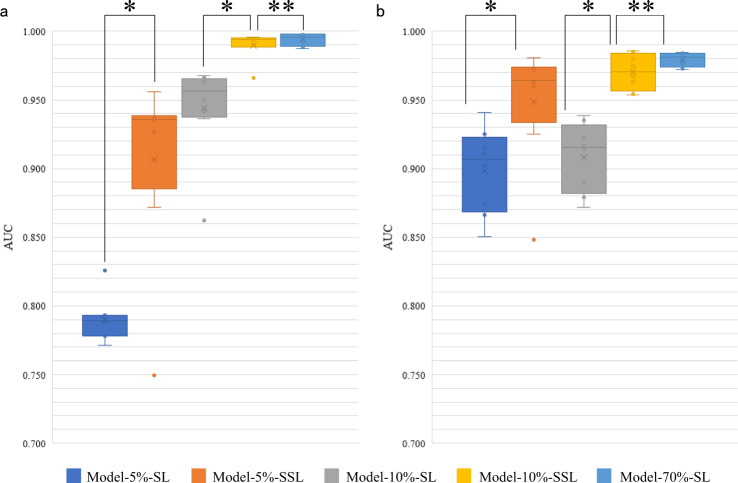
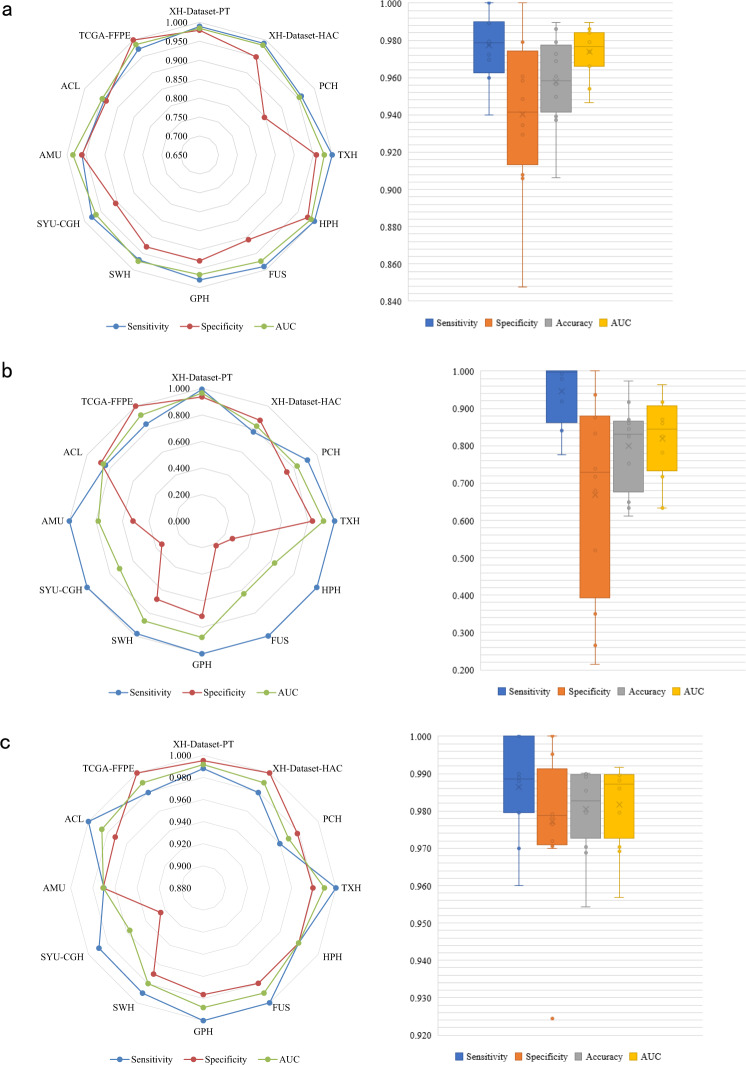
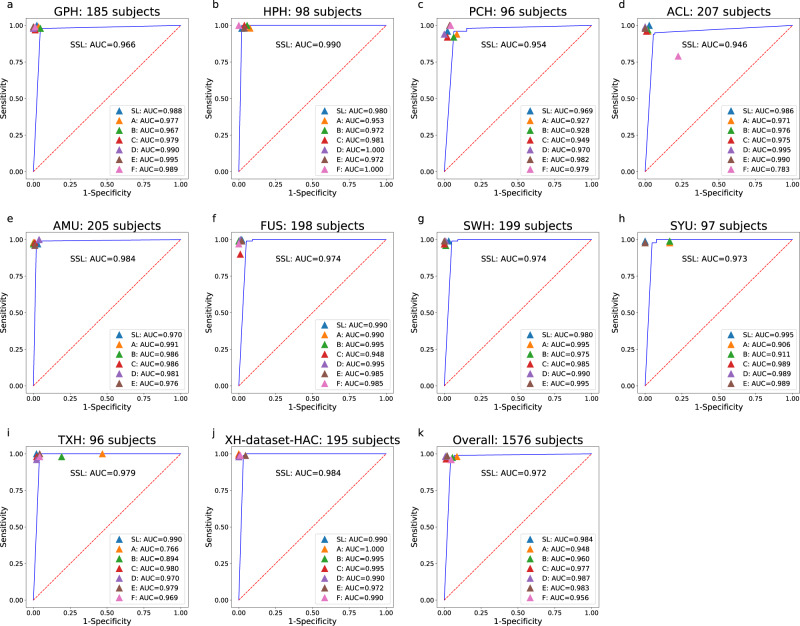
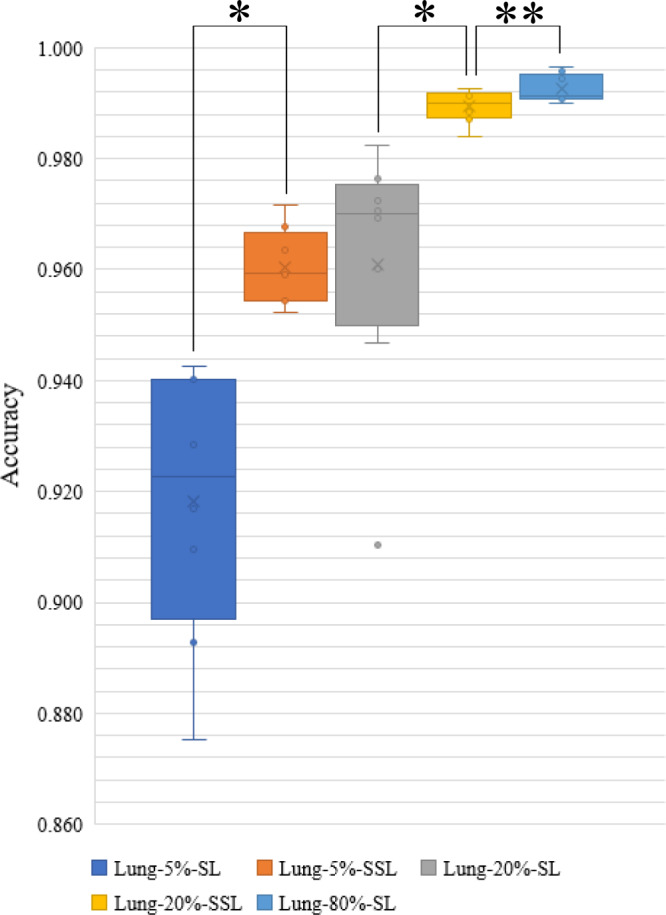
Machine-assisted pathological recognition has been focused on supervised learning (SL) that suffers from a significant annotation bottleneck. We propose a semi-supervised learning (SSL) method based on the mean teacher architecture using 13,111 whole slide images of colorectal cancer from 8803 subjects from 13 independent centers. SSL (~3150 labeled, ~40,950 unlabeled; ~6300 labeled, ~37,800 unlabeled patches) performs significantly better than the SL. No significant difference is found between SSL (~6300 labeled, ~37,800 unlabeled) and SL (~44,100 labeled) at patch-level diagnoses (area under the curve (AUC): 0.980 ± 0.014 vs. 0.987 ± 0.008, P value = 0.134) and patient-level diagnoses (AUC: 0.974 ± 0.013 vs. 0.980 ± 0.010, P value = 0.117), which is close to human pathologists (average AUC: 0.969). The evaluation on 15,000 lung and 294,912 lymph node images also confirm SSL can achieve similar performance as that of SL with massive annotations. SSL dramatically reduces the annotations, which has great potential to effectively build expert-level pathological artificial intelligence platforms in practice.


Conflict of interest statement

The authors declare no competing interests.

Figures

Fig. 1
Fig. 1. The flow chart of the colorectal cancer study.
a Semi-supervised learning (SSL) and supervised learning (SL) are performed on different labeled and unlabeled patches from 70% whole slide images (WSIs) of Dataset-PATT. Model-5%/10%-SSL and Model-5%/10%/70%-SL are obtained. b The patch-level test is performed on the patches from 30% WSIs of Dataset-PATT and whole data set of Dataset-PAT, and the above five models predict whether there is cancer or not in the patches. c The patient-level test and human-AI competition are performed on Dataset-PT and Dataset-HAC, respectively. Each WSI is divided into many patches, and three models infer whether these patches are cancerous or normal individually. The clustering-based method is then used on the WSI. If there is a cluster of four positive patches on a WSI, the WSI is positive. A subject with one or more positive WSIs is cancerous, or the subject is normal.
Fig. 2
Fig. 2. Area under the curve (AUC) distribution of five models at patch level.
The boxes indicate the upper and lower quartile values, and the whiskers indicate the minima and maxima values. The horizontal bar in the box indicates the median, while the cross indicates the mean. The circles represent data points, and the scatter dots indicate outliers. * indicates significant difference, and ** indicates no significant difference. a The evaluation of five models on the testing set of Dataset-PATT. Eight versions of each model (number of experiments per model = 8) are tested at their testing sets (number of samples/patches per testing set = ~18,819) independent from their training sets, respectively. The Wilcoxon-signed rank test is then used to evaluate the significant difference of AUCs (sample size/group = 8) between two models. Two-sided P values are reported, and no adjustment is made. The average AUC and standard deviation of Model-5%-SSL and Model-5%-SL: 0.906 ± 0.064 vs. 0.789 ± 0.016, P value = 0.017; Model-10%-SSL and Model-10%-SL: 0.990 ± 0.009 vs. 0.944 ± 0.032, P value = 0.012; Model-10%-SSL and Model-70%-SL: 0.990 ± 0.009 vs. 0.994 ± 0.004, P value = 0.327. b The evaluation of 8 versions of five models on the Dataset-PAT (number of samples/patches per testing set = 100,000). Wilcoxon-signed rank test (sample size/group = 8), and two-sided P values are reported. Model-5%-SSL and Model-5%-SL: 0.948 ± 0.041 vs. 0.898 ± 0.029, P values = 0.017; Model-10%-SSL and Model-10%-SL: 0.970 ± 0.012 vs. 0.908 ± 0.024, P value = 0.012; Model-10%-SSL and Model-70%-SL: 0.970 ± 0.012 vs. 0.979 ± 0.005, P values = 0.263. The AUC values of each model on Dataset-PATT and Dataset-PAT are combined and the Wilcoxon-signed rank test is performed on the combined results (sample size/group = 16), and two-sided P values are reported. Model-5%-SSL and Model-5%-SL: 0.927 ± 0.058 vs. 0.843 ± 0.059, P value = 0.002; Model-10%-SSL and Model-10%-SL: 0.980 ± 0.014 vs. 0.926 ± 0.034, P value = 0.0004; Model-10%-SSL and Model-70%-SL: 0.980 ± 0.014 vs. 0.987 ± 0.008, P value = 0.134.
Fig. 3
Fig. 3. The results of patient-level CRC recognition.
Patient-level comparison of a Model-10%-SSL, b Model-10%-SL, and c Model-70%-SL on 12 independent data sets from Dataset-PT. Left: Radar maps illustrate the sensitivity, specificity, and area under the curve (AUC) of three models on 12 centers. Right: Boxplots show the distribution of sensitivity, specificity, accuracy, and AUC of the three models in these centers. The boxes indicate the upper and lower quartile values, and the whiskers indicate the minima and maxima values. The horizontal bar in the box indicates the median, while the cross indicates the mean. The circles represent data points, and the scatter dots indicate outliers. The average AUC and standard deviation (sample size = 12) are calculated for each model, and the Wilcoxon-signed rank test (sample size/group = 12) is then used to evaluate the significant difference of AUCs between two models. Two-sided P values are reported, and no adjustment is made. Model-10%-SSL vs. Model-10%-SL: AUC: 0.974 ± 0.013 vs. 0.819 ± 0.104, P value = 0.002; Model-10%-SSL vs. Model-70%-SL: 0.974 ± 0.013 vs. 0.980 ± 0.010, P value = 0.117. The data points are listed in Supplementary Data 1.
Fig. 4
Fig. 4. The Human-AI CRC competition results.
Area under the curve (AUC) comparison of Model-10%-SSL(SSL), Model-70%-SL(SL) and six pathologists (af) using Dataset-HAC, which consists XH-dataset-HAC, PCH, TXH, HPH, ACL, FUS, GPH, SWH, AMU and SYU. Blue lines indicate the AUCs achieved by Model-10%-SSL. The F pathologist did not attend the competition of SYU, AMU, and SWH data set.
Fig. 5
Fig. 5. Accuracy distribution of five models on the testing set of LC25000 dataset (number of samples/patches per testing set = 3000; number of experiments per model = 8).
The boxes indicate the upper and lower quartile values, and the whiskers indicate the minima and maxima values. The horizontal bar in the box indicates the median, while the cross indicates the mean. The circles represent data points, and the scatter dots indicate outliers. * indicates significant difference, and ** indicates no significant difference. The Wilcoxon-signed rank test (sample size/group = 8) is then used to evaluate the significant difference in the accuracy between two models. Two-sided P values are reported, and no adjustment is made. The average AUC and standard deviation (sample size = 8) are calculated for each model. Lung-5%-SSL vs. Lung-5%-SL: 0.960 ± 0.006 vs. 0.918 ± 0.023, P value = 0.012; Lung-20%-SSL vs. Lung-20%-SL: 0.989 ± 0.003 vs. 0.961 ± 0.022, P value = 0.011; Lung-20%-SSL vs. Lung-80%-SL: 0.989 ± 0.003 vs. 0.993 ± 0.002, P value = 0.093.
Fig. 6
Fig. 6. Area under the curve (AUC) distribution of five models on the testing set of PatchCamelyon data set (number of samples/patches per testing set = 32,768; number of experiments per model = 8).
The boxes indicate the upper and lower quartile values, and the whiskers indicate the minima and maxima values. The horizontal bar in the box indicates the median, while the cross indicates the mean. The circles represent data points, and the scatter dots indicate outliers. * indicates significant difference, and ** indicates no significant difference. The Wilcoxon-signed rank test (sample size/group = 8) is then used to evaluate the significant difference of AUCs between the two models. Two-sided P values are reported, and no adjustment is made. The average AUC and standard deviation (sample size = 8) are calculated for each model. Pcam-1%-SSL vs. Pcam-1%-SL: 0.947 ± 0.008 vs. 0.912 ± 0.008, P value = 0.012; Pcam-5%-SSL vs. Pcam-5%-SL: 0.960 ± 0.002 vs. 0.943 ± 0.009, P value = 0.011; Pcam-5%-SSL vs. Pcam-100%-SL: 0.960 ± 0.002 vs. 0.961 ± 0.004, P value = 0.888.

References

    1. Arnold M, et al. Global patterns and trends in colorectal cancer incidence and mortality. Gut. 2017;66:683–691. doi: 10.1136/gutjnl-2015-310912. - DOI - PubMed
    1. Metter DM, et al. Trends in the US and Canadian pathologist workforces from 2007 to 2017. JAMA Netw. Open. 2019;2:e194337. doi: 10.1001/jamanetworkopen.2019.4337. - DOI - PMC - PubMed
    1. Damjanov I. Robbins review of pathology. Mod. Pathol. 2000;13:1028. doi: 10.1038/modpathol.3880185. - DOI
    1. Group CCW. Chinese Society of Clinical Oncology (CSCO) diagnosis and treatment guidelines for colorectal cancer 2018 (English version) Chin. J. Cancer Res. 2019;31:99–116. doi: 10.21147/j.issn.1000-9604.2019.01.06. - DOI - PMC - PubMed
    1. Sayed S, Lukande R, Fleming KA. Providing pathology support in low-income countries. Glob. Oncol. 2015;1:3–6. doi: 10.1200/JGO.2015.000943. - DOI - PMC - PubMed

Publication types

MeSH terms