. 2022 Mar;50(1):240-255.
doi: 10.1016/j.jce.2021.09.004. Epub 2021 Oct 11.

Shutdown policies and conflict worldwide

Affiliations

Shutdown policies and conflict worldwide

Nicolas Berman et al. J Comp Econ. 2022 Mar.

Abstract

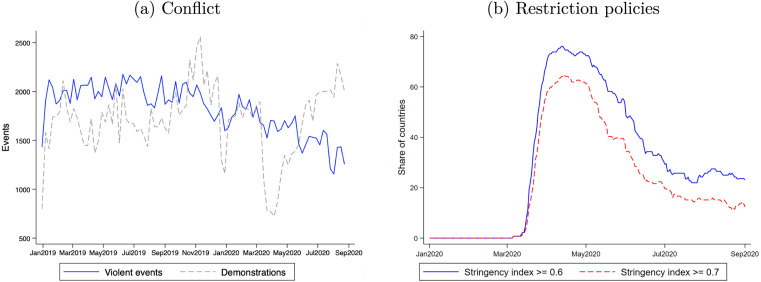
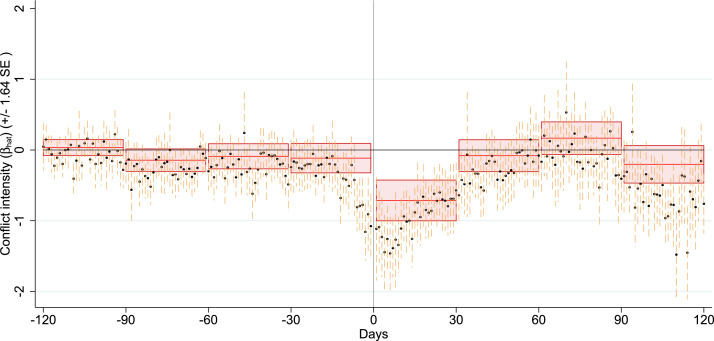
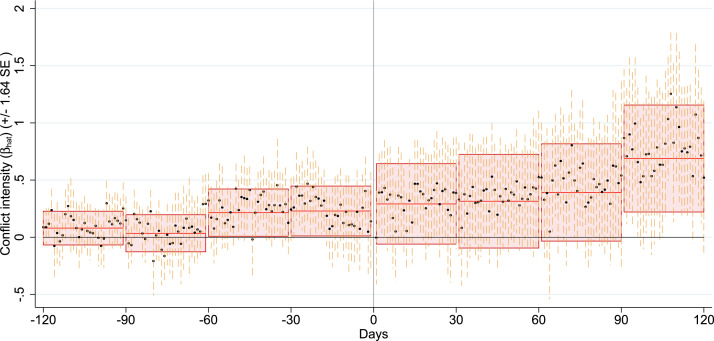
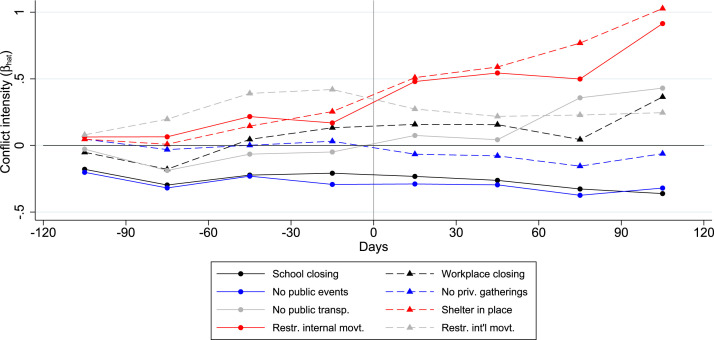
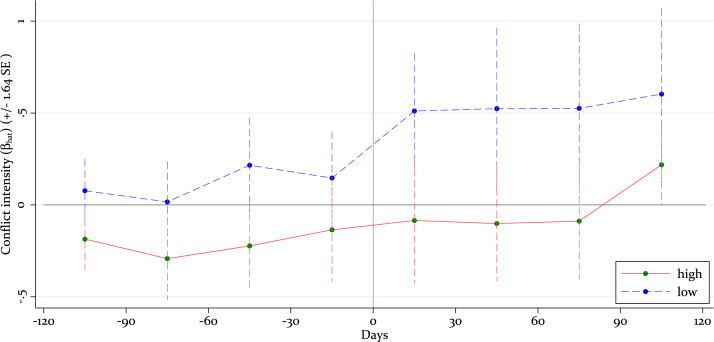
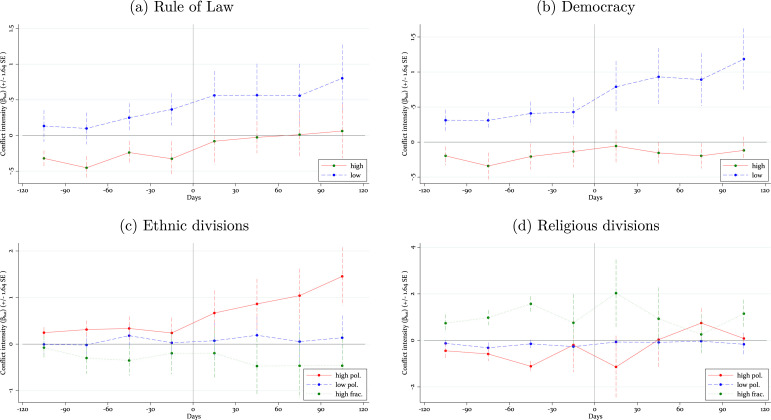
We provide evidence on the link between the policy response to the SARS CoV-2 pandemic and conflicts worldwide. We combine daily information on conflict events and government policy responses to limit the spread of SARS CoV-2 to study how demonstrations and violent events vary following shutdown policies. We use the staggered implementation of restriction policies across countries to identify the dynamic effects in an event study framework. Our results show that imposing a nation-wide shutdown is associated with a reduction in the number of demonstrations, which suggests that public demonstrations are hampered by the rising cost of participation. However, the reduction is short-lived, as the number of demonstrations are back to their pre-restriction levels in two months. In contrast, we observe that the purported increase in mobilization or coordination costs, following the imposition of restrictions, is not followed by a drop of violent events that involve organized armed groups. Instead, we find that the number of events, on average, increases slightly following the implementation of the restriction policies. The rise in violent events is most prominent in poorer countries, with higher levels of polarization, and in authoritarian countries. We discuss the potential channels underlying this heterogeneity.

Keywords: Conflict; Mobility; SARS CoV-2; Violence.


Figures

Fig. 1
Fig. 1
Conflict events and policy responses to the SARS CoV-2 pandemic.
Fig. 2
Fig. 2
Timing of Shutdown and Demonstrations. Note: This figure plots the coefficients βk of Eq. (2) when conflict represents the daily number of demonstrations in a country. Shutdowni,tk is an indicator that equals 1 since when the Stringency index is equal or above a cutoff of 0.6 (range between 0–1), in a given country. The points denote the daily estimates, with dotted lines representing 90% confidence intervals. The red boxes depict the monthly estimates and their confidence intervals. All specifications include an indicator variable that equals 1 if as of day t country i had confirmed the first SARS CoV-2 case tk days ago, year-month fixed-effects, country fixed-effects and country-specific linear time trends. Standard errors in parentheses are clustered at the country-level. Table A1.3 in the online appendix contains descriptive statistics about each variable used in the estimation.
Fig. 3
Fig. 3
Timing of Shutdown and Violent Events. Note: This figure plots the coefficients βk of Eq. (2) when conflict represents the daily number of violent events in a country. Shutdowni,tk is an indicator that equals 1 since when the Stringency index is equal or above a cutoff of 0.6 (range between 0–1), in a given country. The points denote the daily estimates, with dotted lines representing 90% confidence intervals. The red boxes depict the monthly estimates and their confidence intervals. All specifications include an indicator variable that equals 1 if as of day t country i had confirmed the first SARS CoV-2 case tk days ago, year-month fixed-effects, country fixed-effects and country-specific linear time trends. Standard errors in parentheses are clustered at the country-level. Table A1.3 in the online appendix contains descriptive statistics about each variable used in the estimation.
Fig. 4
Fig. 4
Conflict dynamics across specific restriction policies. Note: This figure plots the coefficients equivalent to βk from Eq. (2) – when conflict represents the daily number of violent events in a country – but estimated for each policy measure separately. We first estimate Eq. (2) using dummies for specific policies instead our shutdown index. The figure shows the average of the obtained coefficients, averaged by month for readability. All specifications include an indicator variable that equals 1 if as of day t country i had confirmed the first SARS CoV-2 case tk days ago, year-month fixed-effects, country fixed-effects and country-specific linear time trends. Standard errors in parentheses are clustered at the country-level. Table A1.3 in the online appendix contains descriptive statistics about each variable used in the estimation.
Fig. 5
Fig. 5
GDP per capita and violent events. Note: This figure plots the coefficients βkH (in red) and βkL (in blue) of Eq. (3) when conflict represents the daily number of violent events in a country. Shutdowni,tk is an indicator that equals 1 since when the Stringency index is equal or above a cutoff of 0.6 (range between 0–1), in a given country. The specification controls for time dummies interacted with high/low GDP per capita dummies (high CiH versus low CiL). The points denote the monthly estimates, with dotted lines representing 90% confidence intervals. The specification includes an indicator variable that equals 1 if as of day t country i had confirmed the first SARS CoV-2 case tk days ago, year-month fixed-effects, country fixed-effects and country-specific linear time trends. Standard errors in parentheses are clustered at the country-level. Table A1.3 in the online appendix contains descriptive statistics about each variable used in the estimation.
Fig. 6
Fig. 6
Country characteristics: violent events. Note: This figure plots the coefficients βkH (in red) and βkL (in blue) of Eq. (3) when conflict represents the daily number of violent events in a country. Shutdowni,tk is an indicator that equals 1 since when the Stringency index is equal or above a cutoff of 0.6 (range between 0–1), in a given country. The specification controls for time dummies interacted with high/low country characteristics dummies (high CiH versus low CiL). The points denote the monthly estimates, with dotted lines representing 90% confidence intervals. All specifications control for interaction between restriction policies and real GDP per capita, and include an indicator variable that equals 1 if as of day t country i had confirmed the first SARS CoV-2 case tk days ago, year-month fixed-effects, country fixed-effects and country-specific linear time trends. Standard errors in parentheses are clustered at the country-level. Table A1.3 in the online appendix contains descriptive statistics about each variable used in the estimation.

References

    1. Atkeson A. National Bureau of Economic Research; 2020. What will be the economic impact of COVID-19 in the US? Rough estimates of disease scenarios: Technical report.
    1. Bates R., Greif A., Singh S. Organizing violence. J. Conflict Resolution. 2002;46(5):599–628.
    1. Becker G.S. The Economic Dimensions of Crime. Palgrave Macmillan, London; 1968. Crime and punishment: An economic approach; pp. 13–68.
    1. Berman E. National Bureau of Economic Research Cambridge, Mass., USA; 2003. Hamas, Taliban and the Jewish Underground: An Economist’s View of Radical Religious Militias.
    1. Berman N., Couttenier M., Monnet N., Ticku R., et al. Conflict in times of COVID-19. COVID-19 in Develop. Economies. 2020:147.

LinkOut - more resources