. 2021 Sep 27:26:813-827.
doi: 10.1016/j.omtn.2021.09.010. eCollection 2021 Dec 3.

Systemic delivery of a DUX4-targeting antisense oligonucleotide to treat facioscapulohumeral muscular dystrophy

Affiliations

Systemic delivery of a DUX4-targeting antisense oligonucleotide to treat facioscapulohumeral muscular dystrophy

Linde F Bouwman et al. Mol Ther Nucleic Acids. .

Abstract

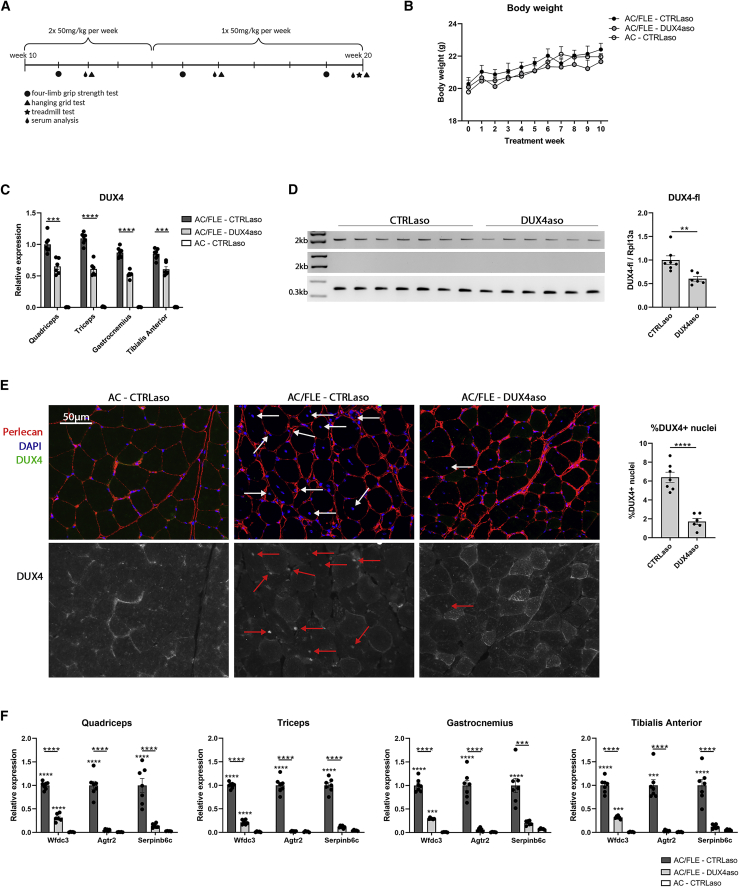
Facioscapulohumeral muscular dystrophy (FSHD) is one of the most prevalent skeletal muscle dystrophies. Skeletal muscle pathology in individuals with FSHD is caused by inappropriate expression of the transcription factor DUX4, which activates different myotoxic pathways. At the moment there is no molecular therapy that can delay or prevent skeletal muscle wasting in FSHD. In this study, a systemically delivered antisense oligonucleotide (ASO) targeting the DUX4 transcript was tested in vivo in ACTA1-MCM;FLExDUX4 mice that express DUX4 in skeletal muscles. We show that the DUX4 ASO was well tolerated and repressed the DUX4 transcript, DUX4 protein, and mouse DUX4 target gene expression in skeletal muscles. In addition, the DUX4 ASO alleviated the severity of skeletal muscle pathology and partially prevented the dysregulation of inflammatory and extracellular matrix genes. DUX4 ASO-treated ACTA1-MCM;FLExDUX4 mice performed better on a treadmill; however, the hanging grid and four-limb grip strength tests were not improved compared to control ASO-treated ACTA1-MCM;FLExDUX4 mice. This study shows that systemic delivery of ASOs targeting DUX4 is a promising therapeutic strategy for FSHD and strategies that further improve the ASO efficacy in skeletal muscle are warranted.

Keywords: ACTA1-MCM; DUX4; FLExDUX4 mouse model; antisense oligonucleotide; facioscapulohumeral muscular dystrophy; therapy.


Conflict of interest statement

The DUX4 ASO and control ASO were supplied by Ionis Pharmaceuticals. Co-authors M.J., C.A.D., and F.R. are employees of Ionis Pharmaceuticals.

Figures

None
Graphical abstract
Figure 1
Figure 1
Reduced DUX4 and mouse DUX4 target gene expression in young ACTA1-MCM;FLExD mice receiving a short DUX4 ASO treatment (A) Timeline of the first in vivo experiment. From the age of 6 to 9 weeks, ACTA1-MCM;FLExD mice (n = 5 per group) received a dose of 50 mg/kg CTRLaso or DUX4aso twice per week by subcutaneous injection. Mice were euthanized 1 week after the final injection. (B) The body weight in grams during the experiment in both treatment groups. (C) DUX4 expression as measured by qRT-PCR in the quadriceps, triceps, gastrocnemius, and tibialis anterior muscle of DUX4aso- and CTRLaso-treated ACTA1-MCM;FLExD mice. (D) Mouse DUX4 target gene expression (Wfdc3, Agtr2, and Serpinb6c) in four different skeletal muscles as measured by qRT-PCR. (E) Representative H&E stainings (100× magnification) of the quadriceps muscle of DUX4aso- and CTRLaso-treated ACTA1-MCM;FLExD mice at the age of 10 weeks. (F) The fiber size distribution, mean fiber size, and variance (standard deviation of the fiber size divided by the mean fiber size per mouse) in the quadriceps muscle of DUX4aso- and CTRLaso-treated ACTA1-MCM;FLExD mice. (G and H) The percentage of fibers with central nuclei (G) and the percentage of collagen VI-positive staining (H) in the two treatment groups. The amount of collagen VI staining was quantified as the percentage of immunostained area. To determine statistical differences between ACTA1-MCM;FLExD mice treated with CTRLaso (n = 5) or DUX4aso (n = 5), a Student’s t test was used (B–D, F–H). Each dot represents a mouse, and error bars represent the standard error of the mean (SEM). ∗p < 0.05; ∗∗p < 0.01; ∗∗∗p < 0.001; ∗∗∗∗p < 0.0001.
Figure 2
Figure 2
Reduced DUX4 and mouse DUX4 target gene expression in adult ACTA1-MCM;FLExD mice receiving a long DUX4 ASO treatment (A) Timeline of the second in vivo experiment. Mice were treated from the age of 10 weeks. In the first 4 weeks, mice received a dose of 50 mg/kg twice per week subcutaneously. In the next 5 weeks, mice received a single dose per week. Mice were euthanized 1 week after the final injection. (B) The body weight in grams in ACTA1-MCM;FLExD mice treated with either the CTRLaso (n = 7) or the DUX4aso (n = 6) and in ACTA1-MCM mice treated with the CTRLaso (n = 5). (C) DUX4 expression in the quadriceps, triceps, gastrocnemius, and tibialis anterior muscle as measured by qRT-PCR. A Student’s t test was used for statistical analysis between CTRLaso- and DUX4aso-treated ACTA1-MCM;FLExD mice. (D) With an endpoint PCR, the DUX4 full-length transcript in the quadriceps muscle was amplified in CTRLaso- and DUX4aso-treated ACTA1-MCM;FLExD mice (first lane). The minus reverse transcriptase control of DUX4 full-length (second lane) did not show any DNA contamination. An endpoint PCR for Rpl13a was used as a housekeeping gene (third lane). The amount of full-length DUX4 was quantified by correcting for Rpl13a expression. Statistical significance was determined by a Student’s t test. (E) DUX4 immunofluorescence staining on cryosections of the quadriceps muscle and quantification of the percentage of DUX4-expressing nuclei. Arrows indicate DUX4-expressing nuclei. Statistical differences were quantified by a Student’s t test. (F) Expression of mouse DUX4 target genes Wfdc3, Agtr2, and Serpinb6c in skeletal muscles of all three treatment groups. Statistical significance was determined per target gene by a one-way ANOVA. The bar with the large asterisk indicates the statistical differences between DUX4aso- and CTRLaso-treated ACTA1-MCM;FLExD mice. The small asterisk indicates a statistical change in comparison to ACTA1-MCM mice. AC/FLE, ACTA1-MCM;FLExD; AC, ACTA1-MCM. Each dot represents a mouse and the error bars the SEM. ∗p < 0.05; ∗∗p < 0.01; ∗∗∗p < 0.001; ∗∗∗∗p < 0.0001.
Figure 3
Figure 3
Reduced fatigue but not muscle strength in ACTA1-MCM;FLExD mice receiving the DUX4 ASO (A) The sum of the weight of the quadriceps, triceps, gastrocnemius, and tibialis anterior muscles of ACTA1-MCM;FLExD mice treated with DUX4aso (n = 6) or CTRLaso (n = 7) and ACTA1-MCM mice treated with CTRLaso (n = 5). The muscle weight was corrected for body weight, and statistical significance was measured with a one-way ANOVA. (B) A four-limb grip strength test and a hanging grid test were performed at different time points during the experiment. No statistical differences by two-way ANOVA were measured between the two treatments. (C) A treadmill test with an endpoint of 1,250 m was performed at the end of the treatment. One DUX4aso-treated ACTA1-MCM;FLExD mouse and one CTRLaso-treated ACTA1-MCM mouse were removed from analysis, as they refused to run. Statistical significance was tested by a log rank test (Mantel-Cox). Each dot represents a mouse and the error bars the SEM. BW, body weight in grams; AC/FLE, ACTA1-MCM;FLExD; AC, ACTA1-MCM. ∗p < 0.05; ∗∗p < 0.01; ∗∗∗p < 0.001; ∗∗∗∗p < 0.0001.
Figure 4
Figure 4
Reduced skeletal muscle pathology in ACTA1-MCM;FLExD mice receiving the DUX4 ASO (A and B) Representative H&E stainings (100× magnification) of the quadriceps (A) and triceps (B) muscles of CTRLaso-treated ACTA1-MCM;FLExD (n = 7), DUX4aso-treated ACTA1-MCM;FLExD (n = 6), and CTRLaso-treated ACTA1-MCM mice (n = 5) at the age of 20 weeks. (C and D) Fiber size distribution, average fiber size, fiber size variance (standard deviation divided by the mean per mouse), and percentage of fibers with central nuclei in the quadriceps muscle (C) and triceps muscle (D) of all three treatment groups. A one-way ANOVA was used for statistical analysis. (E and F) The amount of collagen VI (E) and CD68 (F) staining calculated as percentage of immunostained area in the quadriceps and triceps muscle in all three treatment groups. A one-way ANOVA was used for statistical analysis. AC/FLE, ACTA1-MCM;FLExD; AC, ACTA1-MCM. Each dot represents a mouse and the error bars the SEM. ∗p < 0.05; ∗∗p < 0.01; ∗∗∗p < 0.001; ∗∗∗∗p < 0.0001.
Figure 5
Figure 5
The DUX4 ASO reduced DUX4-induced gene expression and biological processes in ACTA1-MCM;FLExD mice (A) PCA analysis showed that the biological replicates cluster together. ACTA1-MCM mice are further separated from ACTA1-MCM;FLExD mice. (B and C) Volcano plot representations of differential expression analysis of genes in CTRLaso-treated ACTA1-MCM;FLExD (n = 3) mice compared to ACTA1-MCM mice (n = 3) (B) and in DUX4aso-treated ACTA1-MCM;FLExD mice (n = 3) compared to ACTA1-MCM mice (C). Red dots represent differentially expressed genes (adjusted p value < 0.05). (D) Venn diagram representing the overlap between genes differentially expressed in CTRLaso- and DUX4aso-treated ACTA1-MCM;FLExD mice compared to ACTA1-MCM mice. (E) Volcano plot depicting the differential expression results between CTRLaso- and DUX4aso-treated ACTA1-MCM;FLExD mice. Red dots represent differentially expressed genes with an adjusted p value < 0.05. (F–H) Heatmaps showing significantly upregulated genes in CTRLaso-treated ACTA1-MCM;FLExD mice from the KEGG_ECM_RECEPTOR_INTERACTION list (F) and from the KEGG_CYTOKINE_CYTOKINE_RECEPTOR_INTERACTION list (G) and DUX4 transgene and the top 25 mouse DUX4-responsive genes (H). For all three heatmaps, on the scale the Z score calculated with the normalized gene counts is depicted. Genes with an asterisk are differentially expressed between CTRLaso- and DUX4aso-treated ACTA1-MCM;FLExD mice. The dots indicate significantly enhanced genes in DUX4aso-treated ACTA1-MCM;FLExD mice compared to ACTA1-MCM mice. (I–K) Gene set enrichment analysis results using the hallmark gene lists in all three comparisons. Bar graphs represent the normalized enrichment score (NES) of significantly enhanced or downregulated biological processes (adjusted p value < 0.05). AC/FLE, ACTA1-MCM;FLExD; AC, ACTA1-MCM.

References

    1. Tawil R., van der Maarel S.M., Tapscott S.J. Facioscapulohumeral dystrophy: the path to consensus on pathophysiology. Skelet. Muscle. 2014;4:12. - PMC - PubMed
    1. Lemmers R.J., van der Vliet P.J., Klooster R., Sacconi S., Camaño P., Dauwerse J.G., Snider L., Straasheijm K.R., van Ommen G.J., Padberg G.W. A unifying genetic model for facioscapulohumeral muscular dystrophy. Science. 2010;329:1650–1653. - PMC - PubMed
    1. De Iaco A., Planet E., Coluccio A., Verp S., Duc J., Trono D. DUX-family transcription factors regulate zygotic genome activation in placental mammals. Nat. Genet. 2017;49:941–945. - PMC - PubMed
    1. Hendrickson P.G., Doráis J.A., Grow E.J., Whiddon J.L., Lim J.W., Wike C.L., Weaver B.D., Pflueger C., Emery B.R., Wilcox A.L. Conserved roles of mouse DUX and human DUX4 in activating cleavage-stage genes and MERVL/HERVL retrotransposons. Nat. Genet. 2017;49:925–934. - PMC - PubMed
    1. Geng L.N., Yao Z., Snider L., Fong A.P., Cech J.N., Young J.M., van der Maarel S.M., Ruzzo W.L., Gentleman R.C., Tawil R., Tapscott S.J. DUX4 activates germline genes, retroelements, and immune mediators: implications for facioscapulohumeral dystrophy. Dev. Cell. 2012;22:38–51. - PMC - PubMed

LinkOut - more resources