

3D disorganization and rearrangement of genome provide insights into pathogenesis of NAFLD by integrated Hi-C, Nanopore, and RNA sequencing
- PMID: 34729306
- PMCID: PMC8546856
- DOI: 10.1016/j.apsb.2021.03.022
3D disorganization and rearrangement of genome provide insights into pathogenesis of NAFLD by integrated Hi-C, Nanopore, and RNA sequencing
Abstract
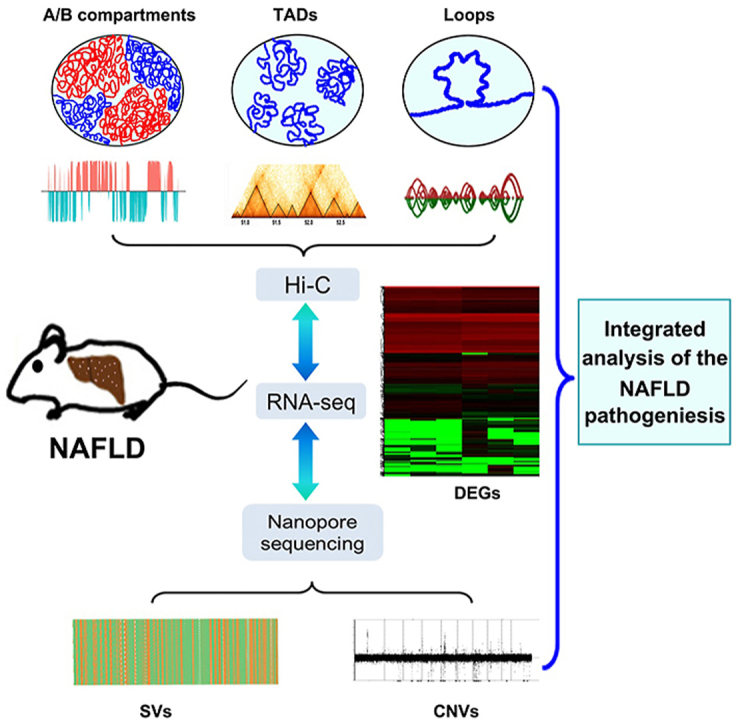
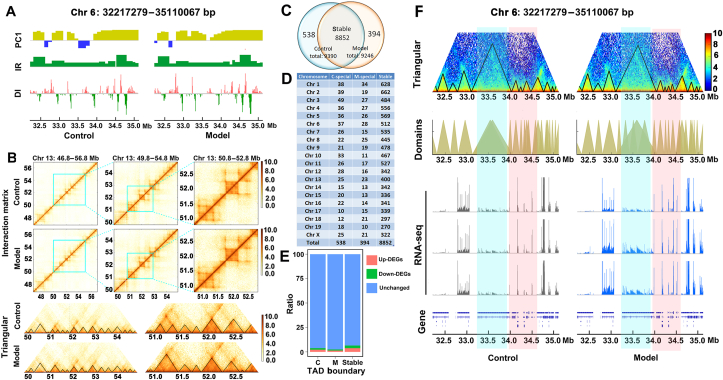
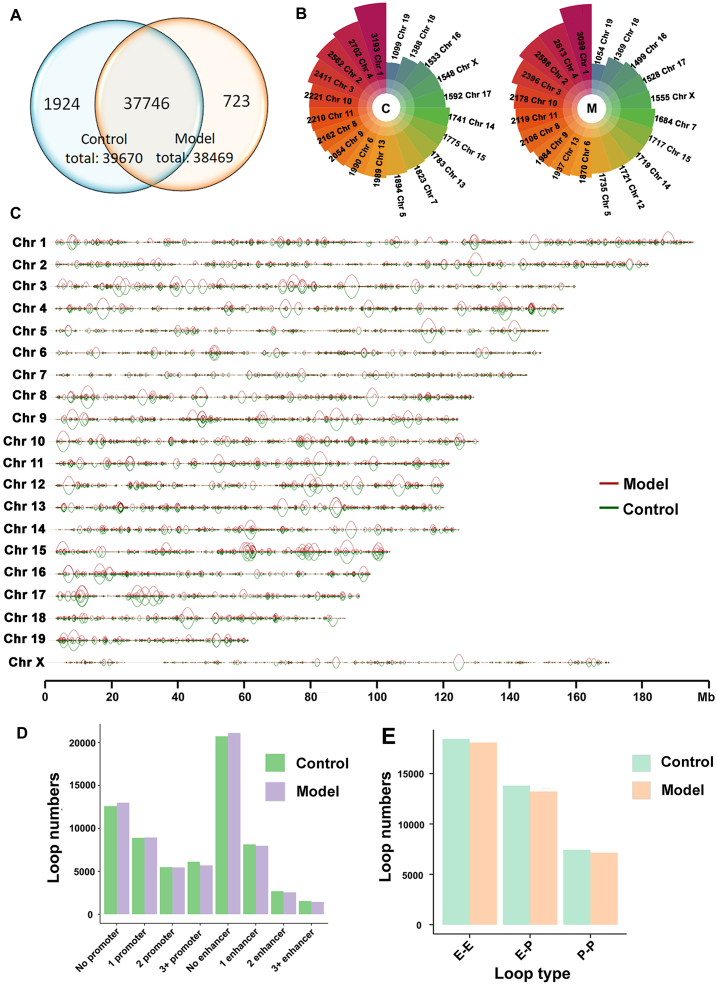
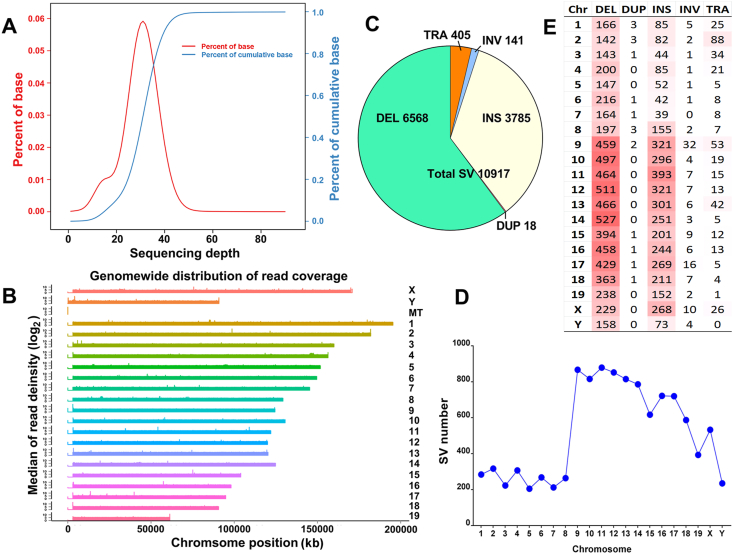
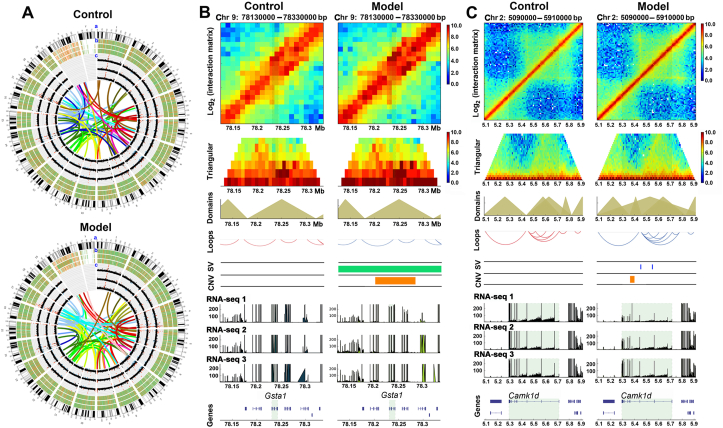
The three-dimensional (3D) conformation of chromatin is integral to the precise regulation of gene expression. The 3D genome and genomic variations in non-alcoholic fatty liver disease (NAFLD) are largely unknown, despite their key roles in cellular function and physiological processes. High-throughput chromosome conformation capture (Hi-C), Nanopore sequencing, and RNA-sequencing (RNA-seq) assays were performed on the liver of normal and NAFLD mice. A high-resolution 3D chromatin interaction map was generated to examine different 3D genome hierarchies including A/B compartments, topologically associated domains (TADs), and chromatin loops by Hi-C, and whole genome sequencing identifying structural variations (SVs) and copy number variations (CNVs) by Nanopore sequencing. We identified variations in thousands of regions across the genome with respect to 3D chromatin organization and genomic rearrangements, between normal and NAFLD mice, and revealed gene dysregulation frequently accompanied by these variations. Candidate target genes were identified in NAFLD, impacted by genetic rearrangements and spatial organization disruption. Our data provide a high-resolution 3D genome interaction resource for NAFLD investigations, revealed the relationship among genetic rearrangements, spatial organization disruption, and gene regulation, and identified candidate genes associated with these variations implicated in the pathogenesis of NAFLD. The newly findings offer insights into novel mechanisms of NAFLD pathogenesis and can provide a new conceptual framework for NAFLD therapy.
Keywords: 3C, chromosome conformation capture; 3D genome; 3D, three-dimensional; ALT, alanine aminotransferase; AST, aspartate aminotransferase; Abcg5, ATP-binding cassette sub-family G member 5; BWA, Burrows-Wheeler Aligner; CNV, copy number variation; Camk1d, calcium/calmodulin-dependent protein kinase type 1D; Chr, chromosome; Chromatin looping; DEG, differentially expressed gene; DEL, deletion; DI, directionality index; DUP, duplication; Elovl6, elongation of very long chain fatty acids protein 6; FDR, false discovery rate; FFA, free fatty acid; Fgfr2, fibroblast growth factor receptor 2; GCKR, glucokinase regulator; GO, gene ontology; GSH, glutathione; Gadd45g, growth arrest and DNA damage-inducible protein GADD45 gamma; Grm8, metabotropic glutamate receptor 8; Gsta1, glutathione S-transferase A1; H&E, hematoxylin-eosin; HFD, high-fat diet; HSD17B13, hydroxysteroid 17-beta dehydrogenase 13; Hi-C, high-throughput chromosome conformation capture; IDE, interaction decay exponent; INS, insertion; INV, inversion; IR, inclusion ratio; IRGM, immunity related GTPase M; IRS4, insulin receptor substrate 4; KEGG, Kyoto Encyclopedia of Genes and Genomes; Kcnma1, calcium-activated potassium channel subunit alpha-1; LPIN1, lipin 1; MBOAT7, membrane bound O-acyltransferase domain containing 7; MDA, malondialdehyde; NAFLD, non-alcoholic fatty liver disease; NF1, neurofibromin 1; NGS, next-generation sequencing; NOTCH1, notch receptor 1; ONT, Oxford Nanopore Technologies; PCA, principal component analysis; PNPLA3, patatin like phospholipase domain containing 3; PPP1R3B, protein phosphatase 1 regulatory subunit 3B; PTEN, phosphatase and tensin homolog; Pde4b, phosphodiesterase 4B; Plce1, 1-phosphat-idylinositol 4,5-bisphosphate phosphodiesterase epsilon-1; Plxnb1, Plexin-B1; RB1, RB transcriptional corepressor 1; RNA-seq, RNA-sequencing; SD, standard deviation; SOD, superoxide dismutase; SV, structural variation; Scd1, acyl-CoA desaturase 1; Sugct, succinate-hydroxymethylglutarate CoA-transferase; TAD, topologically associated domain; TC, total cholesterol; TG, triglyceride; TM6SF2, transmembrane 6 superfamily member 2; TP53, tumor protein p53; TRA, translocation; Topologically associated domain; Transcriptome; WGS, whole-genome sequencing; Whole-genome sequencing.
© 2021 Chinese Pharmaceutical Association and Institute of Materia Medica, Chinese Academy of Medical Sciences. Production and hosting by Elsevier B.V.
Conflict of interest statement
The authors have declared that no competing interest exists.
Figures
Similar articles
-
Integrative RNA profiling of TBEV-infected neurons and astrocytes reveals potential pathogenic effectors.Comput Struct Biotechnol J. 2022 May 30;20:2759-2777. doi: 10.1016/j.csbj.2022.05.052. eCollection 2022. Comput Struct Biotechnol J. 2022. PMID: 35685361 Free PMC article.
-
Three-dimensional genome landscape comprehensively reveals patterns of spatial gene regulation in papillary and anaplastic thyroid cancers: a study using representative cell lines for each cancer type.Cell Mol Biol Lett. 2023 Jan 6;28(1):1. doi: 10.1186/s11658-022-00409-6. Cell Mol Biol Lett. 2023. PMID: 36609218 Free PMC article.
-
3D genome of multiple myeloma reveals spatial genome disorganization associated with copy number variations.Nat Commun. 2017 Dec 5;8(1):1937. doi: 10.1038/s41467-017-01793-w. Nat Commun. 2017. PMID: 29203764 Free PMC article.
-
Assessment of Genetic Aspects of Non-alcoholic Fatty Liver and Premature Cardiovascular Events.Middle East J Dig Dis. 2020 Apr;12(2):65-88. doi: 10.34172/mejdd.2020.166. Middle East J Dig Dis. 2020. PMID: 32626560 Free PMC article. Review.
-
Gene methylation in gastric cancer.Clin Chim Acta. 2013 Sep 23;424:53-65. doi: 10.1016/j.cca.2013.05.002. Epub 2013 May 10. Clin Chim Acta. 2013. PMID: 23669186 Review.
Cited by
-
Hepatic stellate cell-specific Kcnma1 deletion mitigates metabolic dysfunction-associated steatotic liver disease progression via upregulating Amphiregulin secretion.Mol Metab. 2025 Jul;97:102164. doi: 10.1016/j.molmet.2025.102164. Epub 2025 May 8. Mol Metab. 2025. PMID: 40348016 Free PMC article.
-
UHPLC-QTOF-MS-based metabolomics joint high-throughput RNA sequencing transcriptomics approach for the analysis of fecal and liver biological samples and application in a case study for the mechanism of Qing-Kai-Ling oral liquid in treating MASLD.Anal Bioanal Chem. 2025 Jul;417(17):3777-3789. doi: 10.1007/s00216-025-05892-2. Epub 2025 May 1. Anal Bioanal Chem. 2025. PMID: 40310493
-
Transcriptomic Analysis Reveals the Protective Effects of Empagliflozin on Lipid Metabolism in Nonalcoholic Fatty Liver Disease.Front Pharmacol. 2021 Dec 21;12:793586. doi: 10.3389/fphar.2021.793586. eCollection 2021. Front Pharmacol. 2021. PMID: 34992540 Free PMC article.
-
The Gut-Organ-Axis Concept: Advances the Application of Gut-on-Chip Technology.Int J Mol Sci. 2023 Feb 17;24(4):4089. doi: 10.3390/ijms24044089. Int J Mol Sci. 2023. PMID: 36835499 Free PMC article. Review.
-
Reorganization of 3D genome architecture provides insights into pathogenesis of early fatty liver disease in laying hens.J Anim Sci Biotechnol. 2024 Mar 7;15(1):40. doi: 10.1186/s40104-024-01001-y. J Anim Sci Biotechnol. 2024. PMID: 38448979 Free PMC article.
References
-
- Younossi Z.M. Non-alcoholic fatty liver disease—a global public health perspective. J Hepatol. 2019;70:531–544. - PubMed
-
- Anstee Q.M., Seth D., Day C.P. Genetic factors that affect risk of alcoholic and nonalcoholic fatty liver disease. Gastroenterology. 2016;150:1728–1744. - PubMed
-
- Umano G.R., Caprio S., Di Sessa A., Chalasani N., Dykas D.J., Pierpont B. The rs626283 variant in the MBOAT7 gene is associated with insulin resistance and fatty liver in caucasian obese youth. Am J Gastroenterol. 2018;113:376–383. - PubMed
-
- Eslam M., Valenti L., Romeo S. Genetics and epigenetics of NAFLD and NASH: clinical impact. J Hepatol. 2018;68:268–279. - PubMed
LinkOut - more resources
Full Text Sources
Research Materials
Miscellaneous
