. 2021 Oct;11(10):3231-3243.
doi: 10.1016/j.apsb.2021.01.016. Epub 2021 Jan 23.

Tumor microenvironments self-activated nanoscale metal-organic frameworks for ferroptosis based cancer chemodynamic/photothermal/chemo therapy

Affiliations

Tumor microenvironments self-activated nanoscale metal-organic frameworks for ferroptosis based cancer chemodynamic/photothermal/chemo therapy

Yu Liang et al. Acta Pharm Sin B. 2021 Oct.

Abstract

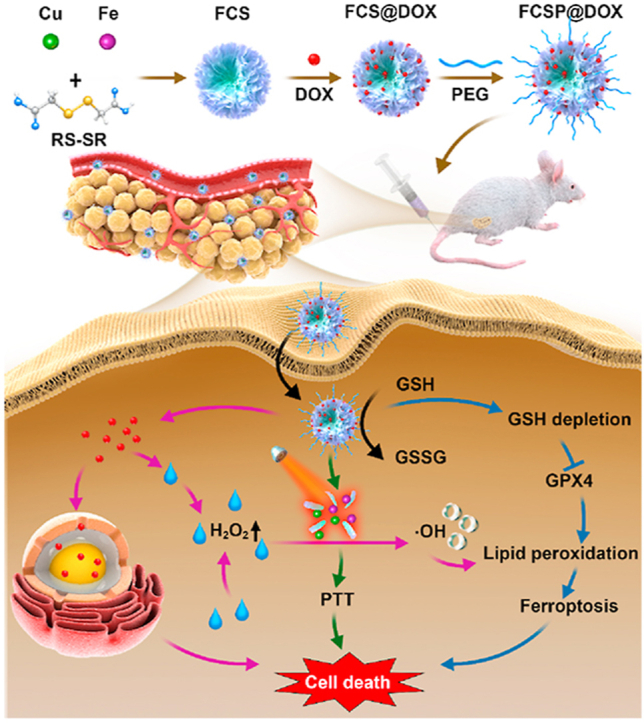
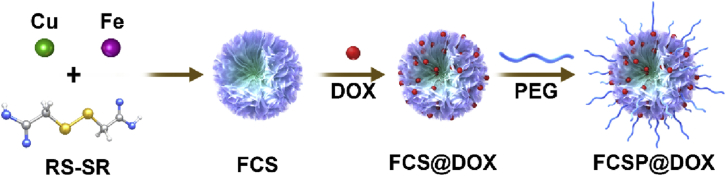
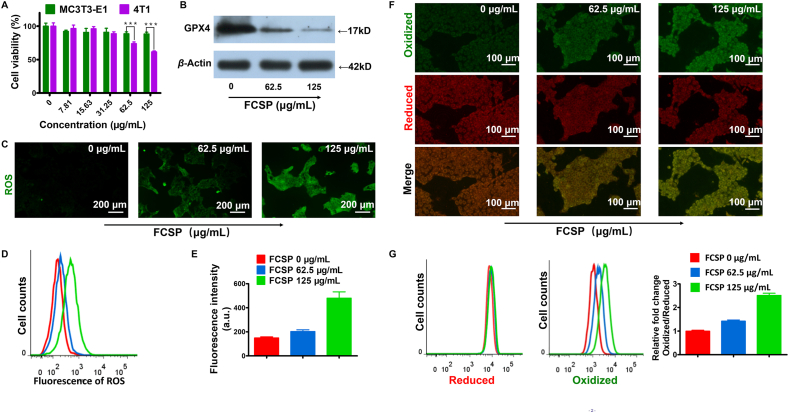
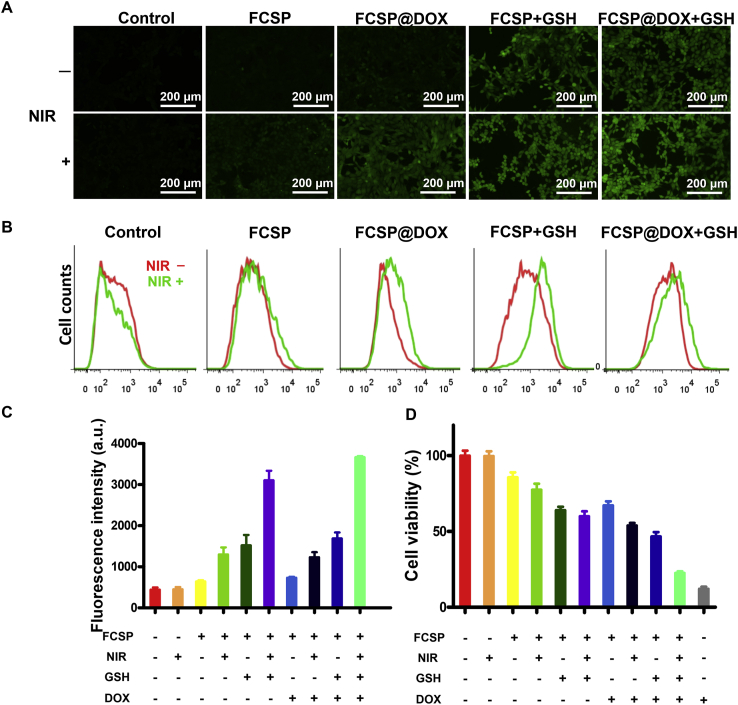
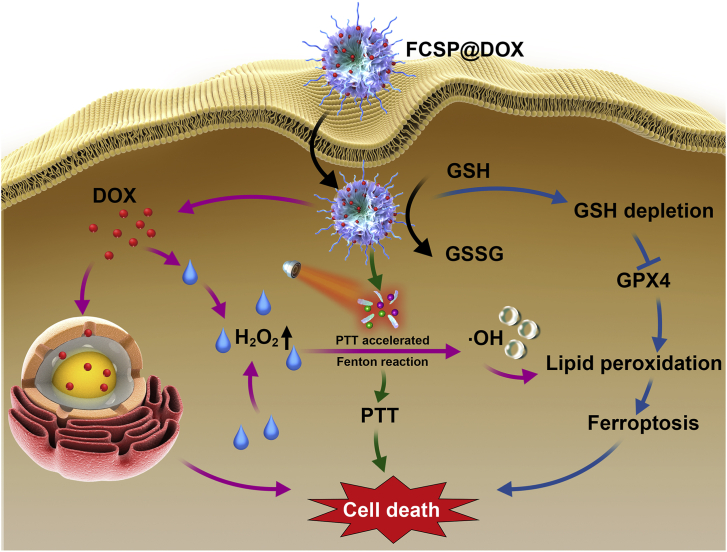
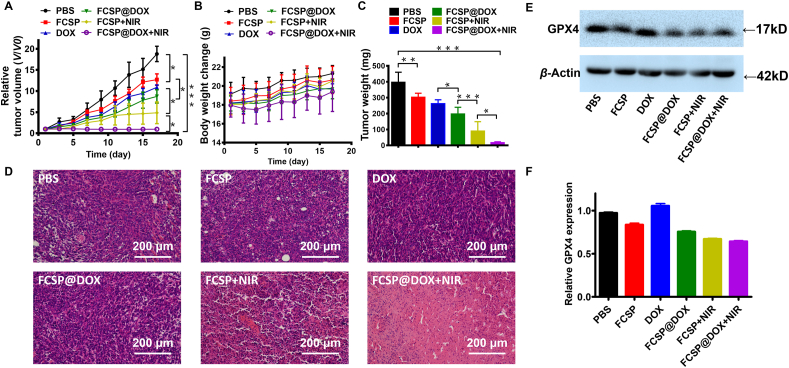
Ferroptosis, as a newly discovered cell death form, has become an attractive target for precision cancer therapy. Several ferroptosis therapy strategies based on nanotechnology have been reported by either increasing intracellular iron levels or by inhibition of glutathione (GSH)-dependent lipid hydroperoxidase glutathione peroxidase 4 (GPX4). However, the strategy by simultaneous iron delivery and GPX4 inhibition has rarely been reported. Herein, novel tumor microenvironments (TME)-activated metal-organic frameworks involving Fe & Cu ions bridged by disulfide bonds with PEGylation (FCSP MOFs) were developed, which would be degraded specifically under the redox TME, simultaneously achieving GSH-depletion induced GPX4 inactivation and releasing Fe ions to produce ROS via Fenton reaction, therefore causing ferroptosis. More ROS could be generated by the acceleration of Fenton reaction due to the released Cu ions and the intrinsic photothermal capability of FCSP MOFs. The overexpressed GSH and H2O2 in TME could ensure the specific TME self-activated therapy. Better tumor therapeutic efficiency could be achieved by doxorubicin (DOX) loading since it can not only cause apoptosis, but also indirectly produce H2O2 to amplify Fenton reaction. Remarkable anti-tumor effect of obtained FCSP@DOX MOFs was verified via both in vitro and in vivo assays.

Keywords: Drug delivery; Fenton reaction; Ferroptosis; GSH depletion; Metal-organic frameworks (MOFs); Tumor microenvironments.


Conflict of interest statement

The authors have no conflicts of interest to declare.

Figures

Image 1
Graphical abstract
Scheme 1
Scheme 1
Schematic illustration of the synthesis of TME self-activated FCSP@DOX MOFs for ferroptosis based cancer chemodynamic/photothermal/chemo therapy.
Figure 1
Figure 1
(A) TEM images of FCS MOFs and STEM-EDS elemental maps of FCSP MOFs. (B) Nitrogen adsorption–desorption isotherms of FCS MOFs. (C) UV–Vis spectra of FCSP MOFs, FCSP@DOX MOFs and free DOX. (D) Photothermal stability of FCSP MOFs within five cycles of NIR laser irradiation. (E) Temperature change curses of the FCSP MOFs aqueous dispersion at different power density at the same concentrations of 250 μg/mL. (F) Temperature change curses of the FCSP MOFs aqueous dispersion at different concentrations at the power density of 0.7 W/cm2.
Figure 2
Figure 2
(A) TEM images of biodegradable FCSP MOFs immersed in 10 mmol/L GSH aqueous solution for Days 0, 1, 3 and 5. (B) Liquid chromatography-mass spectrometry (LC–MS) results about the reaction between FCSP MOFs and GSH after 0, 3, and 5 days. (C) UV–Vis analysis of the Fenton reaction for RhB decolorization of different groups to demonstrate the ability of ·OH generation and (D) their relative quantification at 553 nm. (E) UV–Vis analysis of the Fenton reaction for RhB decolorization of different groups to demonstrate the ability of heat and Cu2+ enhanced ·OH generation and (F) their relative quantification at 553 nm. (G) Release kinetics of DOX from FCSP@DOX MOFs in PBS at different pH without or with 10 mmol/L GSH and (H) their relative quantification of DOX release at 72 h. Date are presented as mean ± SD (n = 3).
Figure 3
Figure 3
(A) Cell viabilities of MC3T3-E1 or 4T1 cells after incubation with FCSP MOFs at different concentration, date are presented as mean ± SD (n = 6). ∗∗∗P<0.001. (B) Western blot results of GPX4 expression level in 4T1 cells after treatment with different concentration FCSP MOFs. (C) DCFH-DA assay of 4T1 cells treated with different concentration FCSP (0, 62.5, and 125 μg/mL), scale bar = 200 μm, and (D) their corresponding flow cytometry analyses and (E) relative fluorescence intensity (a.u.). Date are presented as mean ± SD (n = 3). (F) Fluorescence images of 4T1 cells treated with different MOFs formulations, C11-BODIPY was used to assess lipid peroxidation. Scale bars = 100 μm (G) Their corresponding flow cytometry analyses. The panel from left to right represented the fluorescence intensity of reduced lipid, oxidized lipid, and relative fold changes of lipid peroxidation in Oxidized/Reduced, respectively. Date are presented as mean ± SD (n = 3).
Figure 4
Figure 4
(A) Fluorescence images of 4T1 cells treated with different MOFs formulations with or without NIR, DCFH-DA was used to detect ROS generation. Scale bars = 200 μm and (B) their corresponding flow cytometry analyses and (C) relative fluorescence intensity (a.u.). (D) Cell viabilities of 4T1 cells after treatment with different MOFs formulations with or without NIR. Date are presented as mean ± SD (n = 3).
Scheme 2
Scheme 2
Schematic illustration of the TME self-activated FCSP@DOX MOFs for ferroptosis based cancer chemodynamic/photothermal/chemo therapy. Ferroptosis based chemodynamic therapy would be activated by the redox tumor environment due to GSH depletion induced GPX4 inhibition and Fe/Cu ions involved Fenton reaction. More ROS could be generated by the acceleration of Fenton reaction due to the intrinsic photothermal capability of FCSP MOFs. Moreover, the released DOX could not only induce chemotherapy, but also indirectly produce H2O2 to further enhance the ferroptosis based cancer chemodynamic therapy.
Figure 5
Figure 5
(A) The relative tumor growth curves (date are presented as mean ± SD (n = 5), ∗P < 0.05, ∗∗P < 0.01, ∗∗∗P < 0.001) and (B) mice body weights change during the different treatments during the 18 days study period. (C) Tumor weight from sacrificed animals at the end of the experiment. Date are presented as mean ± SD (n = 5), ∗P < 0.05, ∗∗P < 0.01, ∗∗∗P < 0.001. (D) H&E stained images of tumors tissues after different treatments (scale bar = 200 μm). (E) Western blot results of GPX4 expression level in 4T1 tumor tissue after different treatments, and (F) their relative quantification (n = 3).

References

    1. Dixon S.J., Lemberg K.M., Lamprecht M.R., Skouta R., Zaitsev E.M., Gleason C.E. Ferroptosis: an iron-dependent form of non-apoptotic cell death. Cell. 2012;149:1060–1072. - PMC - PubMed
    1. Angeli J.P.F., Shah R., Pratt D.A., Conrad M. Ferroptosis inhibition: mechanisms and opportunities. Trends Pharmacol Sci. 2017;38:489–498. - PubMed
    1. Doll S., Proneth B., Tyurina Y.Y., Panzilius E., Kobayashi S., Ingold I. ACSL4 dictates ferroptosis sensitivity by shaping cellular lipid composition. Nat Chem Biol. 2017;13:91–98. - PMC - PubMed
    1. Shimada K., Skouta R., Kaplan A., Yang W.S., Hayano M., Dixon S.J. Global survey of cell death mechanisms reveals metabolic regulation of ferroptosis. Nat Chem Biol. 2016;12:497–503. - PMC - PubMed
    1. Shimada K., Hayano M., Pagano N.C., Stockwell B.R. Cell-line selectivity improves the predictive power of pharmacogenomic analyses and helps identify NADPH as biomarker for ferroptosis sensitivity. Cell Chem Biol. 2016;23:225–235. - PMC - PubMed

LinkOut - more resources