. 2021 Sep 25;3(4):fcab221.
doi: 10.1093/braincomms/fcab221. eCollection 2021.

High-throughput imaging of ATG9A distribution as a diagnostic functional assay for adaptor protein complex 4-associated hereditary spastic paraplegia

Affiliations

High-throughput imaging of ATG9A distribution as a diagnostic functional assay for adaptor protein complex 4-associated hereditary spastic paraplegia

Darius Ebrahimi-Fakhari et al. Brain Commun. .

Abstract

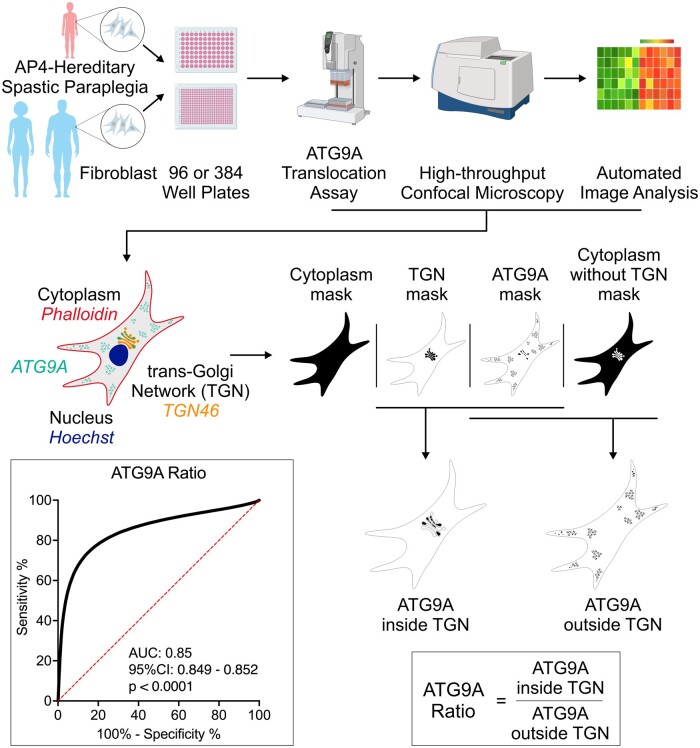
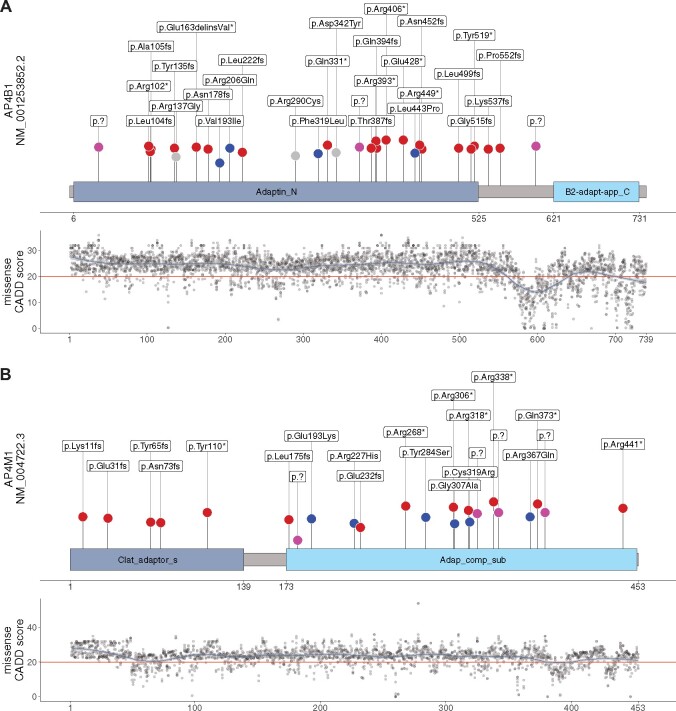
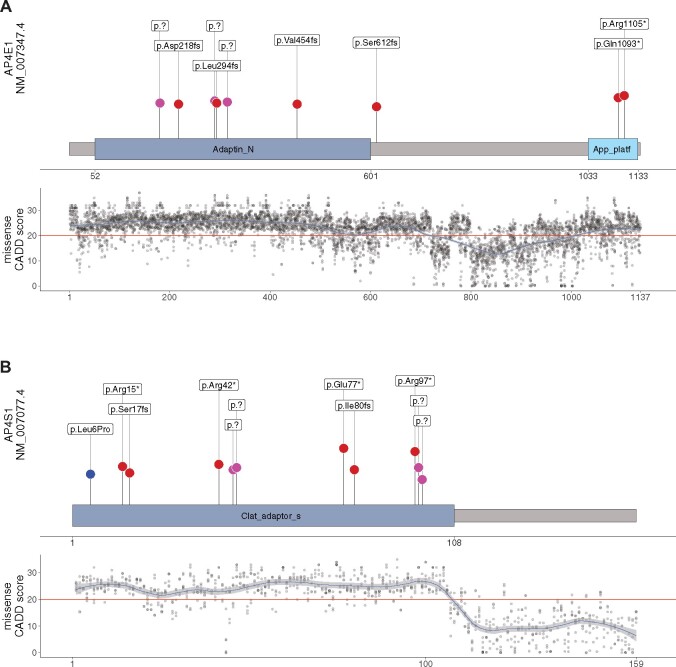
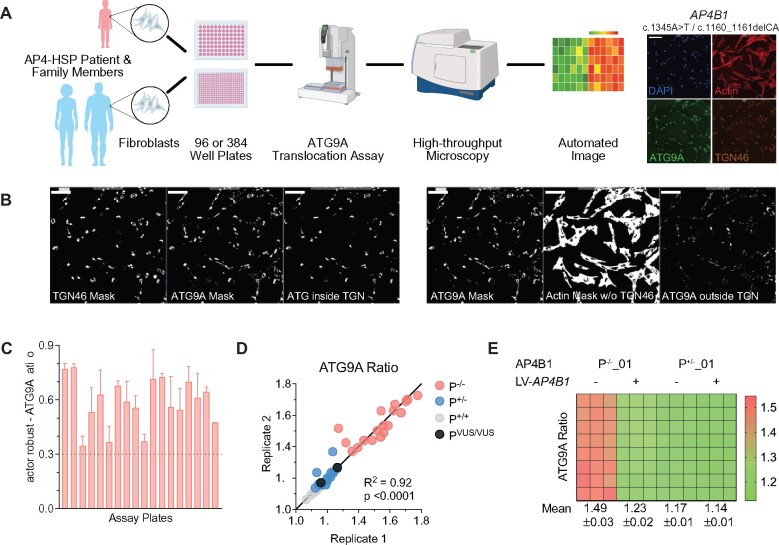
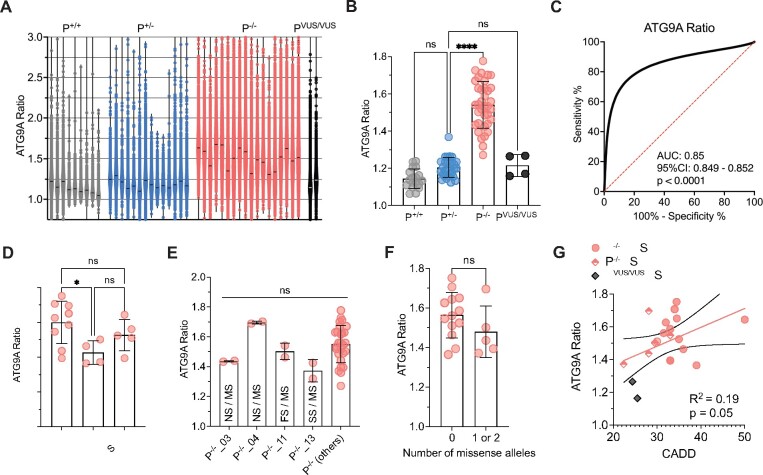
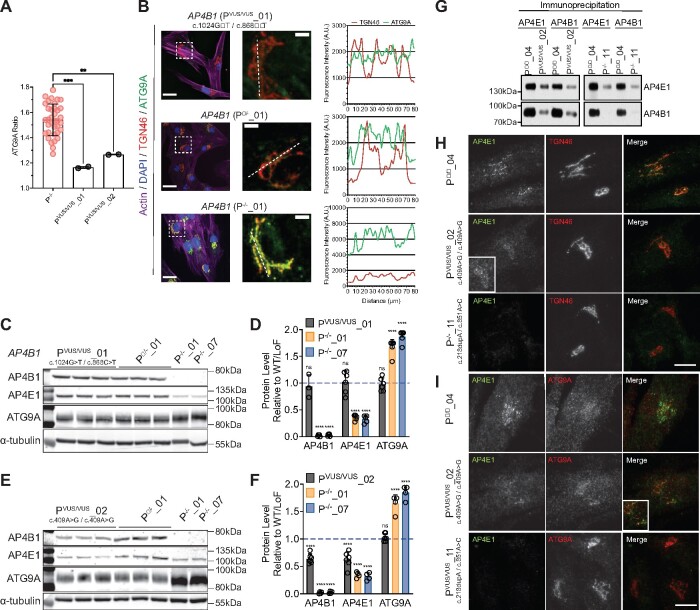
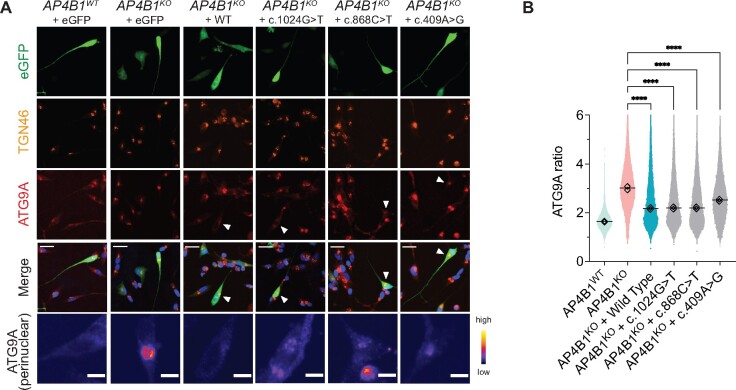
Adaptor protein complex 4-associated hereditary spastic paraplegia is caused by biallelic loss-of-function variants in AP4B1, AP4M1, AP4E1 or AP4S1, which constitute the four subunits of this obligate complex. While the diagnosis of adaptor protein complex 4-associated hereditary spastic paraplegia relies on molecular testing, the interpretation of novel missense variants remains challenging. Here, we address this diagnostic gap by using patient-derived fibroblasts to establish a functional assay that measures the subcellular localization of ATG9A, a transmembrane protein that is sorted by adaptor protein complex 4. Using automated high-throughput microscopy, we determine the ratio of the ATG9A fluorescence in the trans-Golgi-network versus cytoplasm and ascertain that this metric meets standards for screening assays (Z'-factor robust >0.3, strictly standardized mean difference >3). The 'ATG9A ratio' is increased in fibroblasts of 18 well-characterized adaptor protein complex 4-associated hereditary spastic paraplegia patients [mean: 1.54 ± 0.13 versus 1.21 ± 0.05 (standard deviation) in controls] and receiver-operating characteristic analysis demonstrates robust diagnostic power (area under the curve: 0.85, 95% confidence interval: 0.849-0.852). Using fibroblasts from two individuals with atypical clinical features and novel biallelic missense variants of unknown significance in AP4B1, we show that our assay can reliably detect adaptor protein complex 4 function. Our findings establish the 'ATG9A ratio' as a diagnostic marker of adaptor protein complex 4-associated hereditary spastic paraplegia.

Keywords: adaptor protein complex 4; biomarker; functional assay; hereditary spastic paraplegia; high-throughput imaging.


Figures

Graphical Abstract
Graphical Abstract
Figure 1
Figure 1
AP4B1 and AP4M1 subunit structures with variant distribution and CADD scores for all possible missense variants. (A and B) Schematic representation of AP4B1 (based on UniProt Q9Y6B7) and AP4M1 (based on UniProt O00189) proteins with their respective aligned units identified by pfam. Blue dots represent reported missense variants, splice variants are depicted in pink and truncating variants in red. Novel variants are highlighted in grey. Length of vertical lines corresponds to the CADD score for each variant. Also shown are the CADD PHRED (version 1.6) scores across the protein secondary structure for all possible missense variants in AP4B1 and AP4M1 respectively. The red horizontal line marks the recommended cut-off of 20. Similar analyses for M-CAP and REVEL scores are found in Supplementary Fig. 1. Data are summarized in Supplementary File 1.
Figure 2
Figure 2
AP4E1 and AP4S1 subunit structures with variant distribution and CADD scores for all possible missense variants. (A and B) Schematic representation of AP4E1 (based on UniProt Q9UPM8) and AP4S1 (based on UniProt Q9Y587-2) proteins with their respective aligned units identified by pfam. Blue dots represent reported missense variants, splice variants are depicted in pink and truncating variants in red. Length of vertical lines corresponds to the CADD score for each variant. Also, shown are the CADD PHRED (version 1.6) scores across the protein secondary structure for all possible missense variants in AP4E1 and AP4S1, respectively. The red horizontal line marks the recommended cut-off of 20. Similar analyses for M-CAP and REVEL scores can be found in Supplementary Fig. 1. Data are summarized in Supplementary File 1.
Figure 3
Figure 3
Development of a high-throughput ATG9A translocation assay to determine AP-4 function. (A) Schematic overview of the high-throughput assay and workflow. Fibroblasts are derived by a routine skin punch biopsy, cultured and plated in 96- or 384-well plates. Cells are stained for DAPI (nuclear marker), actin (cytoplasmic marker), TGN46 (trans-Golgi network marker) and ATG9A. Plates are then subjected to confocal microscopy using a high-content imager and analysed using an automated image analysis pipeline. This figure was, in part, created with BioRender.com. (B) Automated image analysis to determine the ATG9A ratio on the level of individual cells. First cells are identified and outlined based on the presence of a DAPI-positive nucleus inside a phalloidin (actin marker)-positive area. Next, different masks are generated: an actin mask to outline the cell, a TGN46 mask to outline the area of the trans-Golgi network, and an ATG9A mask based on intracellular ATG9A fluorescence. ATG9A fluorescence intensity is then measured inside the TGN mask as well as inside the actin-staining positive cytoplasm outside the trans-Golgi network (a mask generated by subtracting the TGN46 mask from the actin mask). The ATG9A ratio is calculated for each cell by dividing the ATG9A fluorescence in both compartments. (C) Z′-factor robust scores for the ATG9A ratio show a robust separation of positive (P−/−) and negative controls (P+/) and meet a predefined threshold of 0.3 in all assay plates. (D) Replicate plot showing the distribution of ATG9A ratio levels for each of two assay plates (biological replicates) in fibroblasts from patients with AP-4-HSP and biallelic loss-of-function variants (P−/−, Table 1), asymptomatic, heterozygous controls (P+/), healthy unrelated controls (P+/+, Supplementary Table 2), and two individuals with novel biallelic missense variants in AP4B1 (novel variants, Table 1, Supplementary Table 1). Correlation analysis of 36 pairs shows a Pearson correlation coefficient of 0.95 with a P-value of <0.0001. (E) Heatmap of the ATG9A ratio in a 96-well plate with fibroblasts from patient P−/−_01 with biallelic truncating variants in AP4B1 and a heterozygous control (P+/−_01) in the absence and presence of lentivirus to re-express the missing AP4B1 subunit. Re-expression over 24 h restores the ATG9A ratio close to that of controls indicating that the ATG9A assay can detect dynamic changes in AP-4 function.
Figure 4
Figure 4
Validation of the ‘ATG9A ratio’ as an indicator of AP-4 function and a diagnostic marker for AP-4-HSP. (A) Violin plots showing the distribution of data points for each fibroblast line with a mean of 6765 ± 4536 (SD) cells from two assay plates for each cell line. Each data point corresponds to the ATG9A ratio of a single fibroblast. Horizontal lines indicate the median (334 data points are outside the axis limits). (B) Grouped analysis of the mean ATG9A ratio of all assay plates demonstrates a significant increase of the ATG9A ratio in AP-4-HSP patients with biallelic loss-of-function variants (P−/−) compared to heterozygous carriers (P+/) (Kruskal–Wallis test with Dunn’s multiple comparisons test, P < 0.0001). ATG9A ratios of the two individuals with novel biallelic missense variants in AP4B1 (PVUS/VUS) and that of healthy controls (P+/+) are not significantly different from heterozygous controls. Each data point represents the mean ATG9A ratio of each assay plate. (C) Receiver-operating characteristic (ROC) curve for the pooled ATG9A ratio data of all AP-4-HSP patients with biallelic loss-of-function variants (P−/−, n = 160 229 cells) versus heterozygous carriers (P+/, n = 86 691 cells) shows an area under curve (AUC) of 0.85 with a 95% confidence interval between 0.8488 and 0.8519 and a P-value of <0.0001. (D) Grouped analysis of the mean ATG9A ratios of AP-4-HSP patients with biallelic loss-of-function variants (P−/−) separated by their AP-4-HSP subtype shows that patients with AP4M1-associated SPG50 have lower mean ATG9A ratios compared to AP4B1-associated SPG47 (Kruskal–Wallis test with Dunn’s multiple comparisons test, P < 0.05). Each data point represents the mean ATG9A ratio of each assay plate. (E) Mean ATG9A ratios of three individuals with missense variants previously classified as variant of unclear significance by ACMG criteria, in trans with pathogenic variants, are not different compared to patients with biallelic variants classified as pathogenic or likely pathogenic. Similarly, the mean ATG9A ratio of fibroblasts from an individual with a novel missense variant in trans with a novel splice-site variant (P−/−_13), both previously classified as of uncertain significance, is not significantly different. This confirms the detrimental impact of these variants on AP-4 function (Kruskal-Wallis test with Dunn’s multiple comparisons test, P > 0.05). Each data point represents the mean ATG9A ratio of each assay plate. FS, frameshift variant; NS, nonsense variant; MS, missense variant; SS, splice site variant. (F) Analysis of the mean ATG9A ratio from AP-4-HSP patients with biallelic loss-of-function variants grouped by the presence or absence of alleles with missense variants. While there is a trend towards lower ATG9A ratios in patients with 1 or 2 missense variants, this did not reach statistical significance (Mann–Whitney test, P = 0.23). Each data point represents the mean ATG9A ratio of each assay plate. (G) ATG9A ratio levels in correlation to CADD scores in individuals with biallelic loss-of-function variants with no missense variant (red circles represent the mean of the CADD scores from both alleles), biallelic loss-of-function variants with a missense variant on one allele (diamonds half-filled with red represent CADD score of the missense variant) and individuals with novel biallelic missense variants (PVUS/VUS_01 and PVUS/VUS_02, grey diamonds represent missense variant with the lowest CADD score). There is a trend towards a correlation that does not however reach statistical significance (Pearson correlation coefficient: r = 0.19, P = 0.05). Each data point represents the mean ATG9A ratio of each assay plate. *P < 0.05; ****P < 0.0001.
Figure 5
Figure 5
The ATG9A ratio can provide a functional assessment of novel missense variants. (A) Mean ATG9A ratio of all assay plates in AP-4-HSP patients with biallelic loss-of-function variants (P−/−) and two patients with novel biallelic missense variants (PVUS/VUS_01 and PVUS/VUS_02) (one-way ANOVA with Dunnett’s post hoc test, P−/− versus PVUS/VUS_01, P = 0.0003; P−/− versus PVUS/VUS_02, P = 0.0037). (B) Fibroblasts from an individual with novel biallelic missense variants in AP4B1 (PVUS/VUS_01), an asymptomatic individual with a heterozygous variant in AP4B1 (P+/−_01) and an AP-4-HSP patient with biallelic loss-of-function variants in AP4B1 (P−/−_01) stained with phalloidin (actin marker) and antibodies against TGN46 (trans-Golgi network marker) and ATG9A. Right panel shows magnification of inserts. Dotted line indicates from which line the plots for the TGN46 and corresponding ATG9A signal are generated. Fibroblasts from PVUS/VUS_01 show no elevation of ATG9A fluorescence while the signal is increased in P−/−_01. (C and D) Western blot of whole-cell lysates from fibroblasts of PVUS/VUS_01 compared to P+/−_01 and two AP-4-HSP patients with biallelic loss-of-function variants in AP4B1 (P−/−_01 and P−/−_07). Fibroblasts from PVUS/VUS_01 show levels of AP4B1, AP4E1 and ATG9A that are not different compared to P+/−_01, whereas levels of AP4B1 are robustly reduced and levels of ATG9A elevated in P−/−_01 and P−/−_07 (one-way ANOVA with Dunnett’s post hoc test, P < 0.0001). Bar graph shows the mean and standard deviation of 4–6 (PVUS/VUS_01) and 5 (P−/−_01 and P−/−_07) samples. (E and F) Western blot of whole-cell lysates from fibroblasts of PVUS/VUS_02 compared to P+/−_01 and two AP-4-HSP patients with biallelic loss-of-function variants in AP4B1 (P−/−_01 and P−/−_07). Fibroblasts from PVUS/VUS_02 show a reduction of AP4B1 and AP4E1, indicative of lower AP-4 complex formation. There is, however, no significant change in ATG9A compared to P+/−_01 (one-way ANOVA with Dunnett’s post hoc test, P < 0.0001). Bar graph shows the mean and standard deviation of 6 (PVUS/VUS_02) and 4 (P−/−_01 and P−/−_07) samples. (G) Co-immunoprecipitation of AP4E1 and AP4B1 demonstrates reduced binding of both subunits in lysates from PVUS/VUS_02 compared to a control (P+/+_04). For comparison, the same experiment with lysates from a patient with biallelic loss-of-function variants in AP4M1 is shown (P−/−_11), demonstrating near complete absence of AP-4 complex assembly. (H and I) Fibroblasts from an individual with novel biallelic missense variants in AP4B1 (PVUS/VUS_02), an asymptomatic control (P+/+_04) and an AP-4-HSP patient with biallelic loss-of-function variants in AP4M1 (P−/−_11) stained with antibodies against AP4E1 and TGN46 showing reduced levels of AP4E1 associated with the TGN in PVUS/VUS_02. No significant change in ATG9A localization is found. **P < 0.01; ***P < 0.001; ****P < 0.0001.
Figure 6
Figure 6
Expression of novel AP4B1 missense variants (c.1024G>T, c.868C.T, c.409A>G) in AP4B1KO SH-SY5Y cells reduces the ATG9A ratio. (A) Differentiated AP4B1KO SH-SY5Y cells transfected with plasmids to express full-length wild-type or mutant AP4B1 alleles found in PVUS/VUS_01 (c.1024G>T and c.868C.T) and PVUS/VUS_02 (c.409A>G). Differentiated AP4B1WT and AP4B1KO SH-SY5Y cells transfected with eGFP only serve as controls. Cells are stained with antibodies against TGN46 (trans-Golgi network marker) and ATG9A. Transfected cells are detected based on the eGFP signal. White arrowheads indicate transfected cells. The bottom row shows a magnified and pseudocoloured image (colour code indicates grey-scale value) of the transfected cell. (B) After 48 h, expression of full-length wild-type AP4B1, AP4B1c.409A>G, AP4B1c.868C>T, AP4B1c.1024G>T in AP4B1KO SH-SY5Y cells reduced the ATG9A ratio, indicating the restoration of AP-4 function (one-way ANOVA with Dunnett’s post hoc test, P < 0.0001). Each data point represents the ATG9A ratio of a single cell [mean number of cells per group: 27 834 ± 4401 (SD), each diamond represents the mean of each assay plate (n = 2)], horizontal lines indicate the mean from two assay plates. A total of 615 data points are outside the axis limits. ****P < 0.0001.

References

    1. Shribman S, Reid E, Crosby AH, Houlden H, Warner TT.. Hereditary spastic paraplegia: From diagnosis to emerging therapeutic approaches. Lancet Neurol. 2019;18(12):1136–1146. - PubMed
    1. Richards S, Aziz N, Bale S, et al.; ACMG Laboratory Quality Assurance Committee. Standards and guidelines for the interpretation of sequence variants: A joint consensus recommendation of the American College of Medical Genetics and Genomics and the Association for Molecular Pathology. Genet Med. 2015;17(5):405–424. - PMC - PubMed
    1. Ebrahimi-Fakhari D, Teinert J, Behne R, et al.Defining the clinical, molecular and imaging spectrum of adaptor protein complex 4-associated hereditary spastic paraplegia. Brain. 2020;143(10):2929–2944. - PMC - PubMed
    1. Ebrahimi-Fakhari D, Behne R, Davies AK, Hirst J, et al.AP-4-associated hereditary spastic paraplegia. In: Adam MP, Ardinger HH, Pagon RA, eds. GeneReviews® [Internet]. Seattle (WA): University of Washington, Seattle; 2018, 1993–2021. PMID: 30543385. - PubMed
    1. Sanger A, Hirst J, Davies AK, Robinson MS.. Adaptor protein complexes and disease at a glance. J Cell Sci. 2019;132(20):jcs222992. - PubMed

LinkOut - more resources