. 2021 Dec 15;131(24):e148545.
doi: 10.1172/JCI148545.

LRG1 is an adipokine that mediates obesity-induced hepatosteatosis and insulin resistance

Affiliations

LRG1 is an adipokine that mediates obesity-induced hepatosteatosis and insulin resistance

Sijia He et al. J Clin Invest. .

Abstract

Dysregulation in adipokine biosynthesis and function contributes to obesity-induced metabolic diseases. However, the identities and functions of many of the obesity-induced secretory molecules remain unknown. Here, we report the identification of leucine-rich alpha-2-glycoprotein 1 (LRG1) as an obesity-associated adipokine that exacerbates high fat diet-induced hepatosteatosis and insulin resistance. Serum levels of LRG1 were markedly elevated in obese humans and mice compared with their respective controls. LRG1 deficiency in mice greatly alleviated diet-induced hepatosteatosis, obesity, and insulin resistance. Mechanistically, LRG1 bound with high selectivity to the liver and promoted hepatosteatosis by increasing de novo lipogenesis and suppressing fatty acid β-oxidation. LRG1 also inhibited hepatic insulin signaling by downregulating insulin receptor substrates 1 and 2. Our study identified LRG1 as a key molecule that mediates the crosstalk between adipocytes and hepatocytes in diet-induced hepatosteatosis and insulin resistance. Suppressing LRG1 expression and function may be a promising strategy for the treatment of obesity-related metabolic diseases.

Keywords: Diabetes; Endocrinology; Insulin signaling; Metabolism; Obesity.


Conflict of interest statement

Conflict of interest: The authors have declared that no conflict of interest exists.

Figures

Figure 1
Figure 1. Identification of LRG1 as an adipokine.
(A) Upregulation of secretory factors during brown and 3T3-L1 cell differentiation (n = 3/treatment group). High and low represent the value of Z score. Lrg1 mRNA levels before and after brown (B) and white (C) adipocyte differentiation (n = 4/group). (D) LRG1 protein levels during adipocyte differentiation. CM: cell culture medium. Adpn: Adiponectin. (E) LRG1 protein levels in human liver (n = 6) and adipose tissues (n = 6). (F) Tissue distribution of LRG1 protein in 4-month-old male C57BL/6J mice after saline perfusion. (G) Lrg1 mRNA and (H) protein levels in adipocyte and SVFs of C57BL/6J mice. Adip: adipocytes. Data in D, F, and H are representative of 3 independent experiments. All graphical data represent mean ± SEM. Unpaired 2-tailed t test, *P ≤ 0.05, **P ≤ 0.01, and ****P ≤ 0.0001.
Figure 2
Figure 2. LRG1 is upregulated in obesity.
(A) LRG1 protein levels in human serum (nonobese: n = 6, obese: n = 7). Bar graph shows quantification of the Western blot intensity using Image J software. (B) LRG1 gene expression in human subcutaneous adipose tissue plotted against BMI (n = 23). (C) Serum LRG1 protein levels in male C57BL/6J mice fed a NC or a HFD diet (n = 7/group) for 16 weeks. (D) Quantification of LRG1 immunoblots in adipose tissues of NC- or HFD-fed C57BL/6J male mice (n = 7/group). (E) LRG1 protein levels in the serum of 4-month-old leptin receptor–deficient (db/db) and control mice (wt/db) (n = 4/group). (F) LRG1 protein levels in adipose tissues of db/db and wt/db mice (n = 4 per group). (G) LRG1 protein levels in cells and cell culture medium (CM) after glucose treatment for 48 hours. (H) LRG1 protein levels in cells and cell culture medium (CM) after 1 mM metformin treatment for 48 hours. Data in G and H are representative of 3 independent experiments. Data in B were analyzed using linear regression. The rest of the graphical data represent mean ± SEM. Unpaired 2-tailed t test, *P ≤ 0.05, **P ≤ 0.01, ***P ≤ 0.001, ****P ≤ 0.0001.
Figure 3
Figure 3. Lrg1 knockout protects mice from diet-induced hepatic steatosis and insulin resistance.
(A) Body weight of Lrg1KO mice (n = 16) and WT littermates (n = 18) fed a HFD for 16 weeks. (B) H&E staining of adipose tissues from Lrg1KO and WT mice fed with HFD for 16 weeks (scale bar: 100 μm). (C) Quantification of white adipocyte cell size based on H&E staining (n = 5 sections/group). (D) Overnight fasting serum insulin levels of Lrg1KO mice (n = 9) and WT littermates (n = 8) after 16 weeks of HFD feeding. (E) GTT and (F) ITT of Lrg1KO mice (n = 16) and WT littermates (n = 18) fed a HFD for 16 weeks. (G) Overall liver tissue appearance, H&E staining, and Oil Red O staining of liver tissues from Lrg1KO mice and WT littermates treated with HFD for 16 weeks (scale bar: 100 μm). (H) Liver tissue, (I) iWAT, and (J) skeletal muscle tissue was isolated from HFD-fed Lrg1KO mice and control littermates injected with saline or insulin (n = 3/treatment group, 1.5 U/kg body weight, 5 minutes). Akt phosphorylation and protein levels in these tissues were determined by Western blot and quantified by Image J. Data in B and G are representative of 3 independent experiments. Data represent mean ± SEM. Unpaired 2-tailed t test, *P ≤ 0.05, **P ≤ 0.01, ***P ≤ 0.001, ****P ≤ 0.0001.
Figure 4
Figure 4. Identification of liver as a major target tissue of LRG1.
(A) Binding of SEAP or SEAP-LRG1 to frozen tissue sections prepared from male C57BL/6J mice (scale bar: 1000 μm for brain and liver, 500 μm for muscle, kidney, and heart). (B) Binding of SEAP-LRG1 to liver tissue with or without preincubation of purified Myc-His-tagged recombinant LRG1 (scale bar: 1000 μm). (C) Biodistribution of LRG1 in vivo 16 hours after i.v. injection. Organs isolated from mice injected with Vivo tag680 (Tag) or Vivo Tag680-LRG1(Tag-LRG1) were subjected to Epi-luminescence imaging (n = 3/group). The color bar indicates the intensity of florescence signal based on radiance values (photons/second/cm2/steradian). (D) Quantification of LRG1 in vivo biodistribution 16 hours after i.v. injection, data were calculated based on radiance values of each tissue (photons/second/cm2/steradian). (E) Epi-luminescence imaging measurement of biodistribution of LRG1 in vivo 48 hours after i.v. injection (n = 3 per group). (F) Quantification of LRG1 in vivo biodistribution 48 hours after i.v. injection. Data in A, B, C, and E are representative of 3 independent experiments. Data in D and F represent mean ± SEM. Unpaired 2-tailed t test, *P ≤ 0.05, **P ≤ 0.01, ***P ≤ 0.001.
Figure 5
Figure 5. LRG1 promotes insulin resistance through downregulation of IRS expression in hepatocytes.
(A) Dosage effect of LRG1 protein treatment on insulin signaling in hepatocytes. Primary hepatocytes from C57BL/6J mice were pretreated with different doses of LRG1 for 16 hours before treated with 10 nM insulin for 5 minutes. (B) Time effect of LRG1 protein treatment on insulin signaling in mouse primary hepatocytes. Cells were pretreated with LRG1 at 20 μg/mL for indicated lengths of time prior to stimulation with 10 nM insulin for 5 minutes. (C) Protein and/or its phosphorylation levels of insulin signaling components in primary hepatocytes treated with or without LRG1 (20 μg/mL, 16 hours) prior exposure to insulin (10 nM, 5 minutes) (n = 3/treatment group). (D) IRS1/2 protein levels in the liver tissue of WT and Lrg1KO mice after fed with HFD for 16 weeks (n = 4/group). (E) qPCR evaluation of G6Pase mRNA levels in hepatocytes treated with or without LRG1 (20 μg/mL) for 1 hour (n = 3/group). (F) The effect of LRG1 (20 μg/mL, 16 hours) on insulin-induced suppression of gluconeogenesis in mouse primary hepatocytes (n = 3/treatment group). Primary hepatocytes from C57BL/6J mice were treated with the reagents as indicated, the glucose release was then measured by colorimetric method. All cell experiments were independently repeated for 3 times. Data represent mean ± SEM. Unpaired 2-tailed t test for (CE). One-way ANOVA followed by Tukey’s test for F. *P ≤ 0.05, **P ≤ 0.01, ***P ≤ 0.001, ****P ≤ 0.0001.
Figure 6
Figure 6. LRG1 contributes to diet-induced hepatic steatosis through suppressing β-oxidation and promoting de novo lipogenesis.
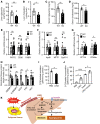
Lrg1KO mice and WT control mice were under HFD feeding for 16 weeks. (A) Liver triglyceride content, (B) liver cholesterol levels, (C) serum triglyceride contents, and (D) serum cholesterol levels of these mice were detected (n = 7 mice/group). qPCR determination of the expression of genes involved in lipid uptake (E), lipid export (F), and fatty acid β-oxidation (G) in the liver tissues of Lrg1KO and WT littermates fed a HFD for 16 weeks (n = 8–10 mice/group). (H) The relative lipogenic protein levels from the liver tissues of these mice as quantified from Western blots by Image J (4 mice/group). (I) Fatty acid β-oxidation in primary hepatocytes treated with PBS or LRG1 (20 μg/mL) overnight was determined by using 14C-labeled palmitic acid as substrate (n = 3/treatment group). (J) Lipogenesis in primary hepatocytes treated with LRG1 or insulin overnight was determined by using 14C-labeled acetic acid as a substrate (n = 3/treatment group). All cell experiments were independently repeated for 3 times. Data represent mean ± SEM. Unpaired 2-tailed t test for (AI). One-way ANOVA followed by Tukey’s test for J. *P ≤ 0.05, **P ≤ 0.01, ****P ≤ 0.0001. (K) A proposed model on the mechanism by which LRG1 mediates obesity-induced hepatic steatosis and insulin resistance. Obesity-induced LRG1 production in adipose tissue activates SREBP1 in the liver via an endocrinal mechanism, leading to enhanced de novo lipogenesis and suppressed fatty acid β-oxidation and consequent hepatic steatosis. LRG1 also inhibits insulin signaling by suppressing IRS1/2 expression, contributing to hepatic insulin resistance and hyperglycemia.

References

    1. Kwon H, Pessin JE. Adipokines mediate inflammation and insulin resistance. Front Endocrinol (Lausanne) 2013;4:71. - PMC - PubMed
    1. Rasouli N, Kern PA. Adipocytokines and the metabolic complications of obesity. J Clin Endocrinol Metab. 2008;93(11 suppl 1):S64–S73. - PMC - PubMed
    1. Kim S, Moustaid-Moussa N. Secretory, endocrine and autocrine/paracrine function of the adipocyte. J Nutr. 2000;130(12):3110S–3115S. doi: 10.1093/jn/130.12.3110S. - DOI - PubMed
    1. Rabe K, et al. Adipokines and insulin resistance. Mol Med. 2008;14(11-12):741–751. doi: 10.2119/2008-00058.Rabe. - DOI - PMC - PubMed
    1. Ouchi N, et al. Adipokines in inflammation and metabolic disease. Nat Rev Immunol. 2011;11(2):85–97. doi: 10.1038/nri2921. - DOI - PMC - PubMed

Publication types