

Analysis of Discrepancies Between Pulse Oximetry and Arterial Oxygen Saturation Measurements by Race and Ethnicity and Association With Organ Dysfunction and Mortality
- PMID: 34730820
- PMCID: PMC9178439
- DOI: 10.1001/jamanetworkopen.2021.31674
Analysis of Discrepancies Between Pulse Oximetry and Arterial Oxygen Saturation Measurements by Race and Ethnicity and Association With Organ Dysfunction and Mortality
Erratum in
-
Incorrect Numbers in eTable and Text.JAMA Netw Open. 2022 Feb 1;5(2):e221210. doi: 10.1001/jamanetworkopen.2022.1210. JAMA Netw Open. 2022. PMID: 35138406 Free PMC article. No abstract available.
Abstract
Importance: Discrepancies in oxygen saturation measured by pulse oximetry (Spo2), when compared with arterial oxygen saturation (Sao2) measured by arterial blood gas (ABG), may differentially affect patients according to race and ethnicity. However, the association of these disparities with health outcomes is unknown.
Objective: To examine racial and ethnic discrepancies between Sao2 and Spo2 measures and their associations with clinical outcomes.
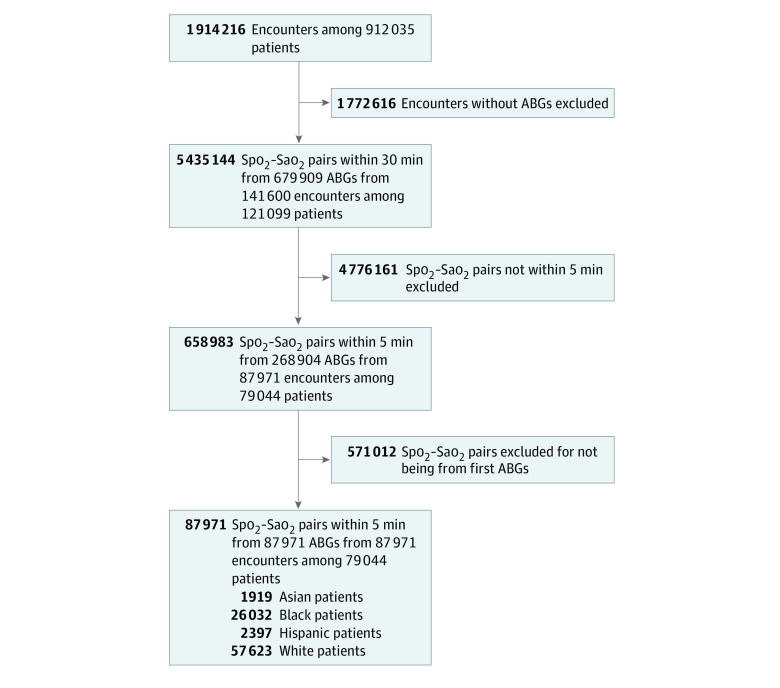
Design, setting, and participants: This multicenter, retrospective, cross-sectional study included 3 publicly available electronic health record (EHR) databases (ie, the Electronic Intensive Care Unit-Clinical Research Database and Medical Information Mart for Intensive Care III and IV) as well as Emory Healthcare (2014-2021) and Grady Memorial (2014-2020) databases, spanning 215 hospitals and 382 ICUs. From 141 600 hospital encounters with recorded ABG measurements, 87 971 participants with first ABG measurements and an Spo2 of at least 88% within 5 minutes before the ABG test were included.
Exposures: Patients with hidden hypoxemia (ie, Spo2 ≥88% but Sao2 <88%).
Main outcomes and measures: Outcomes, stratified by race and ethnicity, were Sao2 for each Spo2, hidden hypoxemia prevalence, initial demographic characteristics (age, sex), clinical outcomes (in-hospital mortality, length of stay), organ dysfunction by scores (Sequential Organ Failure Assessment [SOFA]), and laboratory values (lactate and creatinine levels) before and 24 hours after the ABG measurement.
Results: The first Spo2-Sao2 pairs from 87 971 patient encounters (27 713 [42.9%] women; mean [SE] age, 62.2 [17.0] years; 1919 [2.3%] Asian patients; 26 032 [29.6%] Black patients; 2397 [2.7%] Hispanic patients, and 57 632 [65.5%] White patients) were analyzed, with 4859 (5.5%) having hidden hypoxemia. Hidden hypoxemia was observed in all subgroups with varying incidence (Black: 1785 [6.8%]; Hispanic: 160 [6.0%]; Asian: 92 [4.8%]; White: 2822 [4.9%]) and was associated with greater organ dysfunction 24 hours after the ABG measurement, as evidenced by higher mean (SE) SOFA scores (7.2 [0.1] vs 6.29 [0.02]) and higher in-hospital mortality (eg, among Black patients: 369 [21.1%] vs 3557 [15.0%]; P < .001). Furthermore, patients with hidden hypoxemia had higher mean (SE) lactate levels before (3.15 [0.09] mg/dL vs 2.66 [0.02] mg/dL) and 24 hours after (2.83 [0.14] mg/dL vs 2.27 [0.02] mg/dL) the ABG test, with less lactate clearance (-0.54 [0.12] mg/dL vs -0.79 [0.03] mg/dL).
Conclusions and relevance: In this study, there was greater variability in oxygen saturation levels for a given Spo2 level in patients who self-identified as Black, followed by Hispanic, Asian, and White. Patients with and without hidden hypoxemia were demographically and clinically similar at baseline ABG measurement by SOFA scores, but those with hidden hypoxemia subsequently experienced higher organ dysfunction scores and higher in-hospital mortality.
Conflict of interest statement
Figures

References
-
- US Food and Drug Administration . Pulse oximeter accuracy and limitations: FDA safety communication. February 19, 2021. Accessed March 22, 2021. https://www.fda.gov/medical-devices/safety-communications/pulse-oximeter...
Publication types
MeSH terms
Substances
Grants and funding
LinkOut - more resources
Full Text Sources
Medical
