. 2021 Nov 5;7(45):eabg9518.
doi: 10.1126/sciadv.abg9518. Epub 2021 Nov 3.

Macrophages orchestrate the expansion of a proangiogenic perivascular niche during cancer progression

Affiliations

Macrophages orchestrate the expansion of a proangiogenic perivascular niche during cancer progression

James W Opzoomer et al. Sci Adv. .

Abstract

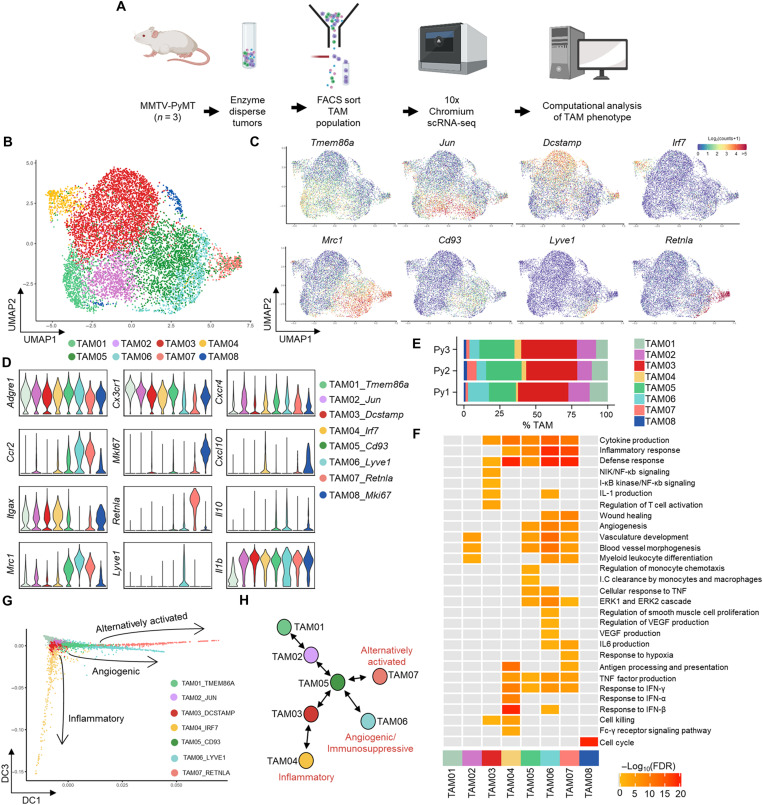
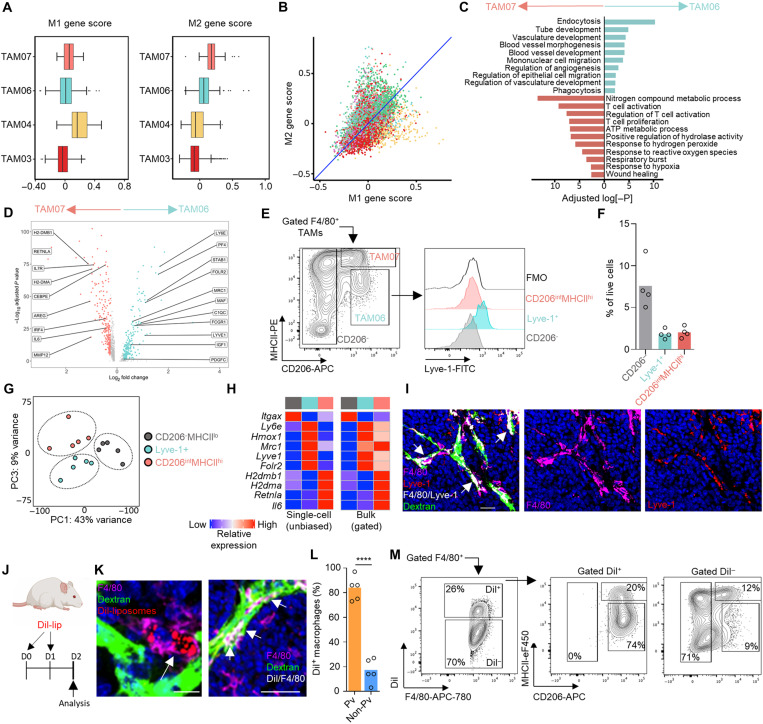
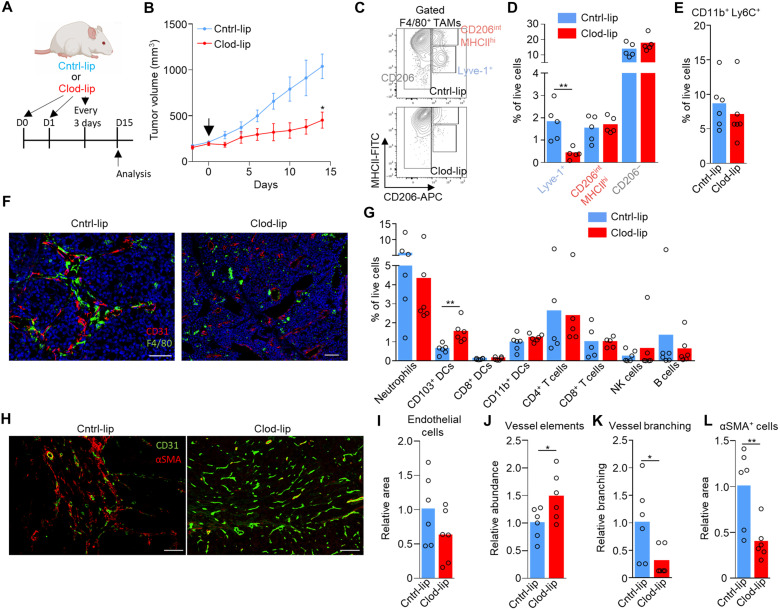
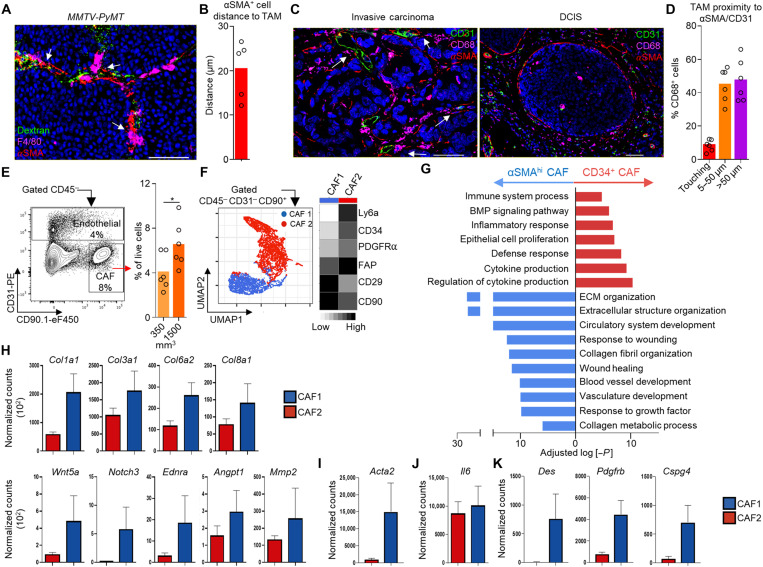
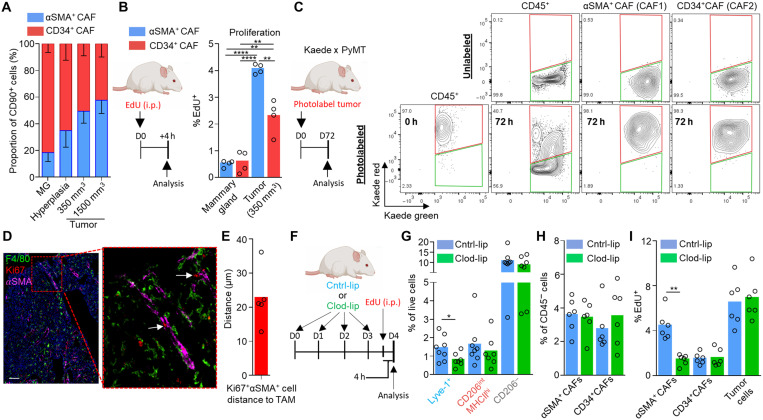
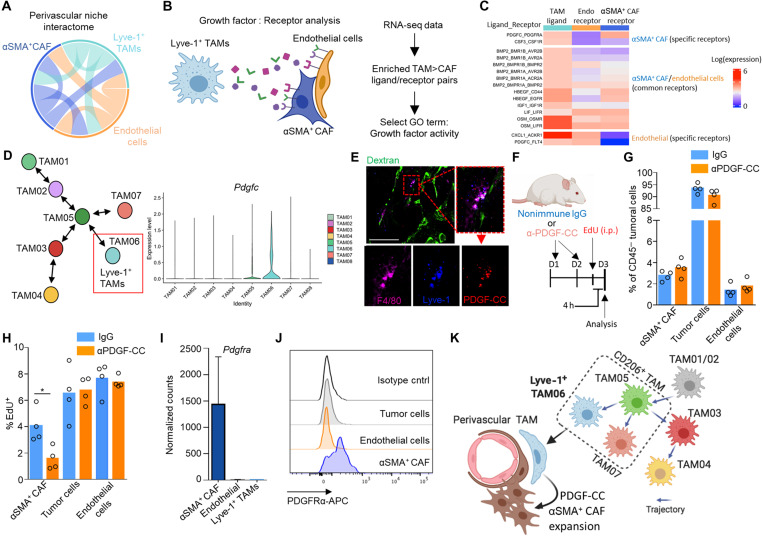
Tumor-associated macrophages (TAMs) are a highly plastic stromal cell type that support cancer progression. Using single-cell RNA sequencing of TAMs from a spontaneous murine model of mammary adenocarcinoma (MMTV-PyMT), we characterize a subset of these cells expressing lymphatic vessel endothelial hyaluronic acid receptor 1 (Lyve-1) that spatially reside proximal to blood vasculature. We demonstrate that Lyve-1+ TAMs support tumor growth and identify a pivotal role for these cells in maintaining a population of perivascular mesenchymal cells that express α-smooth muscle actin and phenotypically resemble pericytes. Using photolabeling techniques, we show that mesenchymal cells maintain their prevalence in the growing tumor through proliferation and uncover a role for Lyve-1+ TAMs in orchestrating a selective platelet-derived growth factor–CC–dependent expansion of the perivascular mesenchymal population, creating a proangiogenic niche. This study highlights the inter-reliance of the immune and nonimmune stromal network that supports cancer progression and provides therapeutic opportunities for tackling the disease.


Figures

Fig. 1.
Fig. 1.. scRNA-seq of TAMs in MMTV-PyMT tumors reveals three distinct polarization pathways.
(A) Schematic outlining the scRNA-seq experimental workflow that was conducted for n = 3 individual MMTV-PyMT tumors and mice, sequencing a total of 9039 cells using the 10x Genomics’ Chromium platform. (B) UMAP plot of sequenced TAMs colored by their associated cluster identity. (C) UMAP visualizations of predicted marker gene expression for distinct TAM clusters in (B). (D) Violin plots of selected genes associated with TAM cluster identity seen in (B). (E) Relative proportion of each TAM cluster across the individual MMTV-PyMT tumors analyzed. (F) Heatmap representing significantly up-regulated GO pathway terms in one or more TAM clusters. (G and H) Scatter plot of single cells projected into two dimensions using diffusion maps, where each cell (dot) is colored by cluster identity, labeled with diffusion component (DC) space annotation representing lineage trajectories predicted by the Slingshot package (G) and schematic map of each TAM cluster’s location along the respective trajectories (H).
Fig. 2.
Fig. 2.. Lyve-1 marks a subset of TAMs that reside proximal to blood vasculature.
(A and B) Box and whisker plots (A) and scatter plot (B) showing normalized mean M1- and M2-associated gene scores across the indicated TAM clusters identified using scRNA-seq. (C and D) Subset unique, significantly up-regulated GO terms (C) and individual genes (D) between the two subsets of protumoral TAM. (E) FACS-gated live [7-aminoactinomycin D–negative (7AAD)] F4/80hi TAMs from enzyme-dispersed MMTV-PyMT tumors separated on the basis of CD206 and MHCII expression (left) and assessed for Lyve-1 expression (right; color-shaded histograms) against that of the fluorescence minus one staining (FMO) control (open black line). (F) Quantification of the gated populations in (E) (n = 4 tumors). (G) PCA plot of the 2000 most variable genes from the bulk-sequenced TAM populations (n = 5 tumors), using CD206 and MHCII TAMs as a comparator. (H) Heatmaps comparing the relative expression of selected differentially expressed genes identified in the scRNA-seq (left) and bulk RNA-seq (right); population color is indicative of the populations identified in (G). (I) Representative image of a frozen section of MMTV-PyMT tumor showing DAPI (nuclei; blue); intravenous dextran marking vasculature (green), F4/80 (magenta), and Lyve-1 (red); and colocalizing pixels for Lyve-1 and F4/80 (white); scale bars, 25 μm. (J to M) Schematic for experimental approach to label pvTAMs using Dil-labeled liposomes (J). (K) Representative images of frozen sections of MMTV-PyMT tumors showing DAPI (nuclei; blue); intravenous dextran marking vasculature (green), Dil (red), and F4/80 (magenta); and Dil/F4/80 colocalizing pixels (white) (right panel alone); scale bars, 25 μm (left) and 50 μm (right). (L) Quantification of the spatial location of Dil+ F4/80+ TAMs (n = 5 mice). (M) Analysis of the surface phenotype of Dil+/− TAM from enzyme-dispersed tumors within the F4/80+ gate. Box and whisker plots; boxes show median and quartiles. Bar charts represent mean, and the dots show individual tumors and mice. ****P < 0.0001.
Fig. 3.
Fig. 3.. Lyve-1+ pvTAM depletion slows tumor growth and is associated with a concurrent loss of perivascular αSMA+ stromal cells.
(A) Schematic for experimental approach and dosing strategy to deplete Lyve-1+ TAMs using clodronate-filled liposomes. Arrows represent days of treatment. (B) Growth curves of MMTV-PyMT tumors in mice treated with control PBS-filled liposomes (Cntrl-lip) or clodronate-filled liposomes (Clod-lip) as shown in (A); arrow marks the initiation of treatment (cohorts of n = 6 mice). (C to L) Tumors from (B) were excised at day 15 (after treatment initiation; n = 5 to 6 tumors) and analyzed. (C) Representative contour plot gating of live (7AAD) CD45+Ly6CF4/80+ TAMs from enzyme-dispersed MMTV-PyMT tumors measured by flow cytometry and the abundance of the gate subsets (D). (E) Abundance of live (7AAD) CD45+CD11b+Ly6C+ monocytes. (F) Representative image of a frozen section of MMTV-PyMT tumor from mice treated with control- or clodronate-filled liposomes stained with DAPI (nuclei; blue) and antibodies against F4/80 (green) and CD31 (red). Scale bars, 50 μm (left) and 100 μm (right). (G) Abundance of major immune cell types in the tumor microenvironment measured by flow cytometry. (H to L) Representative image of a frozen section of MMTV-PyMT tumor stained with antibodies against CD31 (green) and αSMA (red) [scale bars, 100 μm (left and right)] (H), and the quantification of relative CD31+ pixel area (I), number of distinct CD31+ endothelial vessel elements as assessed using immunofluorescence analysis of stained frozen tissue sections (a total of n = 12 sections, across n = 6 mice per condition) (J), vessel branch points (K), and αSMA+ pixel area (L). A total of n = 12 sections were analyzed across the six tumors in each cohort. Growth curve is presented as mean ± SEM, bar charts represent mean, and the dots show individual data points from individual tumors and mice. *P < 0.05 and **P < 0.01.
Fig. 4.
Fig. 4.. Lyve-1+ TAMs form a perivascular niche with proangiogenic pericyte-like αSMA+ CAFs.
(A) Representative image of a frozen section of MMTV-PyMT tumor stained with DAPI (nuclei; blue) and antibodies against F4/80 (magenta) and αSMA (red); functional vasculature was labeled in vivo using intravenous dextran-FITC (green). (B) Quantification of αSMA+ cell median distance from F4/80+ TAM from immunofluorescence images (n = 5). (C) Representative image of an FFPE section from human invasive ductal mammary carcinoma (left) and DCIS (right) stained with DAPI (nuclei; blue) and antibodies against CD31 (green), CD68 (magenta), and αSMA (red); images representative of four to six patients. (D) Quantification of the spatial position of CD68+ TAM in proximity to SMA+ stroma touching CD31+ vessels (<50 μm is regarded perivascular) across multiple regions of interest (n = 5 tumors). (E) Representative flow cytometry gating strategy for live (7AAD) CD45 cells and CD31+ endothelial cells and CD90+ CAFs (left) and the abundance of CAFs at different tumor volumes (right); n = 6 mice per condition. (F) Identification of CAF subsets by unsupervised clustering from multiparametric flow cytometry data using the markers shown in the heatmap (right). UMAP plot shows individual cells colored by their unsupervised clustering assignment (left); n = 4 mice. (G to K) Bulk RNA-sequenced CAF subsets from MMTV-PyMT tumor (n = 5 mice) transcriptomes were investigated. GO pathway analysis and plot show the selected GO terms based on differentially expressed genes of the two CAF subsets (G), and bar plots depict normalized gene expression values for the indicated genes associated with angiogenesis (H), Acta2 (I), and Il6 (J) and pericyte-associated markers (K). Differences in gene expression in (H), (I), and (K) are all P < 0.0001. Bar charts represent mean, error bars represent SD, and the dots show individual data points from individual tumors and mice. Scale bars, 50 μm. *P < 0.05.
Fig. 5.
Fig. 5.. Lyve-1+ TAMs orchestrate αSMA+ CAF expansion within the perivascular niche of the tumor.
(A) Abundance of the respective CAF populations during distinct stages of tumor progression; n = 6 mice per stage. MG, mammary gland. (B) Schematic for experimental approach and dosing EdU into MMTV-PyMT mice to assess in vivo proliferation (left) and proportion EdU+ cells within each CAF subset (right). i.p., intraperitoneally. (C) Established tumors in Kaede MMTV-PyMT mice were photoconverted to Kaede-red, and then at 72 hours after photoconversion, tumors were analyzed (schematic left) for their respective Kaede-red/green proportion using flow cytometry for evidence of peripheral recruitment (Kaede-green cells). A representative unconverted tumor is shown for comparison (right top). (D and E) Representative image of a frozen section of MMTV-PyMT tumor stained with antibodies against F4/80 (green), αSMA (magenta), and the proliferation marker Ki67 (red). White arrows show αSMA+Ki67+ cells in contact with F4/80+ TAMs (D) and quantification of Ki67+αSMA+ cell median distance from F4/80+ TAMs quantified from immunofluorescence images across multiple tumors (n = 5) (E). (F to I) Schematic for experimental approach and dosing strategy to acutely deplete Lyve-1+ pvTAM with clodronate-filled liposome treatment for 4 days (F). (G) Abundance of TAM populations following control- or clodronate-filled liposome treatment (n = 6 mice Cntrl-lip and n = 5 mice Clod-lip). (H) Abundance of CD45 cell populations (cohorts of n = 6 mice) after 4 days of treatment with either control- or clodronate-filled liposomes. (I) Proportion of EdU+ cells within each CD45 cell subset (cohorts of n = 6 mice). Bar charts represent mean, error bars represent SD, and the dots show individual data points from individual tumors and mice. *P < 0.05, **P < 0.01, and ****P < 0.0001.
Fig. 6.
Fig. 6.. Lyve-1+ TAMs communicate to αSMA+ CAFs in the perivascular niche via a pro-proliferative PDGF-CC:PDGFR-α interaction.
(A) Circos plot showing predicted cross-talk of perivascular ligand-receptor interactions as identified by CellPhoneDB from the respective RNA-seq datasets. Outer sectors and links between sectors are weighted according to the total number of annotated ligand-receptor interactions between each respective cell type. (B) Schematic representing the method of cell type ligand-receptor interactome generation. (C) Heatmap showing the Lyve-1+ TAM and αSMA+ CAF population-specific secretome generated using data from (A) and the method outlined in (B) diagram displaying the ligand:receptor pairs between Lyve-1+ TAMs and αSMA+ CAFs and endothelial cells. The analysis highlighted a unique PDGF-CC:PDGFRα interaction specific to Lyve-1+ TAMs and αSMA+ CAFs. (D) Schematic map of each TAM cluster’s location along the respective trajectories marking the Lyve-1+ TAM population (left) and violin plots of Pdgfc expression associated with TAM clusters (right). (E) Representative image of a frozen section of MMTV-PyMT tumor stained with antibodies against F4/80 (magenta), Lyve-1 (blue), and PDGF-CC (red); the vessels are marked by dextran (green). Scale bar 50mm. (F to H) Schematic for experimental approach and dosing strategy to acutely inhibit PDGF-CC signaling using an anti–PDGF-CC neutralizing antibody (F). Abundance of indicated cell populations (G). Proportion of EdU+ cells within each CD45 cell subset (cohorts of n = 4 mice) (H). (I) Bar plot depicting normalized gene expression values for Pdgfra in the bulk RNA-sequenced populations (left) across n = 5 mice. (J) Representative histograms of surface PDGFRα staining on the indicated cells against isotype antibody staining of gated populations using flow cytometry analysis from enzyme-dispersed MMTV-PyMT tumors. (K) Schematic overview of the perivascular niche. Images in (B) and (K) were created using BioRender software. Bar charts represent mean, and the dots show individual data points from individual tumors and mice; error bars represent SD. *P < 0.05.

References

    1. Arnold J. N., Magiera L., Kraman M., Fearon D. T., Tumoral immune suppression by macrophages expressing fibroblast activation protein-α and heme oxygenase-1. Cancer Immunol. Res. 2, 121–126 (2014). - PMC - PubMed
    1. Garner H., de Visser K. E., Immune crosstalk in cancer progression and metastatic spread: A complex conversation. Nat. Rev. Immunol. 20, 483–497 (2020). - PubMed
    1. Noy R., Pollard J. W., Tumor-associated macrophages: From mechanisms to therapy. Immunity 41, 49–61 (2014). - PMC - PubMed
    1. Muliaditan T., Caron J., Okesola M., Opzoomer J. W., Kosti P., Georgouli M., Gordon P., Lall S., Kuzeva D. M., Pedro L., Shields J. D., Gillett C. E., Diebold S. S., Sanz-Moreno V., Ng T., Hoste E., Arnold J. N., Macrophages are exploited from an innate wound healing response to facilitate cancer metastasis. Nat. Commun. 9, 2951 (2018). - PMC - PubMed
    1. Cassetta L., Fragkogianni S., Sims A. H., Swierczak A., Forrester L. M., Zhang H., Soong D. Y. H., Cotechini T., Anur P., Lin E. Y., Fidanza A., Lopez-Yrigoyen M., Millar M. R., Urman A., Ai Z., Spellman P. T., Hwang E. S., Dixon J. M., Wiechmann L., Coussens L. M., Smith H. O., Pollard J. W., Human tumor-associated macrophage and monocyte transcriptional landscapes reveal cancer-specific reprogramming, biomarkers, and therapeutic targets. Cancer Cell 35, 588–602.e10 (2019). - PMC - PubMed