. 2021 Nov 3;13(618):eabh4284.
doi: 10.1126/scitranslmed.abh4284. Epub 2021 Nov 3.

Restoring activity in the thalamic reticular nucleus improves sleep architecture and reduces Aβ accumulation in mice

Affiliations

Restoring activity in the thalamic reticular nucleus improves sleep architecture and reduces Aβ accumulation in mice

Rohan Jagirdar et al. Sci Transl Med. .

Erratum in

Abstract

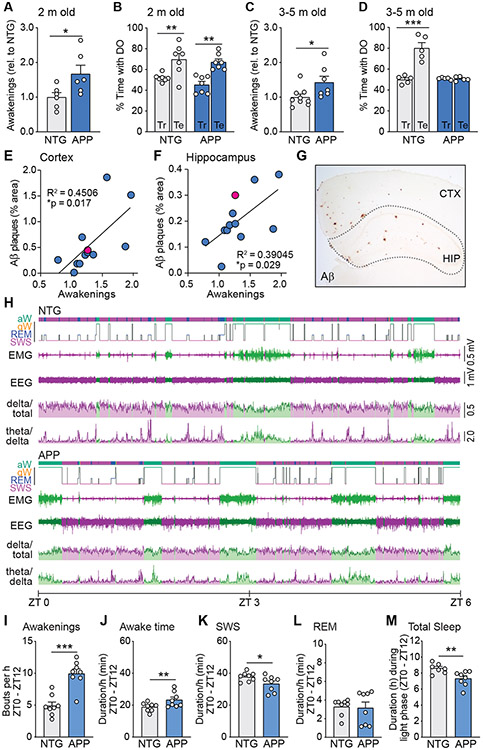
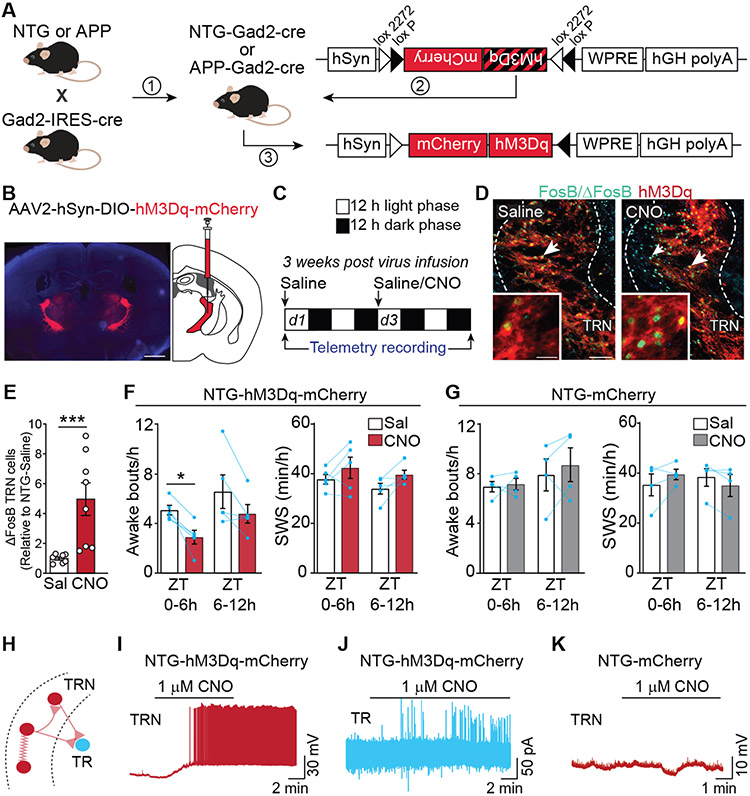
Sleep disruptions promote increases of amyloid β (Aβ) and tau in the brain and increase Alzheimer’s disease (AD) risk, but the precise mechanisms that give rise to sleep disturbances have yet to be defined. The thalamic reticular nucleus (TRN) is essential for sleep maintenance and for the regulation of slow-wave sleep (SWS). We examined the TRN in transgenic mice that express mutant human amyloid precursor protein (APP) and found reduced neuronal activity, increased sleep fragmentation, and decreased SWS time as compared to nontransgenic littermates. Selective activation of the TRN using excitatory DREADDs restored sleep maintenance, increased time in SWS, and reduced amyloid plaque load in both hippocampus and cortex. Our findings suggest that the TRN may play a major role in symptoms associated with AD. Enhancing TRN activity might be a promising therapeutic strategy for AD.


Figures

Fig. 1.
Fig. 1.. Development of sleep disturbances, memory impairment, and amyloid deposition in APP mice.
Awakenings (A) and spatial memory performance (B) of APP mice at 2 months of age, during the 12-hour light phase. The time that NTG and APP mice spent with the displaced object during testing (Te) and training (Tr) in the object location memory task was used to assess spatial memory. (E to G) Relationship between awakenings from sleep (relative to NTG mice) and amyloid deposition in cortex (E) and hippocampus (F) in APP mice at 6 months of age. Plaque burden shown in (G) indicated by red data points. Example of sleep hypnogram (H) for Zeitgeber Time 0 (ZT0, when lights turn on) to ZT6, generated from wireless EEG-EMG telemetry data (aw: active wake, qw: quiet wake, REM: rapid eye movement sleep, SWS: slow wave sleep). Traces from EMG and EEG, delta ratio (delta/total power in EEG), and theta/delta ratio in 2-3-month-old NTG and APP mice. (I to M) Telemetry data from NTG and APP mice during the 12-hour light phase (ZT0 – ZT12) was analyzed to quantify the number of awakenings (I), time spent awake (J), time in SWS (K), time in REM sleep (L), and total sleep time over the entire 12-hour light phase (M). Bars, mean ± SEM. Circles, individual mice. *p ≤ 0.05, **p < 0.01 using unpaired Student’s t-test (A, C) or Pearson correlation coefficients (E, F). **p < 0.01, ***p < 0.001 using Bonferroni post-hoc test after 2-way repeated measures ANOVA (B, D). For B, there was a significant effect of test/training phase (F(1,12) = 29.90, p = 0.0001) but no effect of genotype (F(1,12) = 1.552, p = 0.2366) or interaction (F(1,12) = 0.2941, p = 0.5976). For D, there was a significant effect of test/training phase (F(1,8) = 27.94, p = 0.0007), of genotype (F(1,8) = 27.12, p = 0.0008), and interaction (F(1,8) = 0.28.85, p = 0.0007).
Fig. 2.
Fig. 2.. DREADD-induced activation of TRN and modulation of sleep.
(A) AAV expression of double inverted (DIO) cassette carrying hM3Dq in frame with mCherry enables hM3Dq expression in GABAergic cells of Gad2-IRES-cre mice. (B) hM3Dq expression in GABAergic cells of the TRN was achieved by stereotactically infusing AAV2-hSyn-DIO-hM3Dq-mCherry bilaterally into the TRN of 2–3 month old NTG mice; scale bar = 1 mm. (C) 3 weeks after infusion of AAV2-hSyn-DIO-hM3Dq-mCherry or AAV2-hSyn-mCherry into the TRN, mice received saline IP at the start of the light phase (ZT0) on Day 1, followed by saline or CNO at ZT0 on Day 3, with EEG/EMG recording throughout. (D) Example images illustrating FosB/ΔFosB-expression (green) in cells that express hM3Dq (red) denoted by white arrows, in mice treated with saline or with CNO; scale bar = 100 μm. Insets show higher magnification images; scale bar = 25 μm. (E) Quantification of ΔFosB-expressing TRN neurons after CNO treatment. (F) In NTG-hM3Dq-mCherry mice, sleep was quantified after CNO and compared to saline baseline. Graphs show quantification of awakenings and SWS during ZT 0-6h (n = 5; RM ANOVA for Time × Treatment, *p < 0.05 with Bonferroni post-hoc test). Bars, mean ± SEM. (G) In NTG-mCherry mice that do not express hM3Dq, the effects of CNO on awakenings and SWS sleep were quantified (n = 4; RM ANOVA for Time × Treatment with Bonferroni post-hoc test). (H) Schematic of thalamic circuitry probed during in vitro recordings. (I) Current-clamp recordings in TRN neurons in thalamic slices from hM3Dq-expressing mice show effect of bath application of CNO on action potential activity. (J) Voltage clamp recordings in downstream thalamic relay (TR) neurons reveal inhibitory postsynaptic currents following CNO application. (K) Effect of CNO on TRN neuronal firing in slices from animals expressing only mCherry.
Fig. 3.
Fig. 3.. Modulation of sleep in APP mice by acute activation of TRN neurons using a single dose of CNO.
(A) APP-Gad2-cre mice received stereotactic infusions of AAV2-hSyn-DIO-hM3Dq-mCherry bilaterally into the TRN. (B) 3 weeks after AAV infusion, mice received saline IP at the start of the light phase (ZT0) on Day 1, then saline or CNO at ZT0 on Day 3, with EEG-EMG recording throughout. (C) Example of sleep hypnogram generated from EEG and EMG signal analysis after saline on Day 1 (top) and CNO on Day 3 (bottom), illustrating awakenings and SWS (red lines) after saline or CNO. aW, active wake; qW, quiet wake; REM, REM sleep; SWS, slow wave sleep. Neck muscle EMG, frontal lobe EEG and delta ratio, and spectrograms are shown for ZT 0-6 h. (D to G) Quantification of sleep parameters in APP mice after saline on Day 1 and after CNO on Day 3. The effect of CNO on APP-hM3Dq mice during ZT 0-6h and ZT 6-12h is shown for awakenings (D), time spent awake (E), SWS (F), and REM sleep (G). (H to J) Sleep parameters were compared between APP-hM3Dq mice that received CNO, APP-hM3Dq mice that received saline, and NTG-hM3Dq mice that received saline, on Day 3. Number of awakenings (H), time spent awake (I), and SWS (J), are shown for comparison of the three groups. Bars, mean ± SEM. n = 6 mice (D to G) or 6-8 mice/group (H to J); repeated measures ANOVA for Time x Treatment, *p < 0.05, **p < 0.01, ***p < 0.001 with Bonferroni post-hoc test.
Fig. 4.
Fig. 4.. Effect of chronic activation of the TRN on sleep and amyloid plaque deposition.
(A) 6-month-old APP-Gad2-cre mice received stereotactic infusions of AAV2-hSyn-DIO-hM3Dq-mCherry bilaterally into TRN. (B) 3 weeks after AAV infusion, mice received saline IP at the start of the light phase (ZT0) on Day 1, then on Day 3 began a 30-day treatment of daily injections of either saline or CNO at ZT0 each day, with EEG-EMG recording every fifth day as indicated. (C to F) Effect of chronic activation of TRN on sleep. 2-way repeated measures ANOVA were used to assess effects of CNO on awakenings (C) and SWS (D). Effect of treatment is indicated by the vertical bracket and black asterisks. Dunnett’s post-hoc tests indicate effect of saline or CNO on awakenings and SWS compared to baseline saline injection prior to CNO administration (blue asterisks above or below individual data points). For C, Treatment: F(1, 88) = 84.81, ***p < 0.0001); Days: F(7, 88) = 2.995, **p = 0.0072. For D, Treatment: F(1, 88) = 35.31; ***p < 0.0001; Days: F (7, 88) = 3.490; **p = 0.0024. (E) Effect of CNO on REM sleep (Treatment: F(1, 88) = 0.7066, p = 0.4029; Days: F(7, 88) = 0.3945; p = 0.9032). Effect of CNO on total sleep (F) (Treatment: F(1, 88) = 13.04, ***p = 0.0005; Days: F(7, 88) = 1.992; p = 0.0651). (G and H) Amyloid plaque burden in the hippocampus (HIP) and cortex (CTX) was assessed via Aβ immunostaining (G). Quantification of amyloid plaque burden (H) demonstrates plaque burden in APP-hM3Dq mice treated with CNO (right) compared to saline (left). Red data points indicate animals shown in (G). *p = 0.0265, unpaired Student’s t-test. (I) ΔFosB-expressing cells were quantified in APP-hM3Dq mice treated with saline or CNO to confirm whether CNO treatment increased the number of TRN cells expressing ΔFosB. **p = 0.0011, unpaired Student’s t-test. Graphs show mean ± SEM. n=5/saline and 8/CNO group (C to F), n = 12-13/group (H) and n = 14/group (I). Scale bar, 500 μm (G).
Fig. 5.
Fig. 5.. Expression of an activity-dependent marker in TRN of patients with MCI or AD.
(A) Micrographs showing FosB/ΔFosB expression (black arrows) in TRN cells (left) and VLN (right) of age-matched control (CTL), patients with MCI, and patients with AD, with Braak stage indicated in parentheses. (B) Anterior-posterior (A-P) location of area of TRN from which sections were obtained (blue box). (C) Higher magnification of FosB/ΔFosB staining. (D) Quantification demonstrates FosB/ΔFosB-expressing cells in patients with MCI or AD compared to controls. (E) Relationship between Braak stage and the degree of decrease in FosB/ΔFosB-expressing cells. (F) Hematoxylin-eosin staining was used to assess the overall number of cells in TRN or VLN in patients with MCI or AD. Arrowheads indicate examples of hematoxylin-eosin-stained cells. (G) Expression of NeuN-expressing neurons was used to assess the number of neurons in the TRN of controls, patients with MCI, or patients with AD. (H) Relationship between the numbers of NeuN-expressing neurons and FosB/ΔFosB-expressing cells in the TRN of controls, patients with MCI, or patients with AD. (I) Micrographs illustrate the presence of NeuN-expressing neurons in the TRN and VLN of controls, patients with MCI, or patients with AD. VLN: ventrolateral thalamic nucleus. Arrowheads indicate examples of NeuN-expressing cells. n = 15 (controls), 3 (MCI), 10 (AD). **p < 0.01 in ANOVA (D) or Pearson’s correlation (E). Scale bars: 300 μm (A), 100 μm (C, F, and I).

References

    1. Mander BA, Local Sleep and Alzheimer's Disease Pathophysiology. Front Neurosci 14, 525970 (2020). - PMC - PubMed
    1. Mander BA, Winer JR, Jagust WJ, Walker MP, Sleep: A Novel Mechanistic Pathway, Biomarker, and Treatment Target in the Pathology of Alzheimer's Disease? Trends Neurosci 39, 552–566 (2016). - PMC - PubMed
    1. Minakawa EN, Wada K, Nagai Y, Sleep Disturbance as a Potential Modifiable Risk Factor for Alzheimer's Disease. Int J Mol Sci 20, 803 (2019). - PMC - PubMed
    1. Sprecher KE et al., High Resolution Topography of Age-Related Changes in Non-Rapid Eye Movement Sleep Electroencephalography. PLoS One 11, e0149770 (2016). - PMC - PubMed
    1. Varga AW et al., Reduced Slow-Wave Sleep Is Associated with High Cerebrospinal Fluid Aβ42 Levels in Cognitively Normal Elderly. Sleep 39, 2041–2048 (2016). - PMC - PubMed

Publication types

Substances