Comparative Study
. 2021 Nov 2;37(5):109915.
doi: 10.1016/j.celrep.2021.109915.

Dissecting mammalian spermatogenesis using spatial transcriptomics

Affiliations
Comparative Study

Dissecting mammalian spermatogenesis using spatial transcriptomics

Haiqi Chen et al. Cell Rep. .

Abstract

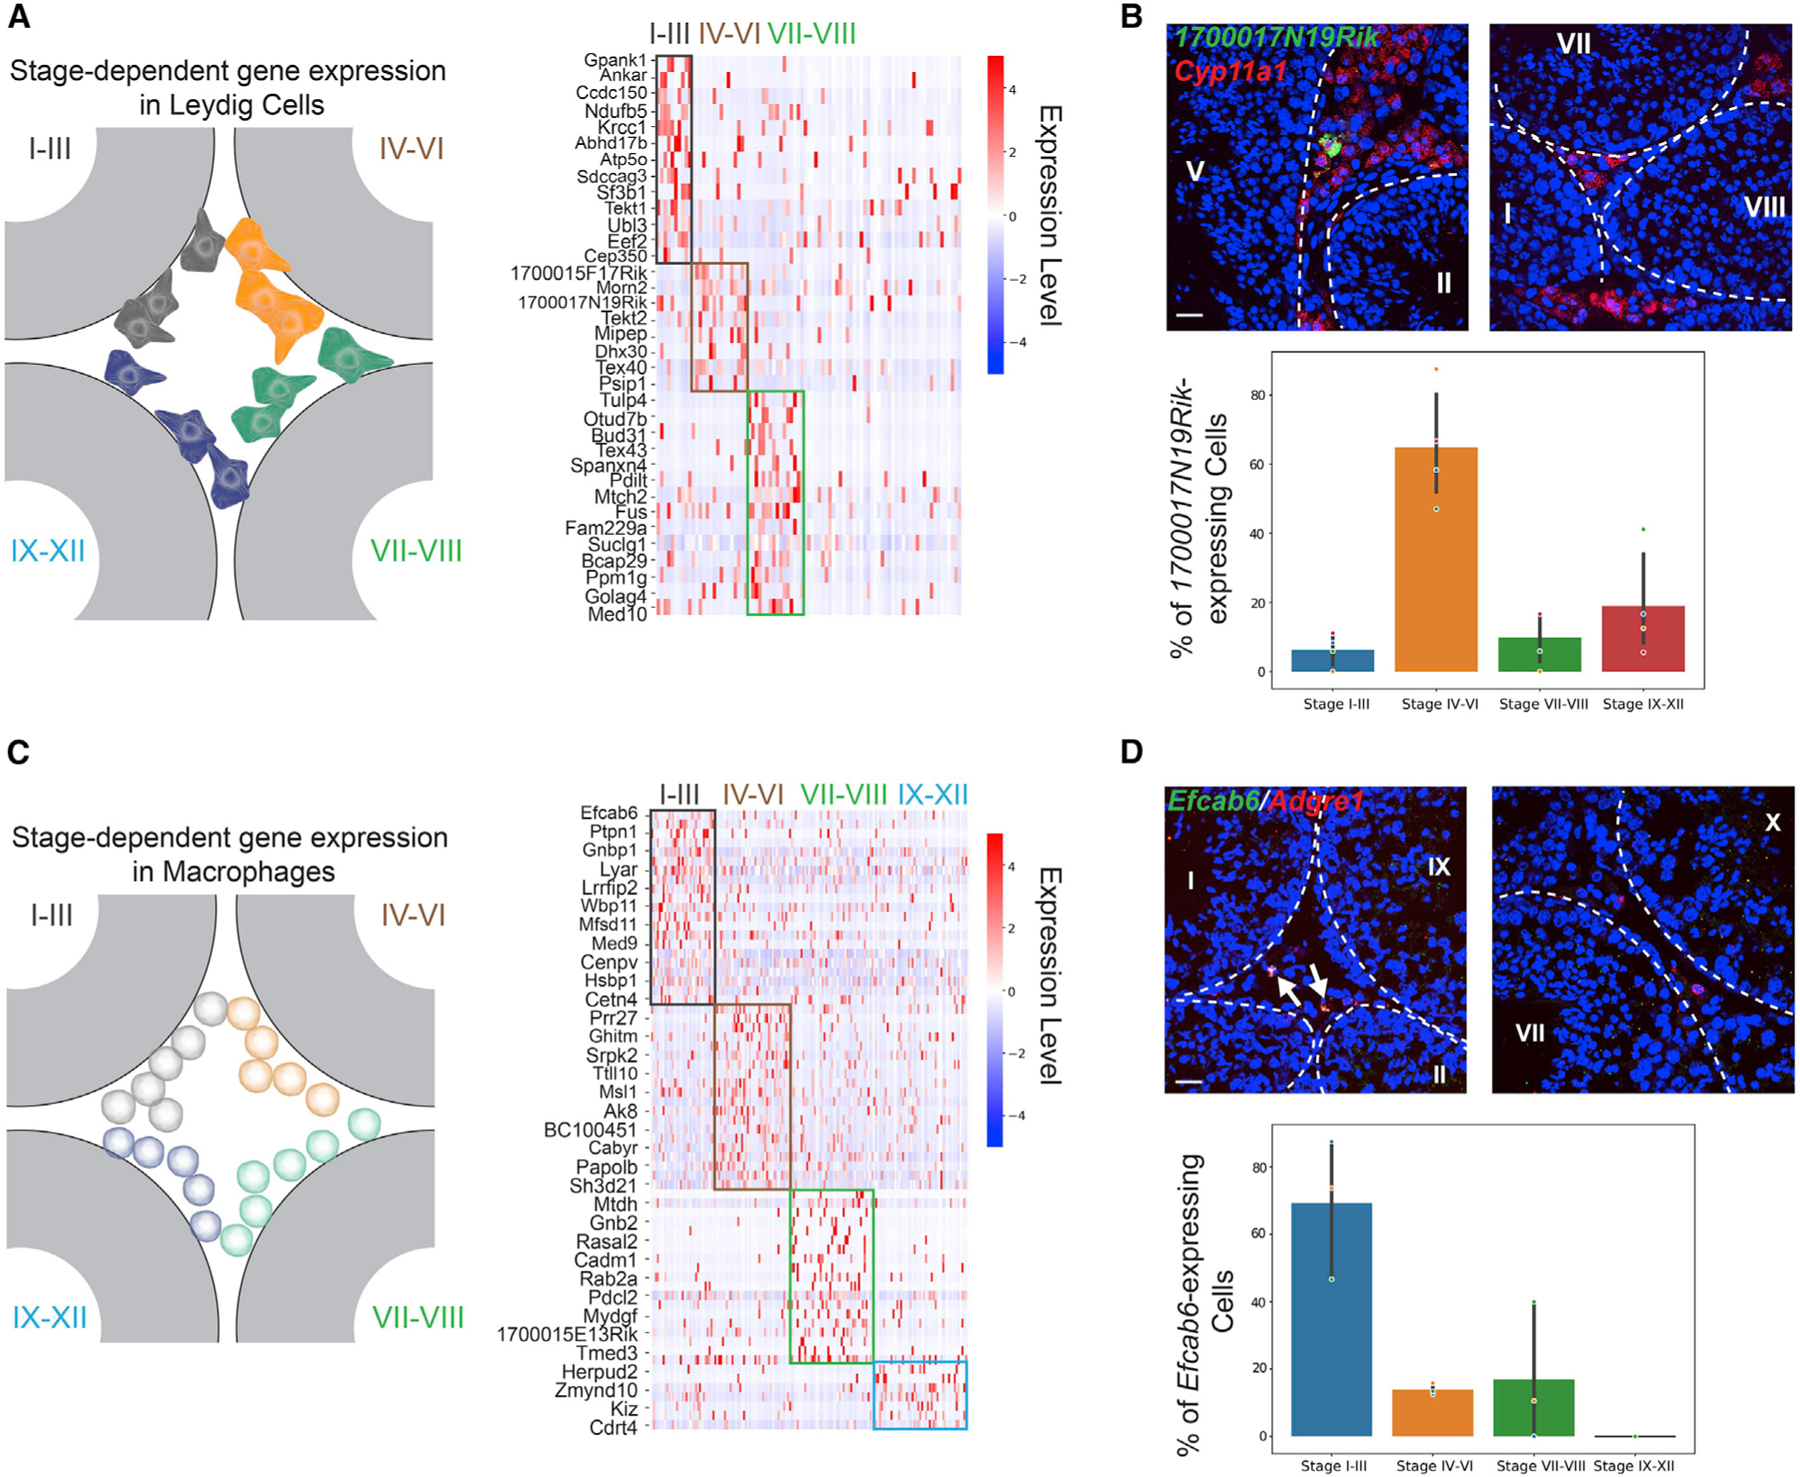
Single-cell RNA sequencing has revealed extensive molecular diversity in gene programs governing mammalian spermatogenesis but fails to delineate their dynamics in the native context of seminiferous tubules, the spatially confined functional units of spermatogenesis. Here, we use Slide-seq, a spatial transcriptomics technology, to generate an atlas that captures the spatial gene expression patterns at near-single-cell resolution in the mouse and human testis. Using Slide-seq data, we devise a computational framework that accurately localizes testicular cell types in individual seminiferous tubules. Unbiased analysis systematically identifies spatially patterned genes and gene programs. Combining Slide-seq with targeted in situ RNA sequencing, we demonstrate significant differences in the cellular compositions of spermatogonial microenvironment between mouse and human testes. Finally, a comparison of the spatial atlas generated from the wild-type and diabetic mouse testis reveals a disruption in the spatial cellular organization of seminiferous tubules as a potential mechanism of diabetes-induced male infertility.


Conflict of interest statement

Declaration of interests F.C. and E.Z.M. are listed as inventors on a pending patent application related to the development of Slide-seq. F.C. and E.Z.M. are paid consultants of Atlas Bio. The remaining authors declare no competing interests.

Figures

Figure 1.
Figure 1.. Establishment of the mouse testicular spatial transcriptome atlas
(A) Sequence schematic of the Slide-seq bead oligonucleotides. (B) Slide-seq workflow for testicular samples. (C) Spatial mapping of testicular cell types. ES, elongating/elongated spermatid; RS, round spermatid; SPC, spermatocyte; SPG, spermatogonium. Scale bar, 300 μm. (D) Spatial mapping of individual testicular cell types. Scale bar, 300 μm. (E) Pseudotime reconstruction of the germ cell developmental trajectory. Scale bar, 300 μm. (F) Digital segmentation of the seminiferous tubules. Scale bar, 300 μm. (G) UMAP projection of the seminiferous tubules in gene expression space. Tubule clusters were colored by genes with known stage-specific expression patterns. (H) Spatial mapping of the four stage clusters. Scale bar, 300 μm.
Figure 2.
Figure 2.. Systematic identification of spatially patterned (SP) genes in the seminiferous tubules
(A) The number of genes with previously known spatial patterns versus the number of newly identified genes using the spatial transcriptome atlas at each stage of the seminiferous epithelium cycle. (B) The spatial expression pattern of Smcp and Lyar revealed by both the spatial transcriptome atlas and single-molecule fluorescence in situ hybridization (smFISH). Scale bars represent 30 μm for the digitally reconstructed seminiferous tubule images and 50 μm for the smFISH images. (C) The spatial transcriptome atlas reveals the stage-dependent spatial expression pattern of Tnp1. ES, elongating/elongated spermatid; RS, round spermatid; SPC, spermatocyte; SPG, spermatogonium. (D) Gene ontology (GO) enrichment analysis on SP genes of the four stage clusters. (E) The temporal expression dynamics of SP genes enriched in nucleus organization during spermiogenesis. (F) The spatial transcriptome atlas and smFISH reveal the stage-dependent spatial expression pattern of Habp4. (G) Co-localization of Habp4 protein with the acetylated histone 4 (Acetyl H4) in mouse and human spermatids. Scale bars represent 40 μm for mouse images and 10 μm for the inset. Scale bars represent 40 μm for human images and 15 μm for the inset.
Figure 3.
Figure 3.. Stage-dependent gene expression patterns in Leydig cells and macrophages
(A) Left: schematic of the spatial localizations of Leydig cells. Right: genes exhibiting stage-dependent expression patterns in Leydig cells. (B) Upper panel:1700017N19Rik-expressing Leydig cells (marked by Cyp11a1) localize near a stage IV–VI seminiferous tubule, but not close to tubules at other stages. The basement membrane is outlined by white dashed lines. Scale bar, 20 μm. Lower panel: bar graph summarizing the percentages of 1700017N19Rik-expressing Leydig near seminiferous tubules at different stage groups. One-way ANOVA, p < 10−4, n = 4 biological replicates. (C) Left: schematic of the spatial localizations of macrophages. Right: genes exhibiting stage-dependent expression patterns in macrophages. (D) Upper panel: Efcab6-expressing macrophages (marked by Adgre1) localize near stage I–III seminiferous tubules, but not close to tubules at other stages. The basement membrane is outlined by white dashed lines. Scale bar, 20 μm. Lower panel: bar graph summarizing the percentages of Efcab6-expressing macrophages near seminiferous tubules at different stage groups. One-way ANOVA, p < 0.005. n = 3 biological replicates.
Figure 4.
Figure 4.. Differential stem cell microenvironment in mouse versus human testes
(A) Spatial mapping of mouse undifferentiated and differentiating spermatogonia using the Slide-seq data. Scale bar, 300 μm. (B) K nearest neighbor (KNN) approach to calculate cell-type compositions in the microenvironment surrounding each mouse spermatogonium using Slide-seq data. Comparison of cell-type compositions of the microenvironment surrounding undifferentiated versus differentiating spermatogonia with K = 5 neighbors is shown here. Plots showing K = 10 and 15 are shown in Figure S5B. Two additional biological replicates are shown in Figure S5C. n.s., not significant; ES, elongating/elongated spermatids; RS, round spermatids; SPC, spermatocytes; Diff SPG, differentiating spermatogonia; Undiff SPG, undifferentiated spermatogonia. (C) In situ sequencing of mouse testis samples targeting 22 genes. ES, elongating/elongated spermatids; RS, round spermatids; Diff SPG, differentiating spermatogonia; Undiff SPG, undifferentiated spermatogonia; Endo, endothelial cells. White dashed lines outline the seminiferous tubules in the image. Scale bars represent 20 μm (2 μm for the inset). (D) KNN calculation of cell-type compositions of microenvironment surrounding mouse undifferentiated versus differentiating spermatogonia using data generated in (C). K = 5 neighbors was used. Plots showing K = 10 and 15 are shown in Figure S5E. n.s., not significant; ES, elongating/elongated spermatids; RS, round spermatids; SPC, spermatocytes; Diff SPG, differentiating spermatogonia; Undiff SPG, undifferentiated spermatogonia. (E) Spatial mapping of human undifferentiated and differentiating spermatogonia using the Slide-seq data. Scale bar, 300 μm. (F) Comparison of cell-type compositions of the microenvironment surrounding human undifferentiated versus differentiating spermatogonia. K = 10 neighbors was used. Plots showing K = 15, as well as for a different replicate are shown in Figure S5G. n.s., not significant; ES, elongating/elongated spermatids; RS, round spermatids; SPC, spermatocytes; Diff SPG, differentiating spermatogonia; Undiff SPG, undifferentiated spermatogonia. (G) Comparison in endothelial cell composition of microenvironment surrounding human undifferentiated versus differentiating spermatogonia using multiplexed smFISH data. Diff SPG, differentiating spermatogonia; Undiff SPG, undifferentiated spermatogonia. Red arrowhead, endothelial cells; magenta arrowhead, undifferentiated spermatogonium; green arrowhead, differentiating spermatogonium. White dashed lines outline the seminiferous tubules in the image. Scale bars represent 70 μm (10 μm for the inset).
Figure 5.
Figure 5.. Diabetes causes disruptions in spatial arrangements of testicular cell types in the seminiferous tubules
(A) Spatial mapping of testicular cell types for wild-type (WT) and ob/ob samples. Scale bar, 500 μm. (B) The spatial expression pattern of Smcp is disrupted in a representative ob/ob seminiferous tubule. ES, elongating/elongated spermatid; RS, round spermatid; SPC, spermatocyte; SPG, spermatogonium. Scale bar, 30 μm. (C) The ES purity score for each Slide-seq bead in a representative WT and ob/ob seminiferous tubule, respectively. The mean purity score for the beads with non-zero value in each tubule is also shown. Scale bar, 30 μm. (D) The mean purity score for each seminiferous tubule with at least 50 ES beads from the WT and ob/ob samples (n = 3 biological replicates per condition). Comparison of the purity score between the two conditions was performed using the Mann-Whitney U test. (E) Left: two clusters of WT seminiferous tubule structures revealed by the principal components of pairwise spatial contact frequencies in WT seminiferous tubules. The stage information of each tubule is labeled. Right: projection of ob/ob seminiferous tubules onto the two clusters shown in the left plot. (F) Mann-Whitney U test (n = 3 biological replicates per condition) on pairwise spatial cellular contact frequencies between WT and ob/ob seminiferous tubules under the two clusters. Signed p values of significant increases (positive) and decreases (negative) in spatial contact frequencies between cell types are shown.

References

    1. Abdulle LE, Hao J-L, Pant OP, Liu X-F, Zhou D-D, Gao Y, Suwal A, and Lu C-W (2019). MALAT1 as a Diagnostic and Therapeutic Target in Diabetes-Related Complications: A Promising Long-Noncoding RNA. Int. J. Med. Sci 16, 548–555. - PMC - PubMed
    1. Adams SR, Maezawa S, Alavattam KG, Abe H, Sakashita A, Shroder M, Broering TJ, Sroga Rios J, Thomas MA, Lin X, et al. (2018). RNF8 and SCML2 cooperate to regulate ubiquitination and H3K27 acetylation for escape gene activation on the sex chromosomes. PLoS Genet. 14, e1007233. - PMC - PubMed
    1. Alon S, Goodwin DR, Sinha A, Wassie AT, Chen F, Daugharthy ER, Bando Y, Kajita A, Xue AG, Marrett K, et al. (2021). Expansion sequencing: Spatially precise in situ transcriptomics in intact biological systems. Science 371, eaax2656. - PMC - PubMed
    1. Alves MG, Martins AD, Cavaco JE, Socorro S, and Oliveira PF (2013). Diabetes, insulin-mediated glucose metabolism and Sertoli/blood-testis barrier function. Tissue Barriers 1, e23992. - PMC - PubMed
    1. Alves-Lopes JP, and Stukenborg J-B (2018). Testicular organoids: a new model to study the testicular microenvironment in vitro? Hum. Reprod. Update 24, 176–191. - PubMed

Publication types

MeSH terms

LinkOut - more resources