. 2021 Nov 2;37(5):109956.
doi: 10.1016/j.celrep.2021.109956.

Expeditious recruitment of circulating memory CD8 T cells to the liver facilitates control of malaria

Affiliations

Expeditious recruitment of circulating memory CD8 T cells to the liver facilitates control of malaria

Mitchell N Lefebvre et al. Cell Rep. .

Abstract

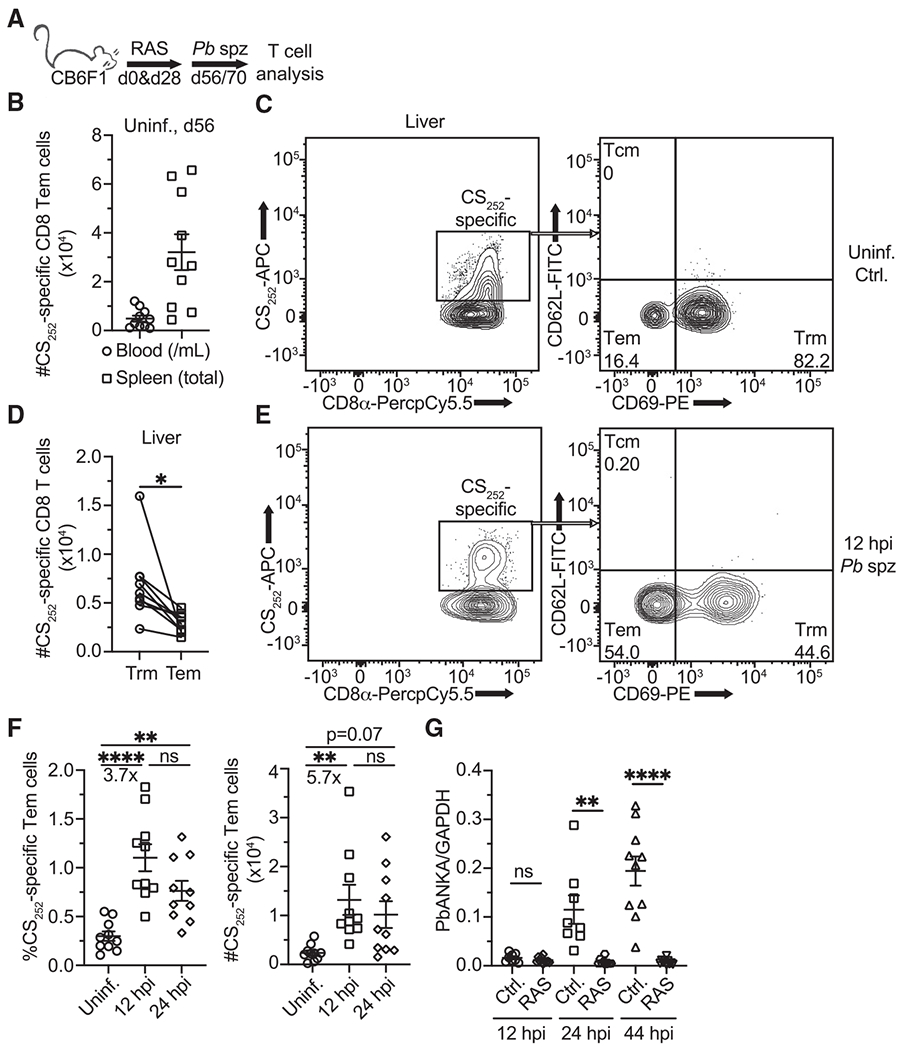
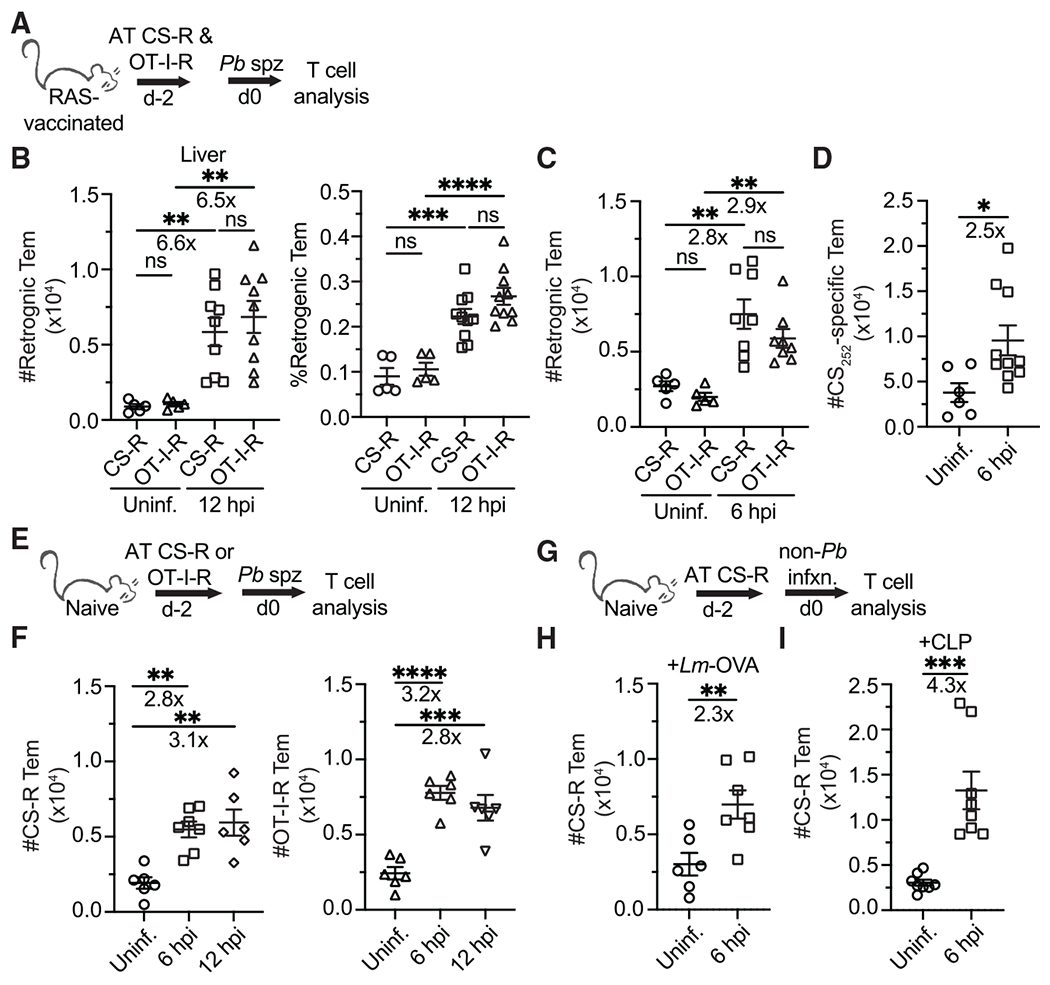
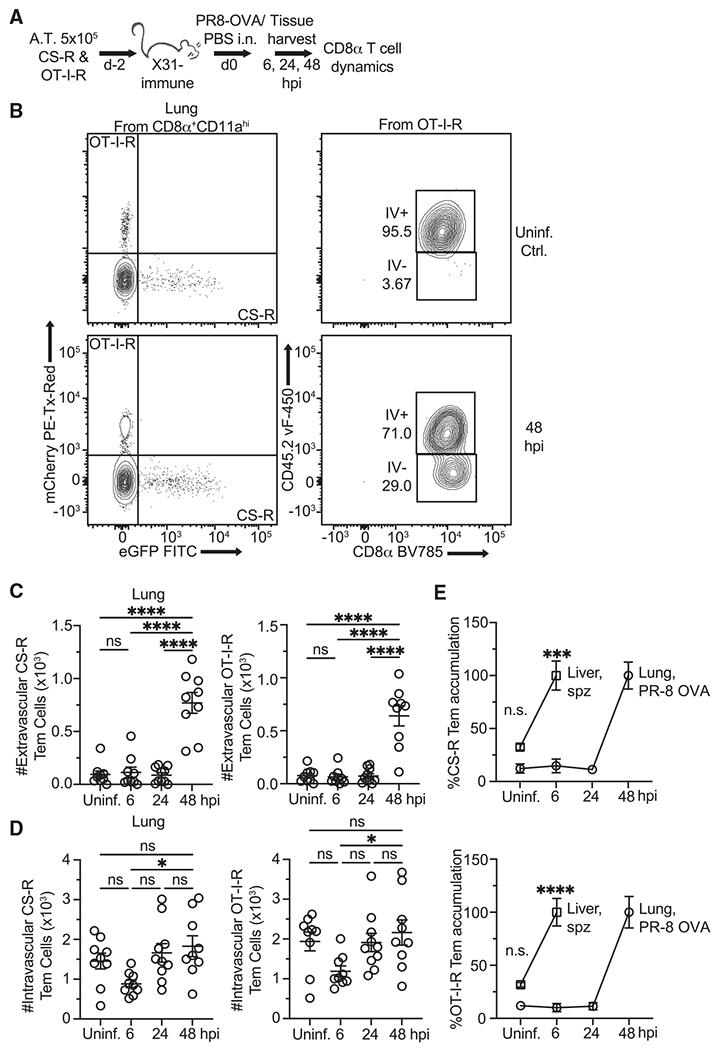
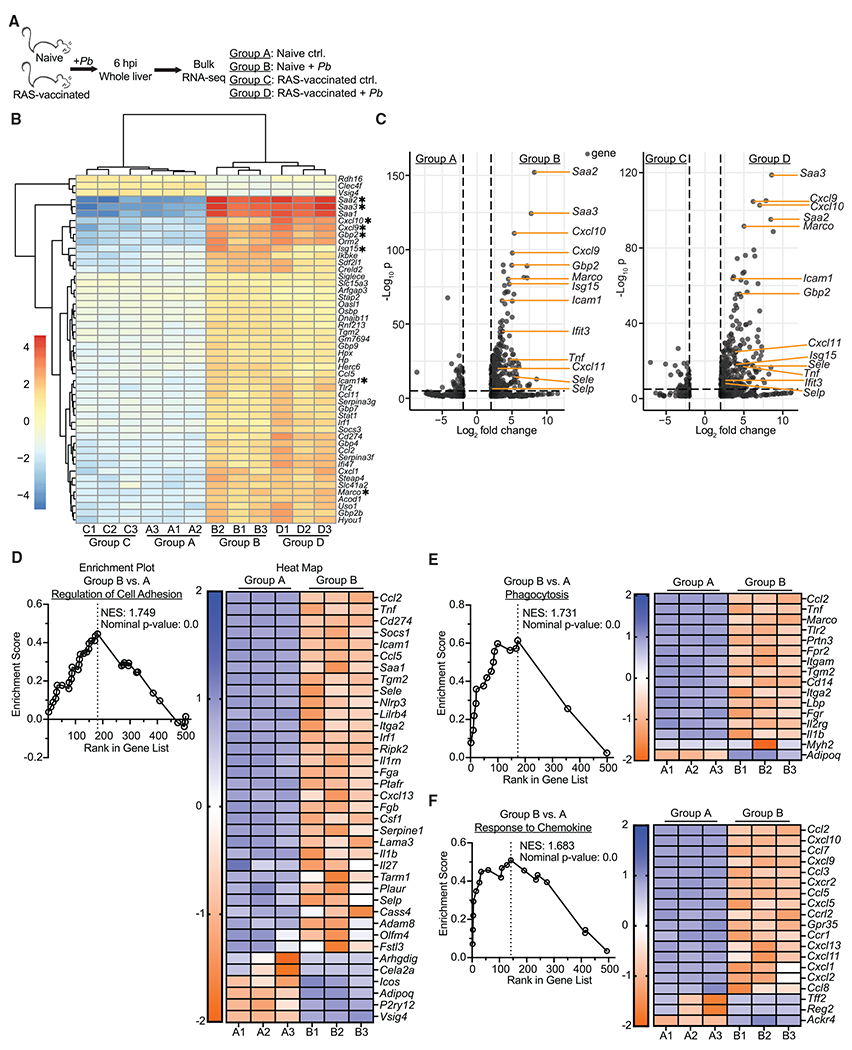
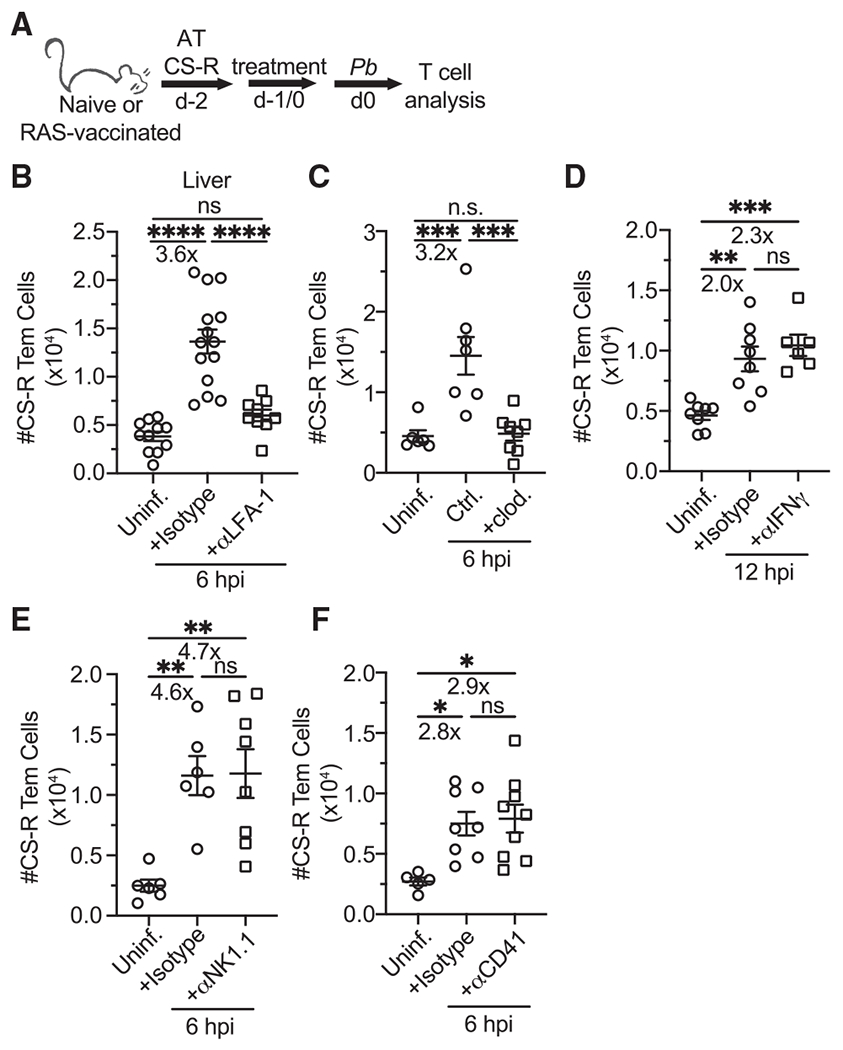
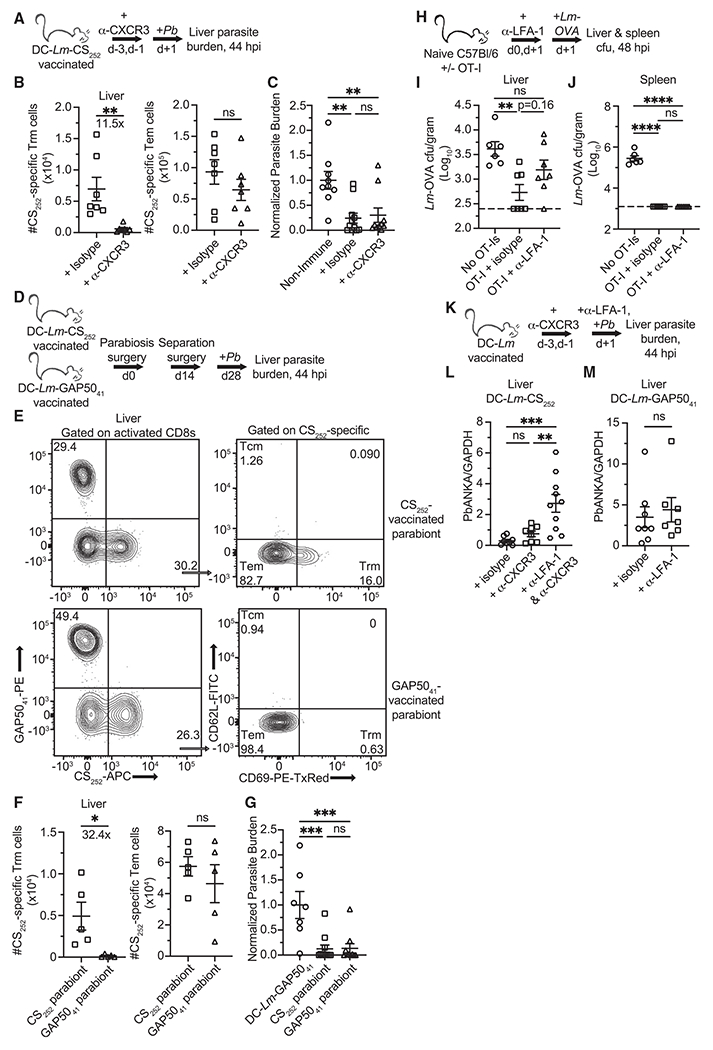
Circulating memory CD8 T cell trafficking and protective capacity during liver-stage malaria infection remains undefined. We find that effector memory CD8 T cells (Tem) infiltrate the liver within 6 hours after malarial or bacterial infections and mediate pathogen clearance. Tem recruitment coincides with rapid transcriptional upregulation of inflammatory genes in Plasmodium-infected livers. Recruitment requires CD8 T cell-intrinsic LFA-1 expression and the presence of liver phagocytes. Rapid Tem liver infiltration is distinct from recruitment to other non-lymphoid tissues in that it occurs both in the absence of liver tissue resident memory "sensing-and-alarm" function and ∼42 hours earlier than in lung infection by influenza virus. These data demonstrate relevance for Tem in protection against malaria and provide generalizable mechanistic insights germane to control of liver infections.

Keywords: CD8 T cells; liver-stage immunity; malaria.


Conflict of interest statement

Declarations of interests The authors declare no competing interests.

Figures

Figure 1.
Figure 1.. Accumulation of liver Tem after sporozoite challenge of RAS-vaccinated mice
(A) Experimental schematic for (B)–(F). CB6F1 mice received intravenous (i.v.) vaccinations with 104 PbANKA (Pb) radiation attenuated sporozoites (RAS) 28 days apart. Mice were challenged with 2 × 10⁴ virulent Pb sporozoites 56 or 70 days after the first RAS vaccination. Blood, spleens, and livers were collected for T cell analysis via flow cytometry prior to or 12- and 24-h post-infection (hpi). (B) Numbers of CS252-specific Tem cells in the blood (per mL) and spleen of RAS-vaccinated mice 1 month after 2nd RAS dose. Tem cells are defined as live singlets that bind to the CS252 tetramer and are CD8α+CD11ahiCD62LCD69. (C) Representative flow cytometry (gated on live CD8α+CD11ahi singlet events) depicting CS252-specific (left) Tem and Trm phenotype populations (right) in the liver of RAS-vaccinated mice 56 days after the first RAS vaccination. Tetramer staining identifies CS252-specific cells. Numbers represent frequencies. (D) Pairwise comparison of CS252-specific Trm and Tem phenotype cells recovered from the livers of vaccinated mice in B). Liver Trm cells are defined as CD8α+CD11ahiCD62LCD69+. (E) Representative flow cytometry (gated on live CD8α+CD11ahi singlet events) depicting CS252-specific (left) Tem and Trm phenotype populations (right) in the liver of mice 12 hpi with virulent Pb sporozoites. Numbers represent frequencies. (F) Frequencies and numbers of CS252-specific Tem phenotype cells recovered from livers prior to or 12 and 24 hpi with Pb sporozoites. (G) Unvaccinated (infected control) and RAS-vaccinated (as in 1A) mice were challenged with 104 virulent Pb spz. RNA was extracted from the liver hepatocyte fractions at 12, 24, and 44 hpi. Pb 18S ribosomal RNA transcripts were quantified via real-time qRT-PCR and normalized to mouse GAPDH transcripts. All data are combined from two independent experiments, each with at least 3 mice per group. Symbols represent individual mice and mean ± SEM are depicted. (D) Paired two-tailed t test was performed assuming similar standard deviation (SD). (F) One-way ANOVA (Tukey post hoc test) comparing the mean of each column to the mean of every other column was performed. (G) Unpaired two-tailed t tests assuming similar SD were performed between RAS- and un-vaccinated groups at each time point. *p ≤ 0.05, **p ≤ 0.01, ***p ≤ 0.001, ****p ≤ 0.0001; ns, p > 0.05.
Figure 2.
Figure 2.. Liver infection drives Tem infiltration of the liver
(A, E, and G) Experimental schematics. CS and/or OT-I TCR-retrogenic (Rtg) memory cells were enriched from the spleens of DC-Lm-vaccinated donor mice (see Figure S2) via a CD8α+ T cell enrichment and adoptively transferred (AT) i.v. (5 × 10⁵ cells of one or both types) into either RAS-vaccinated mice that received 1 dose of 104 RAS 1–2 months prior to rechallenge or unvaccinated mice. Mice receiving Rtg cells remained uninfected or were challenged with Pb sporozoites. Livers were harvested at either 6 or 12 hpi. (B) Quantification of Rtg Tem cell numbers and frequencies in livers of RAS-vaccinated mice that were uninfected or 12 hpi with 3 × 3 104 virulent Pb sporozoites. Rtg Tem cells are defined by an expression profile of CD8α+CD11ahiCD45.1+ CD62L. CS252-Rtg (CS-R) cells expressing eGFP are detected in the FITC channel, whereas OT-I-Rtg (OT-I-R) cells expressing mCherry are detected in the PE-TxRed channel. (C and D) Quantification of liver-localized CS-R and OT-I Tem (C) and endogenous (D) CS252-specific Tem cells at 6 hpi with Pb sporozoites in RAS-vaccinated mice. (E–I) Quantification of liver-localized CS-R and/or OT-I-R Tem cells in unvaccinated mice 6 h postinoculation with either Pb sporozoites (E and F), 106 recombinant virulent Lm expressing secreted OVA peptide (G and H), or cecal ligation and puncture surgery (G and I). All data are combined from 2 independent experiments, each with 2–5 mice per group. Symbols represent individual mice and mean ± SEM are depicted. (B, C, and F) One-way ANOVA (Tukey post hoc test) comparing the mean of each column to the mean of every other column was performed. (D, H, and I) Unpaired two-tailed t tests assuming similar SD were performed. *p ≤ 0.05, **p ≤ 0.01, ***p ≤ 0.001, ****p ≤ 0.0001, ns p > 0.05.
Figure 3.
Figure 3.. Rapid recruitment of Tem is unique to the liver
(A) Experimental schematic. Mice 5 weeks post-recovery from influenza A (IAV) X31 (H3N2) infection were injected with memory CS-R and OT-I-R Tem cells and treated by intranasal (in) infusion of PBS or IAV PR8-OVA (H1N1). Mice were injected i.v. with labeled anti-CD45.2 antibody prior to tissue harvest to distinguish vascular from parenchymal T cells. Lungs were harvested for T cell analysis 6–48 hpi. (B) Representative flow cytometry showing how TCR-Rtg cells were categorized as IV+ (intravascular) or IV (extravascular). (C) Quantification of lung-localized extravascular (IV) TCR-Rtg Tem cells from mice at various time points after PR8-OVA infection. (D) Quantification of lung-localized intravascular (IV+) TCR-Rtg Tem cells from mice at various time points after PR8-OVA infection. (E) Normalized comparison of Rtg Tem accumulation over time in the liver and lungs after infection with their respective pathogens. All data are combined from 2 independent experiments, each with 3–4 mice per group. Symbols represent individual mice and mean ± SEM is depicted. (C and D) One-way ANOVA (Tukey post hoc test) comparing the mean of each column to the mean of every other column was performed. (E) Unpaired two-tailed t tests assuming similar SD comparing uninfected and 6 hpi groups were performed. *p ≤ 0.05, **p ≤ 0.01, ***p ≤ 0.001, ****p ≤ 0.0001; ns, p > 0.05.
Figure 4.
Figure 4.. Liver-stage malaria infection rapidly triggers an inflammatory state in the liver
(A) Experimental schematic. Age matched female naive and RAS-vaccinated (one dose of 104 RAS i.v. 28 days before sporozoite challenge) CB6F1 mice were unchallenged or received 3 × 10⁴ virulent Pb sporozoites. Livers were harvested at 6 hpi for RNA-seq. (B) Heatmap displaying the top 60 differentially expressed genes (defined by adjusted p value) across the groups. Genes are sorted based on hierarchical clustering. (C) Volcano plots comparing individual gene expression differences between various groups. Genes with a log2 fold change between −2 and 2 are excluded. Genes of particular interest are labeled. Dashed lines indicate thresholds of significance for log2 fold change (x axis, ±2) and adjusted p value (y axis, <0.05). (D–F) Enrichment plots and associated heatmaps for gene pathways previously defined by the Gene Ontology database. Data are from a single experiment with 3 biological replicates per group. Expression values were obtained via analysis with DESeq2, R, and edgeR. Thresholds for significance: log2 fold change >2 and <−2; normalized p value <0.05.
Figure 5.
Figure 5.. Mechanisms underpinning rapid Tem recruitment to the liver
(A) Experimental schematic. Naive CD45.2 mice received 5 × 10⁵ CD45.1+eGFP+ memory CS-R Tem cells via adoptive transfer, and some recipients were challenged with Pb sporozoites. Some mice also received various treatments including blocking antibodies/drugs (α-LFA-1 and α-IFNγ) and depleting antibodies/drugs (clodronate liposomes, α-NK1.1, α-CD41). Isotype control antibodies were delivered at the same time as the corresponding experimental antibody. (B–F) Quantification of CS-R Tem cells 12 (D) or 6 (B, C, E, and F) hpi with 3 × 10⁴ Pb sporozoites. Treatment doses, route of administration, and treatment administration time: α-LFA-1,300 μg i.v. 3 h prior; clodronate liposomes, 200 μL i.v. 1 day prior; α-IFNγ, 1 mg intraperitoneally (i.p.) 1 day prior; α-NK1.1, 300 μg and 100 μg i.v. 2 and 1 days prior, respectively; and α-CD41, 500 μg i.v. 3 h prior. Experiments were performed in previously naive CB6F1 mice, except for (D), in which CS-R cells were transferred into RAS-vaccinated mice. All data are combined from 2–3 independent experiments, each with 2–5 mice per group. Symbols represent individual mice and mean ± SEM is depicted. (B–F) One-way ANOVA (Tukey post hoc test) comparing the mean of each column to the mean of every other column was performed. *p ≤ 0.05, **p ≤ 0.01, ***p ≤ 0.001, ****p ≤ 0.0001; ns, p > 0.05.
Figure 6.
Figure 6.. Tem cells mediate immunity to liver infection in a recruitment-dependent fashion
(A, D, and K) Experimental schematics for protection against virulent Pb sporozoites. 104 live sporozoites were injected i.v. into mice. Liver parasite burden was measured 44 hpi. (B) Quantification of liver localized CS252-specific liver Trm and Tem cells in DC-Lm-CS252-vaccinated mice 2 days after the 2nd α-CXCR3 dose. (C) Normalized parasite burden showing degree of liver sporozoite infection 44 hpi in naive or isotype control and α-CXCR3-treated DC-Lm-CS252-vaccinated mice. (E) Representative flow from separated parabiont mice demonstrating that antigen-specific circulating memory CD8 T cell populations equilibrate in the liver, whereas liver Trm compartments do not equilibrate. Top row: DC-Lm-CS252-vaccinated parabiont; bottom row: DC-Lm-GAP5041-vaccinated parabiont. (F) Mice that received either DC-Lm-CS252 or DC-Lm-GAP5041 vaccinations were joined via parabiosis. Mice were surgically separated 14 days after parabiosis surgery. 14 days post separation, tissues were harvested for quantification of liver localized CS252-specific liver Trm and Tem cells. (G) Normalized parasite burden showing degree of liver sporozoite infection 44 hpi in mice that were DC-Lm-GAP5041 immunized or CS252 and GAP5041-vaccinated parabionts. (H) Experimental schematic for protection against virulent Lm-OVA. 5 × 10⁵ OT-I Tem cells were isolated from the spleens of DC-Lm-OVA vaccinated C57BL/6 mice and adoptively transferred into naive recipient mice. (I and J) Quantification of virulent Lm-OVA colony-forming unit (CFU) recovered from the livers and spleens of infected mice 48 hpi. Horizontal dashed lines indicate the limit of detection. (L and M) Parasite burden showing degree of liver sporozoite infection 44 hpi in DC-Lm-CS252 and DC-Lm-GAP5041-vaccinated mice that were pre-treated with various antibodies. All data are combined from 2 independent experiments, each with 2–5 mice per group. Symbols representing individual mice and mean ± SEM are depicted. (C, G, I, J, and L) One-way ANOVA (Tukey post hoc test) comparing the mean of each column to the mean of every other column was performed. (B, F, and M) Unpaired two-tailed t tests assuming similar SD were performed. *p ≤ 0.05, **p ≤ 0.01, ***p ≤ 0.001, ****p ≤ 0.0001; ns, p > 0.05.

Comment in

References

    1. Agnandji ST, Lell B, Fernandes JF,Abossolo BP, Methogo BG, Kabwende AL, Adegnika AA, Mordmüller B, Issifou S, Kremsner PG, et al.; RTS,S Clinical Trials Partnership (2012). A phase 3 trial of RTS,S/AS01 malaria vaccine in African infants. N. Engl. J. Med 367, 2284–2295. - PMC - PubMed
    1. Ariotti S, Hogenbirk MA, Dijkgraaf FE, Visser LL, Hoekstra ME, Song JY, Jacobs H, Haanen JB, and Schumacher TN (2014). T cell memory. Skin-resident memory CD8+ T cells trigger a state of tissue-wide pathogen alert. Science 346, 101–105. - PubMed
    1. Badovinac VP, Messingham KA, Jabbari A, Haring JS, and Harty JT (2005). Accelerated CD8+ T-cell memory and prime-boost response after dendritic-cell vaccination. Nat. Med 11, 748–756. - PubMed
    1. Beura LK, Mitchell JS, Thompson EA, Schenkel JM, Mohammed J, Wijeyesinghe S, Fonseca R, Burbach BJ, Hickman HD, Vezys V, et al. (2018). Intravital mucosal imaging of CD8+ resident memory T cells shows tissue-autonomous recall responses that amplify secondary memory. Nat. Immunol 19, 173–182. - PMC - PubMed
    1. Borges da Silva H, Wang H, Qian LJ, Hogquist KA, and Jameson SC (2019). ARTC2.2/P2RX7 Signaling during Cell Isolation Distorts Function and Quantification of Tissue-Resident CD8+ T Cell and Invariant NKT Subsets. J. Immunol 202, 2153–2163. - PMC - PubMed

Publication types

MeSH terms

Substances