. 2021 Nov 2;37(5):109916.
doi: 10.1016/j.celrep.2021.109916.

Epithelial-myeloid exchange of MHC class II constrains immunity and microbiota composition

Affiliations

Epithelial-myeloid exchange of MHC class II constrains immunity and microbiota composition

W Zac Stephens et al. Cell Rep. .

Abstract

Intestinal epithelial cells (IECs) have long been understood to express high levels of major histocompatibility complex class II (MHC class II) molecules but are not considered canonical antigen-presenting cells, and the impact of IEC-MHC class II signaling on gut homeostasis remains enigmatic. As IECs serve as the primary barrier between underlying host immune cells, we reasoned that IEC-intrinsic antigen presentation may play a role in responses toward the microbiota. Mice with an IEC-intrinsic deletion of MHC class II (IECΔMHC class II) are healthy but have fewer microbial-bound IgA, regulatory T cells (Tregs), and immune repertoire selection. This was associated with increased interindividual microbiota variation and altered proportions of two taxa in the ileum where MHC class II on IECs is highest. Intestinal mononuclear phagocytes (MNPs) have similar MHC class II transcription but less surface MHC class II and are capable of acquiring MHC class II from IECs. Thus, epithelial-myeloid interactions mediate development of adaptive responses to microbial antigens within the gastrointestinal tract.

Keywords: H2-Ab1; MHC class II; antigen processing; dendritic cell; immunity; intestinal epithelia; macrophage; microbiome.


Conflict of interest statement

Declaration of interests The authors declare no competing interests.

Figures

Figure 1.
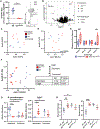
Figure 1.. MHC class II is differentially expressed on epithelia along the murine intestinal tract and inducible by the microbiota
(A and B) The percentage positive (A) and expression level (B) (MFI, median fluorescent intensity) of the H2-A protein on IECs of SPF-raised C57BL/6 mice. n = 6 mice, a single experiment representative of three independent experiments is shown. Letters denote significance between groups. Ordinary one-way ANOVA with Tukey’s multiple comparison correction was used. (C) Representative cryosection immunohistochemistry image of a WT ileal villus illustrating intense apical granular cytoplasmic staining (arrow) of H2-A on IECs, and diffuse basolateral surface H2-A on IECs (asterisk). (D and E) The percentage positive (D) and MFI (E) of H2-A on GF and SPF male Swiss-Webster mice. n = 7–8 mice per group. An unpaired Student’s t test was used, ****p < 0.0001. (F) A representative histogram of H2-A staining from the ileum shows very low H2-A on GF mice is present above the isotype control background signal.
Figure 2.
Figure 2.. Lack of IEC-intrinsic MHC class II has no effect on the epithelial transcriptome but controls the variability of microbial communities
(A) Ileum-derived IECs stained for H2-A show knockout of H2-A on IECs in IECΔMHCII mice. n = 11 WT and n = 8 IECΔMHCII. A Student’s t test was used. (B) Volcano plot of RNA expression levels from sorted ileal IECs shows that only the targeted gene (H2-Ab1) is significantly changed (after FDR correction; 13,481 genes tested) in IECΔMHCII mice. The increased Mt1 is an artifact that reflects Cre expression, due to a small fragment of this gene left on the Villin:Cre expression construct. (C and D) Principal coordinates plots from Bray-Curtis (C) or weighted-UniFrac (D) metrics of fecal microbiota from mice housed by genotype (2 cages per genotype, 3–4 mice per cage). Permanova p values are shown with 9,999 permutations. (E) Weighted-UniFrac distances from fecal microbiota of male mice individually housed post-weaning. n = 6WT and 5 IECΔMHCII, except at week 5 when only 3WT samples had enough quality sequences for analysis. Two-way ANOVA with Holm-Sidak multiple testing correction was used. (F) Principal coordinates plot of ileal microbiota from Bray-Curtis distances along with Anosim results with cage and genotype factors as the independent variables. (G) Relative abundance of 2 taxa significantly different between genotypes in the ileum when separately housed. Both taxa initially identified with ANCOM (see main text) at the level of ASVs (2 each) were plotted as means of the ASVs summarized to their best taxonomic classification with significance between groups on plots shown with two-way ANOVA with Tukey’s correction for multiple testing. (H) Ileal microbiota alpha-diversity metrics. A Kruskal-Wallis test with Dunn’s correction was used.
Figure 3.
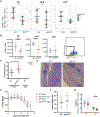
Figure 3.. Lack of IEC-derived MHC class II results in reduced microbiota-responsive Tregs and increased susceptibility to colitis
(A) The proportion of Helios Tregs (CD3+, CD4+, Foxp3+) in 9- to 12-week-old female mice under homeostatic conditions. Data are represented as SuperPlots showing three experimental replicates. Bars are mean and SD among experimental replicates. Stars indicate genotype significance using a 2-way ANOVA with experiment and genotype as main effects (see Table S2 for a full ANOVA table). (B) Absolute numbers of Helios Tregs from one experiment. An unpaired t test was used. A representative flow plot of Helios gating from mLN Tregs was used. (C) Histology scores from DSS-treated mice. Combined data from two experiments, indicated by shape, are shown. n = 10 WT and n = 10 IECΔMHCII. An unpaired t test with Welch’s correction was used. Untreated WT slide scores were included as control but not statistically tested. (D) Representative images of H&E-stained sections from DSS experiments. (E and F) Weight loss (E) and colon lengths (F) from 2 DSS experiments. (G) RORγt+ Tregs in Peyer’s patches and mLN. Data are representative of 4 experiments, among which decreases in PP RORγt+ Tregs are sometimes observed. A Student’s t test with Holm-Sidak’s multiple testing correction was used.
Figure 4.
Figure 4.. IEC intrinsic H2-A influences H2-A levels on MNP cells
(A) The initial observation of the proportion of H2-A+ cells among immune cells with broad myeloid markers. One experiment; a Student’s t test with Holm-Sidak’s multiple testing correction was used. (B) Representative flow plots illustrate the gating strategy used to identify P1–4 monocyte/macrophage cells. CD45+, Lin (CD3, NK1.1, Siglec-F, CD19), CD11b+, CD11c+ cells are input. (C–E) Proportion (C and E) and MFI (D) of P1, P2, and P3/4 monocyte/macrophages (C and D) and DCs (D and E) under homeostatic SPF conditions in 9-week-old male and female mice. P3/4 are not shown for PP because they are not CD64+. n = 6 WT and 5 IECΔMHCII. Data are representative of 2 experiments. A Student’s t test with Holm-Sidak’s multiple testing correction was used. (F) As in (C)–(E) but showing the CD11c-negative subset of P3/4 macrophages.
Figure 5.
Figure 5.. MHC class II constrains immune responses toward intestinal microbes
(A and B) The distribution (A) and total number (B) of Ig clonotypes detected in PP scRNA-seq data. The rank-abundance curve (A) shows only the top 20 clonotypes along with the Shannon diversity indices for each genotype, which takes into account the total number and distribution of clonotypes. Clonotype analysis was performed after subsampling without replacement to 3,215 observations in each group. Data are from one scRNA-seq experiment with an equivalent number of cells pooled from 4 WT or 4 IECΔMHCII mice. (C) Ig heavy-chain isotype frequency in PP from scRNA-seq data. (D and E) Total fecal IgA and IgG quantified by ELISA, normalized to fecal weight. n = 11–12 mice. Data are representative of 2 experiments. A t test with Welch’s correction was used. (F) The proportion of bacterial cells (SYBR+) from feces that are bound by immunoglobulins. Data are representative of 2 experiments. t tests with Holm-Sidak’s multiple testing correction were used. (G) Total fecal IgA and IgG are not different in T cell-deficient mice. n = 8 in both groups. A t test with Welch’s correction was used.
Figure 6.
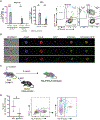
Figure 6.. MNPs can acquire H2-A from IECs to induce T cell responses
(A) Violin plots of H2-Ab1 transcripts from scRNA-seq data in the siLP show knockout of H2-Ab1 in IECs but normal expression in other known MHC class II+ cells types. (B) Results from in vitro association of MODEK (H2k haplotype) cells and H2-Ab1−/− C57BL/6 bone-marrow-derived MNPs. Data are expressed as a fold change of H2-Ak signal over the background from the average of MNPs incubated without MODEK cells. Two-way ANOVA with Holm-Sidak’s multiple comparison test within cell type to no MODEK control was used. (C) As in (B) (quantifying H2-Ak) but using MNPs sorted directly from the tissue of H2-Ab1−/− C57BL/6 mice. Ordinary one-way ANOVA with Tukey’s multiple comparison test was used. (D) The proportion of CFSE-labeled OT-II cells that underwent 1 or more divisions and were Foxp3+ after incubating with OVA-pulsed macrophages sorted directly from the tissue of WT or IECΔMHCII mice. Representative flow plots illustrate the gating strategy for assessing proliferating OT-II cells. Data are representative of 2 experiments; a Student’s t test was used.
Figure 7.
Figure 7.. MNPs can acquire MHC class II from IECs in vivo
(A) The proportion of mT+mG+ MNP subsets in the siLP. Cells subsets are pregated on Live, Dump (CD3, CD19, NK1.1, Ly6G), CD45+, and MHC class II+. Representative flow plots are shown for CD11c+ macrophages and DCs. Two-way ANOVA with Holm-Sidak correction was used. (B) Representative image panel of cells from imaging flow cytometry analysis of mT+mG+ MNPs. Cells are Live, Dump (CD3, IgM), CD45+, and MHC class II+. No CD11c or CD11b subsetting due to reduced channel availability on imaging cytometry platform was used. (C) A cartoon schematic of mixed MHC class II bone-marrow transfer experiments. (D) The percentage of host MHC class II (H2-Ab) positive donor cells (HLA-DR) in the siLP. Cells are CD11c P3/P4 macrophages gated as in previous figures. A representative plot (pregated on CD45+, Dump-, CD11b+/CD11c+, and CX3CR1+/CD64+ cells) is shown, along with an overlay of the H2-Ab isotype control demonstrating the MHC class II-haplotype specificity of the staining.

Similar articles

Cited by

References

    1. Amend SR, Valkenburg KC, and Pienta KJ (2016). Murine hind limb long bone dissection and bone marrow isolation. J. Vis. Exp 10, 53936. - PMC - PubMed
    1. Amir A, McDonald D, Navas-Molina JA, Kopylova E, Morton JT, Zech Xu Z, Kightley EP, Thompson LR, Hyde ER, Gonzalez A, and Knight R (2017). Deblur Rapidly Resolves Single-Nucleotide Community Sequence Patterns. mSystems 2, e00191–e16. - PMC - PubMed
    1. Anderson MJ (2001). A new method for non-parametric multivariate analysis of variance. Austral Ecol. Published online June 28, 2008. 10.1111/j.1442-9993.2001.01070.pp.x. - DOI
    1. Atarashi K, Tanoue T, Oshima K, Suda W, Nagano Y, Nishikawa H, Fukuda S, Saito T, Narushima S, Hase K, et al. (2013). Treg induction by a rationally selected mixture of Clostridia strains from the human microbiota. Nature 500, 232–236. - PubMed
    1. Bain CC, and Schridde A (2018). Origin, differentiation, and function of intestinal macrophages. Front. Immunol 9, 2733. - PMC - PubMed

Publication types

MeSH terms

Substances